Robustness of asymptotic and bootstrap tests for multivariate... 157
ROBUSTNESS OF ASYMPTOTIC AND BOOTSTRAP TESTS FOR
MULTIVARIATE HOMOGENEITY OF COVARIANCE MATRICES
Robustez de testes assintóticos e de Bootstrap para homogeneidade de covariâncias em populações multivariadas
Roberta Bessa Veloso Silva1, Daniel Furtado Ferreira2, Denismar Alves Nogueira3
ABSTRACT
The present work emphasizes the importance of testing hypothesis on homogeneity of covariance matrices from multivariate
k populations. The violation of the assumption of the homogeneity of covariance matrices affects the performance of the tests and the coverage probability of the confidence regions. This work intends to apply two tests of homogeneity of covariance and to evaluate type I error rates and power using Monte Carlo simulation in normal populations and robustness in non normal populations. Multivariate Bartlett s test (MBT) and its bootstrap version (MBTB) were used. Different configurations are tested combining sample sizes, number of variates, correlation and number of populations. Results show that the bootstrap test was considered superior to the asymptotic test and robust, since it controls the type error I rate.
Index terms: Simulation; type I error rate, power, Monte Carlo.
RESUMO
O presente trabalho ressalta a importância da aplicação de testes sobre a hipótese de igualdade de matrizes de covariâncias de
k
populações. A violação da pressuposição da homogeneidade das covariâncias afeta diretamente a qualidade dos testes e a probabilidade de cobertura das regiões de confiança.Por essa razão, neste trabalho propõe-se aplicar dois testes de homogeneidade de covariâncias e avaliar as suas performances mediante uso de simulação Monte Carlo em populações normais e a robustez em situações não-normais avaliando-se o erro tipo I e o poder. Os testes utilizados foram: teste de Bartlett multivariado e a sua versão bootstrap. Foram feitas combinações entre os tamanhos amostrais, número de variáveis, correlação e número de populações. Os resultados obtidos permitiram concluir que o teste de bootstrap foi considerado superior aos assintótico e robusto, controlando o erro tipo I.Termos para indexação: Simulação; erro tipo I; poder, Monte Carlo.
(Received in june 2, 2005 and approved in june 6, 2006)
INTRODUCTION
In the multivariate inference, in general, is assumed normality, homogeneity of the covariance matrices and independence of the sample observations. The violation of the assumption of covariance homogeneity has directly effects on tests performance and on the coverage probability of the confidence regions. For this reason tests for the null hypothesis of equality of k populational covariance matrices must be applied. For the specific case of normal samples there are already several usual and reliable tests in the literature.
The researchers in general have the need of testing hypotheses on populational parameters. When testing the hypotheses the researcher takes the risk of making wrong decisions, in other words, to incur in errors. These are called type I and type II errors. The type I error is committed
SILVA, R. B. V. et al. 158
increased. Usually, a researcher determines the value and ignores the values . As consequence it is easier to incur in a type II than in a type I error. The probability (1 ) of not incurring a type II error is the power of the test, that is the probability of rejecting H0, given it is false. The power
of a test (Borges & Ferreira, 2002) is the probability of detecting differences among treatment levels when they really exist.
The homogeneity tests assume multivariate normality. If this assumption was violated these tests are sensitive on the control of the type I error and on the power. They do not differentiate between the lack of normality and possible covariance heterogeneity. The test of equality of
k
covariance matrices proposed by Bartlett (1954), one of the most used, is strongly affected when the assumption of multivariate normality is violated. The bootstrap tests have been suggested in the literature as an alternative to accomplish inference in the most varied situations. In the specific case of the covariance matrices comparisons, the tests were already successfully used, however, in very restricted situations.This article aimed to propose a bootstrap version of the multivariate Bartlett test for the equality of covariance matrices and to compare its performance with the asymptotic approach, evaluating the power and the type I error rates in normal and non-normal situations, where this last case was used to check the robustness.
1 2 2 1 1 1 1 2 exp 2 i i n
k n k
np T
i ij i i ij i
i j i
L
METHODOLOGY
Two tests were considered in this article: the multivariate Bartlett s test (MBT) for equality of covariance matrices and its respective bootstrap version (MBTB).
Let i1, i2,..., ij,..., inibe a random sample of size
n
ifrom the ith population, where1, 2,...,
T
ij ij ij ijp is the random p-dimensional
vector from the jth sample unit and ith population, considering i 1, 2,...,kand j 1, 2,...,ni. Let the ith
populational mean vector be i (1 p), the covariance
matrix be i (p p)and
1 . k i i n n
The hypothesis of interest is given by:
0 1 2 1
: vs
: 1, 2,..., .
k
i
H
H i k
The multivariate test of Bartlett for covariance matrices
Under the alternative hypothesis, H1, from
equation ( 1) and under multivariate normality, the likelihood function is given by:
The likelihood function (2) was maximized. Thus, the maximum likelihood estimators of the ith populational mean vectors and covariance matrices were:
(1)
(2)
. . 1 1
. e
i i
n n
T
ij ij i ij i
j j
i i i
i i
n n
(3)
for i 1, 2,...,k.
Under the null hypothesis
H
0 and multivariate normality the likelihood function is:1 2 2 0 1 1 1 2 exp 2 i n k n np T
ij i ij i
i j
L (4)
Proceeding in the same previous way the populational mean vectors i estimators were identical to
those of the equations (3) and the common populational covariance matrix estimator was:
1 k i i i n n (5)
It is convenient to substitute the covariance matrices maximum likelihood estimators by the unbiased estimators given by:
1 i i i i n S n
and 1 1
Robustness of asymptotic and bootstrap tests for multivariate... 159 The modified likelihood ratio statistic is
1 2 1
2
i
k n
i i
n k
p
S
S
(7)
As 2 ln is asymptotically distributed as 2
(MOOD et al., 1974), the test statistic of the MBT is given by:
2
1
ln 1 ln
k
c p i i
i
n k S n S (8)
where k 1 p p 1 2. The degrees of freedom n were obtained comparing the dimension of the unrestricted likelihood function [pk p p( 1)k 2] with the dimension of the restricted likelihood function [pk p p( 1) 2]. Bartlett (1954) proposed a correction to improve the asymptotic properties of the approach. The modified test statistic is:
2 2
1
1
1 1 2 3 1
1
1 6 1 1
ln 1 ln .
k
i i
k
p i i
i
p p
n n k p k
n k S n S
(9)
Bootstrap test
A bootstrap version of the asymptotic test presented in section 2.1 was proposed. The null hypothesis
0
H was imposed combining the
k
multivariate samples in a common sample of size1
k
i i
n n with p-dimensional observations. The original observations were replaced by deviations ij ij i.. According to Johnson &
Wichern (1998), those deviations do not change the ith sample variability, since they represented translations in the original scale given by the sample mean. That precaution was taken to avoid those potential differences in the population means could be responsible for significantly differences in the results of bootstrap test for comparing covariance matrices.
The multivariate bootstrap test of Bartlett for comparing covariance matrices was denoted MBTB. The
basic ideas is to impose the null hypothesis H0combining
the samples into one, to resample with replacement the combined sample reproducing k new samples of size
n
i,1, 2,...,
i k, preserving the dimension and then computing the test statistics using equation (9). The results obtained in Bresamples were compared with the statistic values obtained in the original samples. If the proportion of values of the bootstrap distribution that overcame the test original values was inferior to the nominal significance level the hypothesis H0should be rejected. The algorithm for the
bootstrap test, MBTB, is given by: 1.determine the 2
statistic in the original sample using (9);
2.create the set 11,..., 1n1,..., k1,..., knk using the p-variate residual deviations from all sample observations;
3.resample with replacement, reproducing new
k
samples, where the elements were deviations ij*random selected from , given by
* *
, 1, 2,...,
i ij j ni for i 1, 2,..., ;k
4.restimate the bootstrap covariance matrix
S
i*from the set *i;5.estimate the statistic (9) and denote it 2for the th bootstrap resampling, where
1, 2,...,
B
;6.replicate B times the steps 3 to 5; 7.determine the boostrap p-values by
where ( ) is an indicator function. Monte Carlo simulations
The performance of the two tests was evaluated by computational Monte Carlo simulation. The type I error rate and power were recorded to determine the quality of the performance of the tests. Two different situations were also considered for evaluating the tests. First, it was considered the multivariate normal distribution and then it was simulated multivariate distributions using a linear transformation of random vectors formed by uniform and gamma independently distributed variates. In the last situation the evaluation of the robustness of the two tests
2 2 1
pv
B
SILVA, R. B. V. et al. 160
for the covariances comparison was accomplished measuring the type I error rates.
For evaluating the tests performance simulations were accomplished considering different numbers of population
( )
k
, sample sizes( )
n
i and number of variates ( )p . It still w as considered three p-dimensional distributions obtained from linear transformations of normal, gamma and uniform univariate variates. Those parameters (k n, i and p) were combined in factorial combination to simulated sample data from those three distributions.The
k
values were 2, 5 and 10, the number of variates pwas 2, 3, 5 and 10 and the sample sizes varying from 5 to 100. It was made 600 simulations of each configuration, of each distribution and under H0and H1. The MBT andMBTB were applied in each case. Two nominal significance levels (0.01and 0.05)were adopted. The observed p-values were confronted with the nominal significance levels . The proportion of simulations results that the test s p values were inferior or equal to the nominal level was computed. Under the null hypothesis H0this
proportion refers to the type I error rates and under H1,
to the power.
Non-normal situations were used to evaluate the robustness of the tests as in the control of the type I error rates as in the power. The normal distribution was used in simulations to propitiate an ideal condition that served as reference for the other non-normal distributions. The IML procedure of SAS® (SAS INSTITUTE, 2000) was used in
this work. The following algorithm was adopted for simulating the jth observation from the ith sample:
a) it was generated realizations of pvariates from each one of the three distributions. To generate samples from the univariate normal distribution the function rannor(seed) of the SASâ (SAS INSTITUTE, 2000) was used, where seed
represents the initial value of the process of generation of random numbers; from the uniform distribution, the function ranuni(seed); and from the gamma, rangam seed, . The seed value was settled as zero, so that the SAS system could use an initial value from the time of day. The parameter from the gamma distribution was settled in 1.5, to obtain a unimodal and right-skewed distribution;
b) the realizations of the independent and identically distributed (i.i.d) variates (Zr) were used to
compose the vector [ 1, 2,..., ]
T
p
Z Z Z Z ;
c) it was considered a single structure for the covariance matrix for ith population given by
2 1 2 1 2 3
1 1
1
p
p
i
p p p
(10)
For evaluating the type I error rates it was simulated
k
p opu lations w ith the sam e co varian ce m atrix, 1, 2,...,
i i k , i.e., it was performed simulations
under the null hypothesis H0of (1). For the power, the
covariance matrices 2, 3, , k were determined as a
multiple of 1, considering a criterion that depends on a
coefficient *
i for determining a degree of heterogeneity
of the covariance matrices. For that, the matrix 1was
settled by the expression (10) and the other covariance matrices were given by
*
1 i i, i 2, 3,...,k (11)
The criterion used to determine *
i was based on
the generalized variances of ias follow. First it was settled the value of , given by
1
k , (12)
as 2, 4, 8 and 16. Then, the auxiliary quantity d was calculated by
1 1
d
k , (13)
and finally the quantity *was obtained by 1 *
1 1 p
i d i . (14)
According to the previously defined quantities, the parameter represents the ratio between the largest and smallest generalized variances and the co n s ec u t iv e d i f f er en ce s amo n g th e r a ti o s o f generalized variances between each population and the first are d . Then, the values were settled in 0, 0.1, 0.5 and 0.9.
Robustness of asymptotic and bootstrap tests for multivariate... 161
T i F Fi i ,
where the Fimatrix is the Cholesky factor of iand was obtained using the function root ( i)from the SAS
®
System (SAS INSTITUTE, 2000), i 1, 2,...,k;
e) the p-variate random vector ijfrom the ith
population and jth sample unit was generated by the linear transformation given by
, 1, 2,..., and 1, 2,...,
ij F Zi i i k j ni
where, without loss of generality, the mean vector iwas
considered equal to a p dimensional vector of zeros; f) the steps (a), (b) and (e) were iterated until a sample of size
1
k
i i
n n was simulated.
RESULTS AND DISCUSSION
In the sequence the main results will be presented for the type I error rates and power of the two tests studied in this article. Two different situations were considered where samples from normal and non-normal (uniform and gamma) populations were drawn. Also, two nominal significance levels (5% and 1%) were considerate. Type I error rates under normal distribution
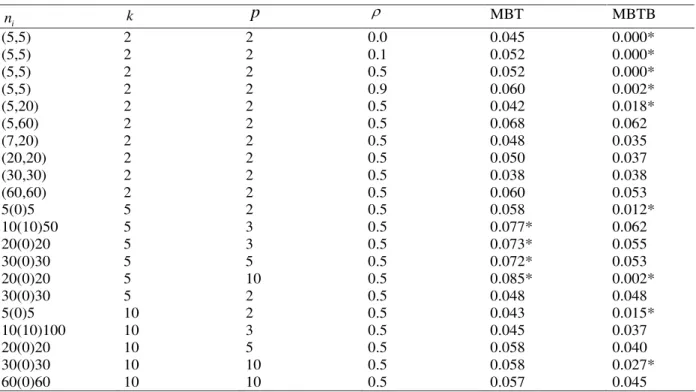
In Table 1 the type I error rates of the MBT and MBTB are presented under normality and considering
2
k populations for different values of , pand
n
i.The 95% confidence interval for the nominal significance level of 5% is [0.034; 0.071]. The results of the type I error rates were confronted with this interval.
The MBT controlled the type I error rates in almost all of simulated situations, except for some situations with p 3 for the sample sizes n1 n2 5, for
0.1
; n1 5 and2 20
n for
0
and0.9
; n1 5andn2 60 for0
and0.5
;n1 7and n2 20 for0.1
. For these situations MBT did not control the type I error rates and presented superior rates to the nominal significance level of 5%, and it is considered liberal (results not presented). A test is considered liberal when the type I error rates are significantly superior to the nominal significance level.The correlation structure had small or any influence in the type I error rates of MBT and of MBTB (Table 1). For instance, considering n1 n2 5 one can realize that the
changes in the correlation coefficient did not alter the type
I error rates significantly. Therefore, for the other sample sizes the results were presented only for 0.5 .
The MBTB, in general, was conservative test for small samples, presenting in some situations null type I error rates (Table 1). A test is conservative when the type I error rates are significantly inferior to the nominal significant level. There was a tendency of MBTB performance to improve as the sample sizes increase, considering that it presented type I error rates not significantly different from the nominal level of 5%. It was observed that the increase of the number of variates also affected the multivariate bootstrap test (MBTB) performance, turning this test more conservative in opposition to the effect caused in the MBT.
For k 5populations MBT did not maintain the same performance of the situation of k 2, once it was, in general, more liberal. The liberality increased as increase the number of variates, for samples of different and intermediate sizes in the two populations. MBTB tended to be conservative for smaller samples. For sample sizes (
n
i) atleast equal to 30, the type I error rates were similar to the nominal significance level of 5%, except for p 10.
The type I error rates of the two tests for
k
10
populations showed that there were improvements as the number of populations
k
increased from 2 to 10 (Table 1). The MBT had the best performance. These results for populations showed the same tendencies already discussed for k 2and k 5. It is convenient to point out that there is no remarkable correlation effect of the type I error rates in the different tests (Table 1). The MBTB was shown conservative for p 10, while MBT controlled the type I error rates.The type I error rates were evaluated also for the nominal significance level of 1% , k 2populations and some representative situations of sample size ni. The 95% confidence interval to the nominal significance level 1% for the type I error rates is [0.004; 0.022]. Usually,, the same tendency was verified in the results when compared to the situation of 5%. The type I error rates of the MBT did not present results significantly different from the nominal level. For large sample sizes n1 n2 60 and number of variates p 10 , the
SILVA, R. B. V. et al. 162
Table 1 Type I error rates for the two tests, under normality, with nominal significance level of 5%, considering different values of the sample sizes ( )ni , number of variates ( )p , coefficient of correlation ( ) and number of
populations (
k
).i
n k
p
MBT MBTB(5,5) 2 2 0.0 0.045 0.000*
(5,5) 2 2 0.1 0.052 0.000*
(5,5) 2 2 0.5 0.052 0.000*
(5,5) 2 2 0.9 0.060 0.002*
(5,20) 2 2 0.5 0.042 0.018*
(5,60) 2 2 0.5 0.068 0.062
(7,20) 2 2 0.5 0.048 0.035
(20,20) 2 2 0.5 0.050 0.037
(30,30) 2 2 0.5 0.038 0.038
(60,60) 2 2 0.5 0.060 0.053
5(0)5 5 2 0.5 0.058 0.012*
10(10)50 5 3 0.5 0.077* 0.062
20(0)20 5 3 0.5 0.073* 0.055
30(0)30 5 5 0.5 0.072* 0.053
20(0)20 5 10 0.5 0.085* 0.002*
30(0)30 5 2 0.5 0.048 0.048
5(0)5 10 2 0.5 0.043 0.015*
10(10)100 10 3 0.5 0.045 0.037
20(0)20 10 5 0.5 0.058 0.040
30(0)30 10 10 0.5 0.058 0.027*
60(0)60 10 10 0.5 0.057 0.045
* Significantly (P<0.05) different from the nominal level of 5%.
of the k populations. With the increase of the MBT and the MBTB became, in almost all cases, conservative. Type I error rates for non-normal distributions (uniform and gamma)
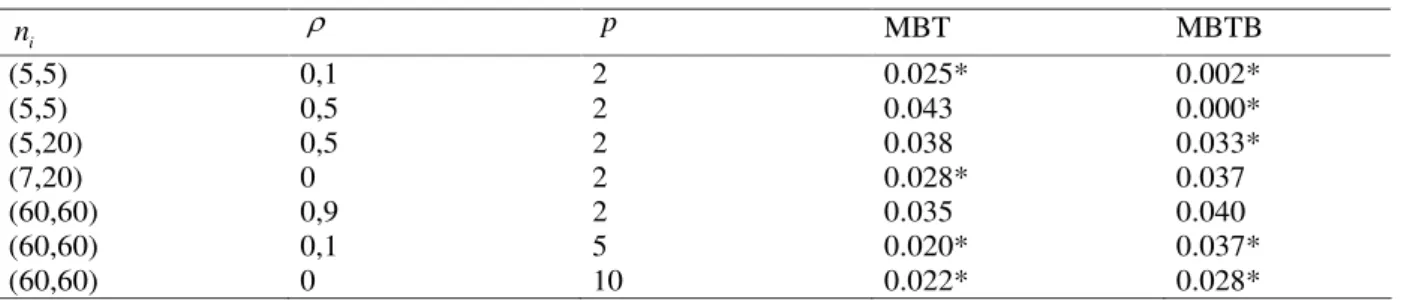
Type I error rates for the two tests are presented in Table 2, considering some specific cases of sample sizes, p and p for a settled number of populations (k 2) and for the uniform distribution. The MBT and the MBTB became more conservative than these same tests in the normal case. The MBTB was conservative for small samples and tended to present error rates not significantly different from the nominal significance level 5%, for large samples, except for p 5.
For larger number of variates, the asymptotic test (MBT) tended to become conservative, with type I error rates significantly p 0, 05 smaller to the nominal significance level. In the bootstrap version (results not presented), the simulated error rates were almost always no significantly different from the nominal level of 5%. Generally, the type I error rates were controlled, since the
observed values always were equal or smaller than the nominal significance level.
Type I error rates for MBT and MBTB are presented in Table 3, considering simulations accomplished from gamma distribution with shape parameter 1.5 and k 2 populations. It can be noticed that the asymptotic MBT was liberal for all the sample sizes simulated. As larger the sample sizes most liberal were the test. That shows that this test is not robust to the normality violation and that seemingly it is more affected for skewness deviations. These results are similar to those of Zhang & Boos (1992). A surprising result was the increasing of the test liberality with the increase of the sample sizes, since it is expected the opposite.
Robustness of asymptotic and bootstrap tests for multivariate... 163 Table 2 Type I error rates for the two tests, under uniform distribution, with nominal significance level of 5%, considering different values of the sample sizes ( )ni , number of variates ( )p , coefficient of correlation ( ) and for a
settled number of populations to
k
2
.i
n p MBT MBTB
(5,5) 0,1 2 0.025* 0.002*
(5,5) 0,5 2 0.043 0.000*
(5,20) 0,5 2 0.038 0.033*
(7,20) 0 2 0.028* 0.037
(60,60) 0,9 2 0.035 0.040
(60,60) 0,1 5 0.020* 0.037*
(60,60) 0 10 0.022* 0.028*
* Significantly (P<0.05) different from the nominal level of 5%.
Table 3 Type I error rates for the two tests, under gamma distribution, with nominal significance level of 5%, considering different values of the sample sizes ( )ni , number of variates ( )p , coefficient of correlation ( ) and for a settled number of populations to
k
2
.i
n p MBT MBTB
(5,5) 2 0.112* 0.002*
(5,20) 2 0.143* 0.020*
(7,20) 2 0.185* 0.027*
(60,60) 2 0.263* 0.033*
(60,60) 5 0.325* 0.047
(60,60) 10 0.402* 0.018*
* Significantly (P<0.05) different from the nominal level of 5%.
The analysis of the results for the type I error rates of the tests for 5% and k 5populations, considering the p-multidimensional gamma distribution and different sample sizes showed that there was the same response pattern of the situation of k 2populations. The difference is an accentuation of the liberality of the asymptotic test (MBT). The MBTB was always conservative or of exact size 5% (results not presented).
For
k
10
populations the same response pattern for and was observed, except for an accentuation of the liberality of the MBT. Usually, it can be seen that the asymptotic test (MBT) is not robust considering the type I error rates for gamma distributions (MOOD et al., 1974). The bootstrap test (MBTB) controlled the type I error rates by keeping the empiric rates equal or smaller to the nominal significance level of 5%. Thus, the MBTB can be considered a robust test in the control of the type I error rates.Power of the tests under normality
SILVA, R. B. V. et al. 164
Table 4 Power for the two tests, under normality, with nominal significance level of 5%, considering different values of the sample sizes ( )ni and for a settled number of populations to
k
2
, number of variates top
2
, coefficientof correlation to
0.5
and degree of heterogeneity of covariance matrices to2
.i
n MBT MBTB
(5,5) 2 0.053 0.000
(5,60) 2 0.070 0.053
(30,30) 2 0.187 0.143
(15,40) 2 0.087 0.070
(40,15) 2 0.120 0.093
(15,60) 2 0.107 0.097
(60,15) 2 0.143 0.127
(60,60) 2 0.303 0.295
An important aspect is how to associate the sample sizes with the populations, when the sample sizes are different. It can always associate the smallest sample size with the population of smaller generalized variance, the second smallest sample size with the population of second smaller generalized variance and so on. The generalized variance can be expressed by the determinant of the sample covariance matrix, which reduces to the sample variance for the case of a single variate
(
p
1)
. This determinant is called sample generalized variance.The association between the samples sizes and the populations also can be made to verify the effect in the power of the tests. For the type I error rate, any mention to that fact was made because the populational covariances were the same. This effect is important to be evaluated, mainly when the researcher intends to accomplish unbalanced experiments. In real situation, it is impossible for the researcher to do any type of association like that, because the covariance matrices ( i) are not known. However, it is important to study this effect, mainly for evaluating if there are interactions between heterogeneity and sample sizes associations of the populations.
Cases considering
2
and changes in the sample sizes from (n1 15, n2 60) to (n1 60, n2 15)and from (n1 15, n2 40) to (n1 40, n2 15) were
evaluated. The response pattern was basically the same, i.e., the relative performance of the tests was the same independently of the association between sample sizes and the values of the populational generalized variances. The MBT was slightly superior to the MBTB.
Considering
4
, k 2, 5%and p 2 under multivariate normality, the same response pattern was observed for the power of the two tests. Theassociations of the smaller samples with the populations of smaller generalized variances resulted in a lower power of the tests than the cases that the largest samples were associated to the populations of smaller generalized variances.
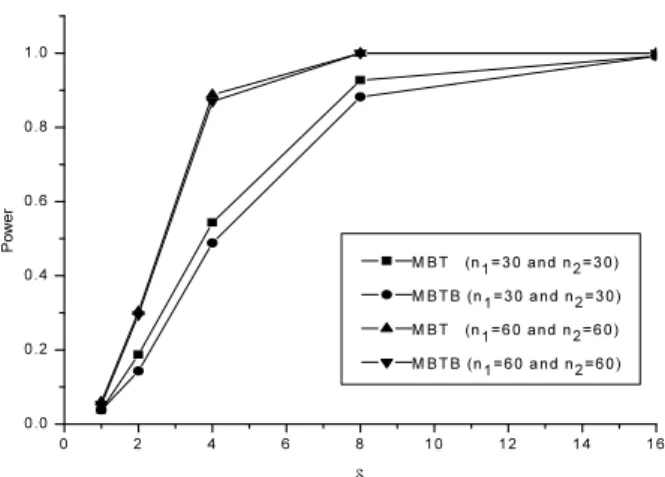
Figura 1 Power of the two tests, under normality, with 5% nominal significance level, considering sample sizes
1 2 30
n n and n1 n2 60 in function of the
differences between generalized variances of the two covariance matrices.
Robustness of asymptotic and bootstrap tests for multivariate... 165 power of the tests. Generally, the magnitude of that
reduction is small and less than the effect of the increase in the number of variates. It is also convenient to point out that this effect is pronounced for samples of intermediate sizes (5 ni 20). A great differentiation among tests was observed with large ( 16)and small sample sizes. Power of the tests under non-normality
The power of the tests was evaluated under atypical conditions and for that two distributions (uniform and gamma) were considered. The results allowed detecting that the bootstrap test had best performance compared to the counterpart asymptotic tests in larger samples. In this case, the MBTB presented power of 40% under uniform distribution ( 2)and 29.5% under normal distribution. The MBT in small samples performed better than MBTB and in intermediate sample sizes, it performed worst. There was little differentiation of the tests in the case of large differences among the populational generalized variances ( 8).
The results under uniform distribution considering 10
k populations, =2and 8, p 2variates and different sample sizes allowed conclude that there was a sensitive power reduction of MBT. The MBTB suffered a
small reduction in the power, when the number of populations changes from k 2 to k 10.
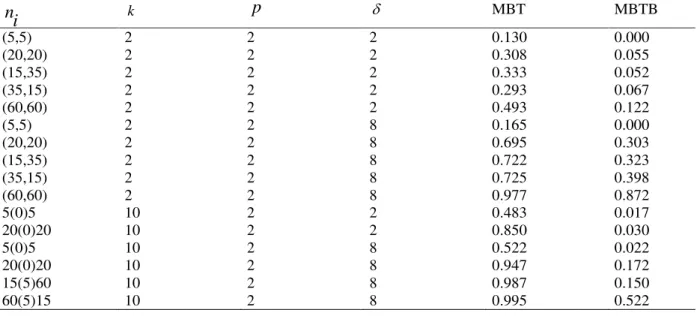
The asymptotic test had larger power, as already expected, considering the gamma distribution in the case of (Table 5). This larger power is not real, because the size of the test is larger than the nominal significance level under the null hypothesis.
The power of the MBTB was small for 2and small sample sizes. For larger samples (n1 n2 60), the
power was 12.2% in gamma and 29.5% in normal distributions, respectively. There was reduction of the power from normal to gamma distributions, but it was the opposed that occurred in the uniform distribution.
When the difference among the covariance matrices is large ( 2), the response pattern observed for 2is maintained, but occurring only an expected increase in the power. As type I error rates of the asymptotic test tend to increase with the increase of the sample size. Then, the asymptotic test, which theoretically should be recommended for larger samples, cannot be done in gamma distributions. The results of power, observed for
10
k showed that the differences between the asymptotic and bootstrap tests amplified, mainly considering 2. However the general comparative response pattern of the tests is the same related for the k 2populations case.
Tabela 5 Power for the two tests, under gamma distribution, with nominal significance level of 5%, considering different values of the sample sizes
( )
n
i , number of populations( )
k
, number of variates( )
p
and degree of heterogeneity of covariance matrices to( )
and for a settled coefficient of correlation to0.5
.n
i
kp
MBT MBTB
(5,5) 2 2 2 0.130 0.000
(20,20) 2 2 2 0.308 0.055
(15,35) 2 2 2 0.333 0.052
(35,15) 2 2 2 0.293 0.067
(60,60) 2 2 2 0.493 0.122
(5,5) 2 2 8 0.165 0.000
(20,20) 2 2 8 0.695 0.303
(15,35) 2 2 8 0.722 0.323
(35,15) 2 2 8 0.725 0.398
(60,60) 2 2 8 0.977 0.872
5(0)5 10 2 2 0.483 0.017
20(0)20 10 2 2 0.850 0.030
5(0)5 10 2 8 0.522 0.022
20(0)20 10 2 8 0.947 0.172
15(5)60 10 2 8 0.987 0.150
SILVA, R. B. V. et al. 166
CONCLUSIONS
This Monte Carlo simulations applied in this article allowed that one concluded that the bootstrap multivariate test (MBTB) was considered a superior and robust test when compared to the asymptotic alternative (MBT), because this test controlled the type I error rates.
BIBLIOGRAPHIC REFERENCES
BARTLETT, M. S. A note on the multiplying factors for various 2 approximations. Journal of Royal Statistical Society B, London, v. 16, n. 2, p. 296-298, 1954.
BORGES, L. C.; FERREIRA, D. F. Poder e taxas de erro tipo I dos testes Scott-Knott, Tukey e Student-Newman-Keuls sob distribuições normal e não-normais dos resíduos. 2002. 94 p. Dissertação (Mestrado em Estatística e
Experimentação Agropecuária) Universidade Federal de Lavras, Lavras, 2002.
JOHNSON, R. A.; WICHERN, D. W. Applied multivariate statistical analysis. 4. ed. New York: Prentice Hall, 1998. 816 p.
MOOD, A. M.; GRAYBILL, F. A.; BOES, D. C. Introduction to theory of statistics. 3. ed. New York: Wiley & Sons, 1974. 842 p.