Submitted15 May 2016 Accepted 25 July 2016 Published24 August 2016
Corresponding author Isabelle Laforest-Lapointe,
Academic editor Anthony Amend
Additional Information and Declarations can be found on page 13
DOI10.7717/peerj.2367
Copyright
2016 Laforest-Lapointe et al.
Distributed under
Creative Commons CC-BY 4.0
OPEN ACCESS
Tree phyllosphere bacterial communities:
exploring the magnitude of intra- and
inter-individual variation among host
species
Isabelle Laforest-Lapointe1,2, Christian Messier1,2,3and Steven W. Kembel1,2 1Centre d’étude de la forêt, Montreal, Canada
2Sciences Biologiques, Université du Québec à Montréal, Montreal, Quebec, Canada
3ISFORT - Institut des Sciences de la Forêt Tempérée, Université du Québec en Outaouais, Ripon, Quebec,
Canada
ABSTRACT
Background. The diversity and composition of the microbial community of tree leaves (the phyllosphere) varies among trees and host species and along spatial, temporal, and environmental gradients. Phyllosphere community variation within the canopy of an individual tree exists but the importance of this variation relative to among-tree and among-species variation is poorly understood. Sampling techniques employed for phyllosphere studies include picking leaves from one canopy location to mixing randomly selected leaves from throughout the canopy. In this context, our goal was to characterize the relative importance of intra-individual variation in phyllosphere communities across multiple species, and compare this variation to inter-individual and interspecific variation of phyllosphere epiphytic bacterial communities in a natural temperate forest in Quebec, Canada.
Methods. We targeted five dominant temperate forest tree species including an-giosperms and gymnosperms: Acer saccharum,Acer rubrum,Betula papyrifera,Abies balsameaandPicea glauca. For one randomly selected tree of each species, we sampled microbial communities at six distinct canopy locations: bottom-canopy (1–2 m height), the four cardinal points of mid-canopy (2–4 m height), and the top-canopy (4–6 m height). We also collected bottom-canopy leaves from five additional trees from each species.
Results. Based on an analysis of bacterial community structure measured via Illumina sequencing of the bacterial 16S gene, we demonstrate that 65% of the intra-individual variation in leaf bacterial community structure could be attributed to the effect of inter-individual and inter-specific differences while the effect of canopy location was not significant. In comparison, host species identity explains 47% of inter-individual and inter-specific variation in leaf bacterial community structure followed by individual identity (32%) and canopy location (6%).
SubjectsEcology, Genomics, Microbiology, Plant Science
Keywords Phyllosphere, Plant-bacteria interaction, Microbiome, Temperate forest, Intra-individual variation, Interspecific variation, Inter-Intra-individual variation, Bioindicator
INTRODUCTION
The phyllosphere microbiota represents the communities of microorganisms including bacteria, archaea, and eukaryotes such as fungi that are associated with plant leaves (Inácio et al., 2002;Lindow & Brandl, 2003). Phyllosphere microbes influence host fitness through a variety of mechanisms such as plant hormone production and protection from pathogen colonization (Innerebner, Knief & Vorholt, 2011;Ritpitakphong et al., 2016). As a result of their effect on host plant fitness, leaf microorganisms can influence plant population dynamics and community diversity (Clay & Holah, 1999;Bradley, Gilbert & Martiny, 2008) as well as ecosystem functions including water (Rodriguez et al., 2009) and nutrient cycling (Van Der Heijden, Bardgett & Van Straalen, 2008;McGuire & Treseder, 2010;Allison & Treseder, 2011). Tree microbial phyllosphere communities have been studied in tropical (Lambais et al., 2006;Lambais, Lucheta & Crowley, 2014;Kim et al., 2012;Kembel et al., 2014;Kembel & Mueller, 2014), temperate (Jumpponen & Jones, 2009;
Redford & Fierer, 2009;Redford et al., 2010;Jackson & Denney, 2011) and Mediterranean forests (Penuelas et al., 2012), along altitudinal gradients (Cordier et al., 2012a;Cordier et al., 2012b), and in deserts (Finkel et al., 2011;Finkel et al., 2012). In order to understand the structure and function of phyllosphere microbial communities, studies typically either assume that a single sample of leaves from a plant canopy is representative of the phyllosphere community of the entire tree or host species (Lambais et al., 2006;
Kim et al., 2012;Kembel et al., 2014), or control for spatial structure in phyllosphere community structure by mixing leaves from multiple canopy locations (Redford & Fierer, 2009;Redford et al., 2010;Jumpponen & Jones, 2009;Jumpponen & Jones, 2010;Finkel et al., 2011;Finkel et al., 2012;Cordier et al., 2012a;Cordier et al., 2012b). In this study our aim was to quantify the relative importance of intra-individual versus inter-individual and inter-specific variation in the structure of temperate tree phyllosphere communities across multiple host species.
Host genetic factors (Bodenhausen et al., 2014;Horton et al., 2014) and taxonomic identity (Redford et al., 2010;Kembel et al., 2014) are important drivers of phyllosphere bacterial community structure. Most studies of phyllosphere communities across different host species have assumed within-plant and within-species variation in phyllosphere community structure to be negligible, and looked passed intra-individual and inter-individual variation (but seeRedford et al. (2010)andLeff et al. (2015)). In tree phyllosphere studies, samples are usually taken from shade leaves either at the bottom of the canopy or at mid-canopy height near the trunk. However, the technique to sample phyllosphere communities vary between studies, ranging from studies that sampled leaves from a specific canopy location (i.e.,Kembel et al., 2014;Kembel & Mueller, 2014) to taking multiple leaves from around the canopy at the same height (i.e.,Redford & Fierer, 2009;Redford et al., 2010;
(Ginkgo biloba) that there is intra-individual variation in phyllosphere community structure within the canopy of a single tree. The relative importance of this within-individual variation versus inter-individual and inter-specific variation, and the degree to which a sample of leaves from a canopy are representative of the microbiome of an individual or a species, is not well understood.
A multitude of factors could influence microbial community structure on leaves within a tree canopy. Leaf position in the canopy defines the degree of exposure to ultraviolet radiation and wind and therefore community structure could change depending on the position of the leaves sampled. Exposure to ultraviolet radiation has been shown to increase the diversity of the maize leaf microbial community (Kadivar & Stapleton, 2003) and anoxygenic phototropic bacteria have been detected in the phyllosphere of Tamarix nilotica(Atamna-Ismaeel et al., 2012). This phenomenon could also be caused by leaf morphological and ecophysiological attributes associated with high light availability (thicker leaves, lower specific leaf area, lower water content, higher total chlorophyll, higher photosynthetic activity rate;Lichtenthaler et al., 1981). Variation in atmosphere conditions within the canopy (i.e., increased exposure to wind and gas exchange levels) modifies local leaf humidity conditions potentially influencing leaf epiphytic bacterial communities by inhibiting or favoring the growth of particular groups (Medina-Martínez et al., 2015). Wind exposure could reduce leaf moisture and induce a stomata closure (Grace, Malcolm & Bradbury, 1975), which could impact the diffusion of nutrients and reduce the size of microbial aggregates (Leveau & Lindow, 2001;Miller et al., 2001).
In this study, we aim to (1) compare the intra-individual, inter-individual and interspecific variation of phyllosphere bacterial communities; (2) characterize the composition of epiphytic phyllosphere bacterial communities at different canopy locations for five tree species; and (3) make practical recommendations for the sampling of tree phyllosphere bacterial communities. We hypothesized that (1) the magnitude of intra-individual variation will be smaller than inter-intra-individual and interspecific variation, (2) that canopy location will be a significant driver of phyllosphere bacterial community structure because of variation in abiotic conditions (e.g., radiation, wind), and changes in ecophysiological and morphological leaf characteristics.
MATERIALS AND METHODS
Study site & host-tree species
The two study sites are located in a natural temperate forest stand in Gatineau (45◦44′50′′N; 75◦17′57′′W) and Sutton (45◦6′46′′N; 72◦32′28′′W) Quebec, Canada. These sites are
Bacterial community collection
We sampled phyllosphere communities from trees on August 29, 2013 as part of another experiment (Laforest-Lapointe, Messier & Kembel, 2016). Sampling was carried out one week after the last rainfall event. We defined three strata within the canopy: bottom-canopy (1–2 m height), mid-bottom-canopy (2–4 m height), and top-bottom-canopy (4–6 m height). 30 individuals were randomly selected by picking random geographic coordinates and finding the closest individual at this location. For the first tree sampled from each species, we clipped 50–100 g of leaves at the four cardinal points at mid-canopy height, plus a single sample at bottom-canopy and top-canopy heights, into sterile roll bags with surface-sterilized shears. We also sampled bottom-canopy leaves from two other randomly chosen trees from each species. For bacterial community collection and amplification we used the protocols described byKembel et al. (2014). We collected microbial communities from the leaf surface by five minutes of horizontal mechanical agitation of the samples in a diluted Redford buffer solution. We resuspended cells in 500µL of PowerSoil bead solution (MoBio, Carlsbad,
California). We extracted DNA from isolated cells using the PowerSoil kit according to the manufacturer’s instructions and stored at−80◦C.
DNA library preparation and sequencing
We used a two-step PCR approach to prepare amplicon libraries for the high-throughput Illumina sequencing platform. The use of combinatorial primers for paired-end Illumina sequencing of amplicons reduced the number of primers while maintaining the diversity of unique identifiers (Gloor et al., 2010). First, we amplified the V5–V6 region of the bacterial 16S rRNA gene using chloroplast-excluding primers in order to eliminate contamination by host plant DNA (16S primers 799F-1115R (Redford et al., 2010;Chelius & Triplett, 2001)) following protocols described byKembel et al. (2014). We cleaned the resulting product using a MoBio UltraClean PCR cleanup kit. We isolated a∼445-bp fragment by electrophoresis in a 2% agarose gel, and recovered DNA with the MoBio GelSpin kit. We prepared multiplexed 16S libraries by mixing equimolar concentrations of DNA, and sequenced the DNA library using Illumina MiSeq 250-bp paired-end sequencing at Genome Quebec.
We processed the raw sequence data with PEAR (Zhang et al., 2014) and QIIME (Caporaso et al., 2010) software to merge paired-end sequences to a single sequence of length of 350 bp, eliminate low quality sequences (mean quality score<30 or with any series of 5 bases with
a quality score<30), and de-multiplex sequences into samples. We eliminated chimeric
Statistical analyses
We created a database excluding OTUs represented fewer than 3 times to minimize the presence of spurious OTUs caused by PCR and sequencing errors (Acinas et al., 2005). We identified the OTUs that were present on all samples to define the ‘‘core microbiome’’ (Shade & Handelsman, 2012). Then we tested for significant associations between bacterial taxa and host species, and canopy location using the Linear Discriminant Analysis Effect Size (LEfSe) algorithm (Segata et al., 2011). This analysis allows the recognition of significant individual host-microbe associations and evaluates the strength of associations between organisms from different groups (Segata et al., 2011).
We performed analyses with the ape (Paradis et al., 2004), picante (Kembel et al., 2010), and vegan (Oksanen et al., 2007) packages in R (R Development Core Team, 2013) and ggplot2 (Wickham, 2009) for data visualization. We quantified the taxonomic variation in bacterial community structure among samples with the Bray–Curtis dissimilarity. To illustrate patterns of bacterial community structure, we performed a nonmetric multidimensional scaling (NMDS) ordination of Bray–Curtis dissimilarity. We identified relationships between bacterial community structure, host species identity, and sample canopy location by conducting a permutational multivariate analysis of variance (PERMANOVA,Anderson, 2001) on the community matrix. We employed a blocking randomization to account for the non-independence of observations among sites. To decompose the total variation in the community matrix explained by host species identity and canopy location, we performed a partial redundancy analysis (RDA; Legendre & Legendre, 1998). This technique measures the amount of variation that can be attributed exclusively to each set of explanatory variables. We performed three permutational tests of multivariate homogeneity of group dispersions (Levene’s test for variances’ homogeneity multivariate equivalent;Anderson, 2006;Anderson, Ellingsen & McArdle, 2006): one to test if variance in intra-individual canopy bacterial communities was equal between individuals (30 samples from five trees sampled at six canopy locations); a second to compare interspecific variation between species (30 bottom-canopy samples from 30 different trees); and finally a third to test per-species intra- and inter-individual variation (all 55 samples). We estimated phyllosphere bacterial alpha-diversity using the Shannon index calculated from OTU relative abundances for each community. We performed an analysis of variance (ANOVA) and subsequent post-hoc Tukey’s tests to compare differences in diversity across species. The authors declare that the experiment comply with the current laws of the country in which the experiment was performed.
RESULTS
Sequences, OTUs and taxonomy
0 25 50 75 100
ABBA ACRU ACSA BEPA PIGL
PR
OPOR
TION OF T
O
T
AL COMMUNITY (%)
BACTERIAL CLASS
Alphaproteobacteria Cytophagia
Betaproteobacteria Actinobacteria Acidobacteriia Gammaproteobacteria Deltaproteobacteria Other
[Saprospirae] Sphingobacteriia Deinococci TM7−3 Chloroflexi Thermoleophilia Armatimonadia Flavobacteriia ABS−6 DA052
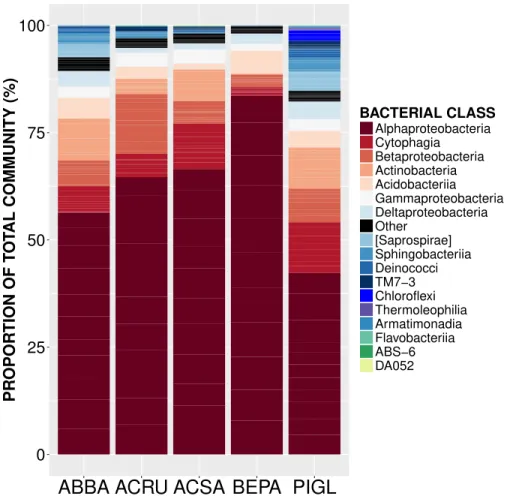
Figure 1 Relative abundance of sequences from bacterial taxonomic classes in the phyllosphere microbiome of temperate tree species in Quebec temperate forest.ABBA,Abies balsamea; ACRU,Acer rubrum; ACSA,Acer saccharum; BEPA,Betula papyrifera; PIGL,Picea glauca.
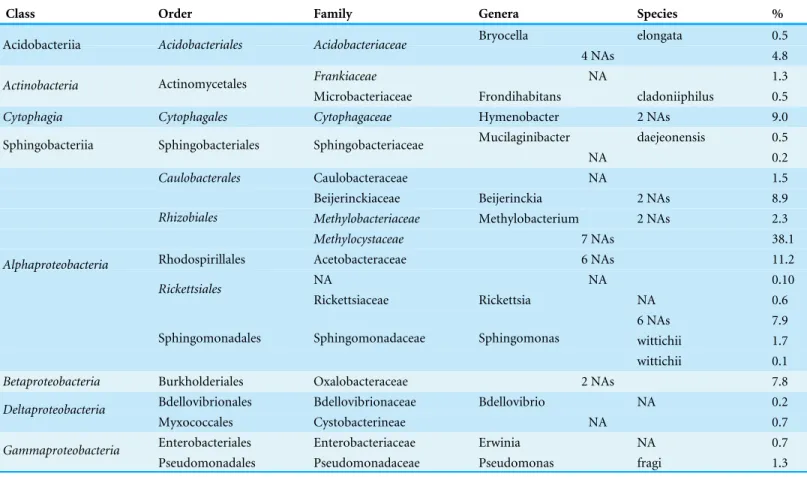
occurring on all trees. The OTUs present on all samples represent the ‘‘core microbiome’’: the microbial taxa shared among multiple communities sampled from the same habitat (Shade & Handelsman, 2012). In this study, the core microbiome consisted of 42 OTUs (Table 1) representing 61% of all sequences, of which 72% wereAlphaproteobacteria, 9% Cytophagia, 7.8%Betaproteobacteria, 5%Acidobacteria, 2%Gammaproteobacteriaand 2%Actinobacteria. The most abundant order wasRhizobiales(49%) from which 77% of sequences were assigned to the familyMethylocystaceae. While there was some variation in the most abundant classes both across the five tree species and among canopy locations (Figs. 1and2), the classAlphaproteobacteriawas always the dominant taxon, with relative abundances ranging from 42% onP. glaucato 84% onB. papyrifera(Fig. 1).
Intra-individual vs. inter-individual and interspecific variation
Table 1 Taxonomy and relative abundance of the 42 OTUs constituting the tree phyllosphere bacterial core microbiome in Quebec temperate forest (present in all 55 samples).
Class Order Family Genera Species %
Bryocella elongata 0.5
Acidobacteriia Acidobacteriales Acidobacteriaceae
4 NAs 4.8
Frankiaceae NA 1.3
Actinobacteria Actinomycetales
Microbacteriaceae Frondihabitans cladoniiphilus 0.5
Cytophagia Cytophagales Cytophagaceae Hymenobacter 2 NAs 9.0 Mucilaginibacter daejeonensis 0.5 Sphingobacteriia Sphingobacteriales Sphingobacteriaceae
NA 0.2
Caulobacterales Caulobacteraceae NA 1.5
Beijerinckiaceae Beijerinckia 2 NAs 8.9
Methylobacteriaceae Methylobacterium 2 NAs 2.3
Rhizobiales
Methylocystaceae 7 NAs 38.1
Rhodospirillales Acetobacteraceae 6 NAs 11.2
NA NA 0.10
Rickettsiales
Rickettsiaceae Rickettsia NA 0.6
6 NAs 7.9
wittichii 1.7
Alphaproteobacteria
Sphingomonadales Sphingomonadaceae Sphingomonas
wittichii 0.1
Betaproteobacteria Burkholderiales Oxalobacteraceae 2 NAs 7.8 Bdellovibrionales Bdellovibrionaceae Bdellovibrio NA 0.2
Deltaproteobacteria
Myxococcales Cystobacterineae NA 0.7
Enterobacteriales Enterobacteriaceae Erwinia NA 0.7
Gammaproteobacteria
Pseudomonadales Pseudomonadaceae Pseudomonas fragi 1.3
Table 2 Variation in phyllosphere bacterial community structure explained by various drivers: host species identity, sample location within the tree canopy and individual identity.PERMANOVA on Bray–Curtis dissimilarities.
Dataset Scope Nb samples Nb ind./species VariablesR2(%)
Canopy location
Host species identity
Individual identity
#1 Intra-individual 30 1 8a 65b
#2 Inter-individual and interspecific 30 6 na 47 na
#3 Intra- and inter-individual, and interspecific 60 6 6 47 32c
Notes.
aThe effect of canopy location was not significant after accounting for individual identity. bHost species identity and individual identity are confounded as there were no replicates per species. cIndividual identity was nested in host species identity.
na, Non applicable.
were accounted for, sample canopy location explained 22% of the remaining variation in community structure. In comparison, in the dataset with 30 different individuals, host species identity explained only 47% of variation in phyllosphere bacterial community structure (PERMANOVA on Bray–Curtis dissimilarities;Table 2). When considering intra-individual and inter-individual samples, host species identity (R2=47%) was the
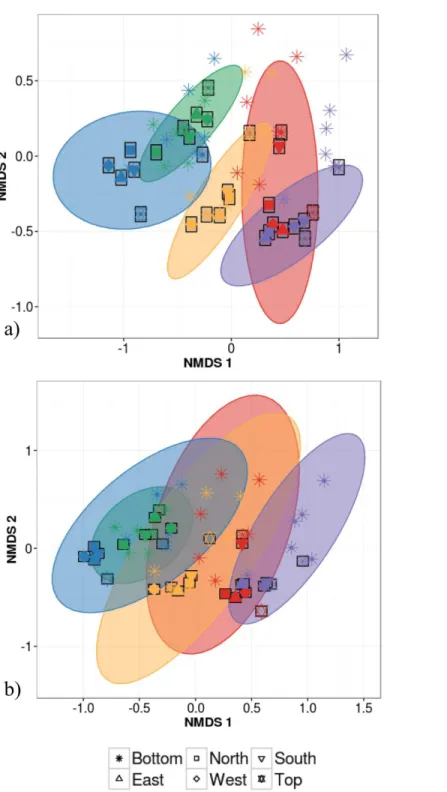
strongest driver of variation in phyllosphere bacterial community structure closely followed by individual identity (R2=32%) and finally by canopy location (R2=6%; PERMANOVA on Bray–Curtis dissimilarities;Table 2). Community composition of samples clustered based both on the individual (Fig. 3A) and species (Fig. 3B) from which they were collected (non-metric multidimensional scaling (NMDS) based on Bray–Curtis distances among samples).
The first permutational multivariate test of variance homogeneity (an analogue of Levene’s test of homogeneity of variances) on intra-individual phyllosphere communities indicated a significant difference betweenP. glaucaandB. papyrifera(Tukey’s post hoc test;P=0.03). The second test of the homogeneity of inter-individual variance between
host species showed that P. glauca’s variance in community structure (mean distance to centroid=0.34) was higher thanA. saccharum(0.25;P<0.01) andA. rubrum(0.26;
P<0.05) while all other comparisons were not significant. Finally, the third test between per
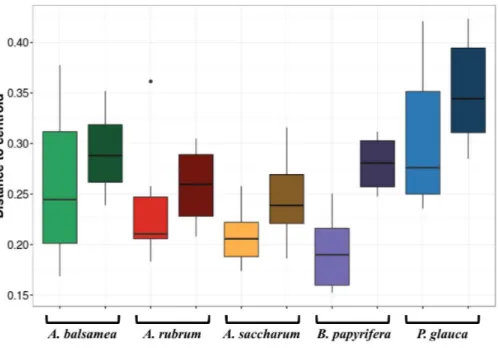
species intra-individual and inter-individual variation indicated one significant difference in variation forB. papyrifera(P=0.005;Fig. 4).
The alpha-diversity of leaf bacterial community differed significantly across host species identity but not across canopy locations. Post-hoc Tukey honestly significant differences tests confirmed that Shannon alpha-diversity is higher on conifer species (4.9±standard error (SE) of 0.04 forA. balsameaand 5.3±SE 0.04 forP. glauca) than on angiosperm species (3.7±SE 0.06 forA. rubrum, 4.1±SE 0.05 forA. saccharumand 3.6±SE 0.09 for B. papyrifera).
Bacterial indicator taxa
Figure 3 Non-metric multidimensional scaling (NMDS) ordination of within-individual variation in bacterial community structure across 55 phyllosphere samples from Quebec temperate forest trees.
Stress amounted to 0.16. Ellipses indicate 1 standard deviation confidence interval around of (A) intra-individual samples and (B) inter-intra-individual samples. Gray boxes indicate the 30 samples that came from individuals sampled at six different canopy locations. The other 25 samples came from 5 more individu-als per host species. Symbols indicate sample position in the tree canopy; colours indicate by host species identity (green:Abies balsamea; red:Acer rubrum; orange:Acer saccharum; purple:Betula papyrifera; blue:
Figure 4 Permutation test for homogeneity of multivariate dispersions in leaf bacterial communities between per species intra- and inter-individual samples.Colours indicate host species identity (green for
Abies balsamea; red forAcer rubrum; orange forAcer saccharum; purple forBetula papyrifera; and blue for
Picea glauca); shading indicate intra- (pale color) and inter-individual (dark color) variance respectively.
DISCUSSION
In this study, we demonstrate for multiple host species that there is a significant amount of intra-individual variation in phyllosphere bacterial community structure (Fig. 3A). While the mean distance to centroid is always smaller for intra- than for inter-individual variation (Fig. 4), this distance was only statistically significant forB. papyrifera. This result therefore provides partial support for our first hypothesis, stating that magnitude of intra-individual variation would be smaller than inter-individual and interspecific variation. When analyzing all samples, we found host species identity to be a stronger determinant of phyllosphere bacterial community structure than individual identity (Table 2). However, this result could be biased by the fact that we sampled a single individual for multiple canopy location. The importance of host species identity as a driver of phyllosphere community structure agrees with past studies of tropical (Kim et al., 2012;Kembel et al., 2014;Lambais, Lucheta & Crowley, 2014) and temperate trees (Redford et al., 2010). Previous studies have quantified intra- and inter-individual variation in phyllosphere bacterial community structure, but these studies mixed leaves from within tree canopies without quantifying intra-individual variation (Redford et al., 2010) or explored intra-individual variation for a single host species (Leff et al., 2015). Our results show that after taking host species identity into account, there exist detectable differences in microbial community structure within tree canopies, at least in natural forest settings.
Table 3 Bacterial taxa identified as bio-indicators of different host species in Quebec temperate forest.The LEfSe analysis was performed on 30 samples: 6 individuals per species. Only the top five bio-indicators are shown.
Host species identity Bacterial taxa Effect size
Actinobacteria.Actinobacteria.Actinomycetales.Frankiaceae 4.34***
Acidobacteria 4.30***
Acidobacteria.Acidobacteriia.Acidobacteriales.Acidobacteriaceae 4.27***
Acidobacteria.Acidobacteriia.Acidobacteriales 4.27***
Abies balsamea
Acidobacteria.Acidobacteriia 4.27***
Proteobacteria.Alphaproteobacteria.Rhizobiales.Methylocystaceae 5.13***
Proteobacteria.Betaproteobacteria 4.79***
Proteobacteria.Betaproteobacteria.Burkholderiales 4.79***
Proteobacteria.Betaproteobacteria.Burkholderiales.Oxalobacteraceae 4.77***
Acer rubrum
Proteobacteria.Alphaproteobacteria.Rickettsiales.Rickettsiaceae 3.81***
Proteobacteria.Alphaproteobacteria.Rhizobiales 5.18***
Bacteroidetes.Cytophagia.Cytophagales.Cytophagaceae.Hymenobacter 4.48***
Proteobacteria.Alphaproteobacteria.Rhizobiales.Beijerinckiaceae 4.47***
Proteobacteria.Alphaproteobacteria.Rhizobiales.Beijerinckiaceae.Beijerinckia 4.47***
Acer saccharum
Actinobacteria.Actinobacteria.Actinomycetales.Microbacteriaceae 4.33***
Proteobacteria.Alphaproteobacteria 5.39***
Proteobacteria 5.28***
Proteobacteria.Alphaproteobacteria.Rhodospirillales 5.26***
Proteobacteria.Alphaproteobacteria.Rhodospirillales.Acetobacteraceae 5.25***
Betula papyrifera
Proteobacteria.Alphaproteobacteria.Rickettsiales 4.13***
Bacteroidetes 4.97***
Bacteroidetes.Cytophagia.Cytophagales 4.74***
Bacteroidetes.Cytophagia 4.74***
Actinobacteria 4.73***
Picea glauca
Bacteroidetes.Cytophagia.Cytophagales.Cytophagaceae 4.73***
Notes. ***P<0.001.
NS,P>0.05.
community structure is not different from the variation observed at the inter-individual level. Future phyllosphere studies characterizing the relative influence of potential key factor such as random colonization via vectors as the atmospheric air flow (Barberán et al., 2015) or animals (Scheffers et al., 2013), competition between bacterial populations (Vorholt, 2012); or intra-individual variation in leaf functional traits (Hunter et al., 2010;
Reisberg et al., 2012) are needed to understand the dynamics driving intra-individual variability in bacterial community structure.
In conclusion, our results demonstrate that there exists considerable intra-individual variation in phyllosphere community structure, and that the magnitude of this variation is smaller but not statistically different from the magnitude of inter-individual variation. When designing a study of tree phyllosphere bacterial communities, if quantifying interspecific variation is the goal then samples from a consistent location within the tree canopy for individual trees are sufficient to quantify the majority of the variation in community structure. However, future studies and especially studies focusing on a single host species should acknowledge that there can be significant intra-individual variation in phyllosphere community structure, and sampling plans should explicitly select leaves at different positions within the canopy to describe spatial structure of the overall community composition for individual trees.
ACKNOWLEDGEMENTS
We thank Travis Dawson, Sophie Carpentier and Gabriel Jacques for support in the field and laboratory.
ADDITIONAL INFORMATION AND DECLARATIONS
Funding
Financial support was provided by the Natural Sciences and Engineering Research Council of Canada (NSERC), the Fonds de Recherche du Québec - Nature et Technologies (FRQNT), and by the Canada Research Chairs Program. The funders had no role in study design, data collection and analysis, decision to publish, or preparation of the manuscript.
Grant Disclosures
The following grant information was disclosed by the authors:
Natural Sciences and Engineering Research Council of Canada (NSERC). Fonds de Recherche du Québec - Nature et Technologies (FRQNT). Canada Research Chairs Program.
Competing Interests
Author Contributions
• Isabelle Laforest-Lapointe conceived and designed the experiments, performed the experiments, analyzed the data, wrote the paper, prepared figures and/or tables, reviewed drafts of the paper.
• Christian Messier conceived and designed the experiments, reviewed drafts of the paper. • Steven W. Kembel conceived and designed the experiments, analyzed the data,
contributed reagents/materials/analysis tools, wrote the paper, reviewed drafts of the paper.
Data Availability
The following information was supplied regarding data availability: laforest-lapointe, isabelle (2016): Code for INTRA_MS_peerJ. figshare. https://dx.doi.org/10.6084/m9.figshare.3370021.v1
laforest-lapointe, isabelle (2016): OTUs_biom_in_csv_intraindividual. figshare. https://dx.doi.org/10.6084/m9.figshare.3178837.v1
laforest-lapointe, isabelle (2016): Barcodes. figshare. https://dx.doi.org/10.6084/m9.figshare.2062521.v2
laforest-lapointe, isabelle (2016): Metadata_intraindividual. figshare. https://dx.doi.org/10.6084/m9.figshare.3178795.v1
laforest-lapointe, isabelle (2016): Sequences. figshare. https://dx.doi.org/10.6084/m9.figshare.2062512.v1.
REFERENCES
Acinas SG, Sarma-Rupavtarm R, Klepac-Ceraj V, Polz MF. 2005.PCR-induced sequence artifacts and bias: insights from comparison of two 16S rRNA clone libraries constructed from the same sample.Applied and Environmental Microbiology 71(12):8966–8969DOI 10.1128/AEM.71.12.8966-8969.2005.
Allison SD, Treseder KK. 2011.Climate change feedbacks to microbial decomposition in boreal soils.Fungal Ecology 4(6):362–374DOI 10.1016/j.funeco.2011.01.003.
Anderson MJ. 2001.A new method for non-parametric multivariate analysis of variance. Austral Ecology26(1):32–46.
Anderson MJ. 2006.Distance-based tests for homogeneity of multivariate dispersions. Biometrics62(1):245–253DOI 10.1111/j.1541-0420.2005.00440.x.
Anderson MJ, Ellingsen KE, McArdle BH. 2006.Multivariate dispersion as a measure of beta diversity.Ecology Letters9(6):683–693DOI 10.1111/j.1461-0248.2006.00926.x. Atamna-Ismaeel N, Finkel O, Glaser F, Von Mering C, Vorholt JA, Koblížek M, Belkin
S, Béjà O. 2012.Bacterial anoxygenic photosynthesis on plant leaf surfaces. Environ-mental Microbiology Reports4(2):209–216DOI 10.1111/j.1758-2229.2011.00323.x. Barberán A, Ladau J, Leff JW, Pollard KS, Menninger HL, Dunn RR, Fierer N. 2015.
Bodenhausen N, Bortfeld-Miller M, Ackermann M, Vorholt JA. 2014.A synthetic community approach reveals plant genotypes affecting the phyllosphere microbiota. PLoS Genetics10(4):e1004283DOI 10.1371/journal.pgen.1004283.
Bradley DJ, Gilbert GS, Martiny JB. 2008.Pathogens promote plant diversity through a compensatory response.Ecology Letters11(5):461–469
DOI 10.1111/j.1461-0248.2008.01162.x.
Burns RM, Honkala BH. 1990. Silvics of North America. In:Conifers. Agriculture handbook654, vol. 1. Washington, D.C.: US Department of Agriculture.
Caporaso JG, Kuczynski J, Stombaugh J, Bittinger K, Bushman FD, Costello EK, Fierer N, Pena AG, Goodrich JK, Gordon JI, Huttley GA. 2010.QIIME allows analysis of high-throughput community sequencing data.Nature Methods7(5):335–336 DOI 10.1038/nmeth.f.303.
Chelius MK, Triplett EW. 2001.The diversity of archaea and bacteria in association with the roots of Zea mays L.Microbial Ecology41(3):252–263
DOI 10.1007/s002480000087.
Claesson MJ, Wang Q, O’Sullivan O, Greene-Diniz R, Cole JR, Ross RP, O’Toole PW. 2010.Comparison of two next-generation sequencing technologies for resolving highly complex microbiota composition using tandem variable 16S rRNA gene regions.Nucleic Acids Research38(22):e200–e200DOI 10.1093/nar/gkq873. Clay K, Holah J. 1999.Fungal endophyte symbiosis and plant diversity in successional
fields.Science285(5434):1742–1744DOI 10.1126/science.285.5434.1742. Cordier T, Robin C, Capdevielle X, Desprez-Loustau ML, Vacher C. 2012a.Spatial
variability of phyllosphere fungal assemblages: genetic distance predominates over geographic distance in a European beech stand (Fagus sylvatica).Fungal Ecology 5(5):509–520DOI 10.1016/j.funeco.2011.12.004.
Cordier T, Robin C, Capdevielle X, Fabreguettes O, Desprez-Loustau ML, Vacher C. 2012b.The composition of phyllosphere fungal assemblages of European beech (Fagus sylvatica) varies significantly along an elevation gradient.New Phytologist 196(2):510–519DOI 10.1111/j.1469-8137.2012.04284.x.
Edgar RC. 2010.Search and clustering orders of magnitude faster than BLAST. Bioinfor-matics26(19):2460–2461DOI 10.1093/bioinformatics/btq461.
Finkel OM, Burch AY, Elad T, Huse SM, Lindow SE, Post AF, Belkin S. 2012. Distance-decay relationships partially determine diversity patterns of phyllosphere bacteria on Tamrix trees across the Sonoran Desert.Applied and Environmental Microbiology 78(17):6187–6193DOI 10.1128/AEM.00888-12.
Finkel OM, Burch AY, Lindow SE, Post AF, Belkin S. 2011.Geographical location de-termines the population structure in phyllosphere microbial communities of a salt-excreting desert tree.Applied and Environmental Microbiology77(21):7647–7655 DOI 10.1128/AEM.05565-11.
Grace J, Malcolm DC, Bradbury IK. 1975.The effect of wind and humidity on leaf diffusive resistance in Sitka spruce seedlings.Journal of Applied Ecology1:931–940. Horton MW, Bodenhausen N, Beilsmith K, Meng D, Muegge BD, Subramanian S,
Vetter MM, Vilhjálmsson BJ, Nordborg M, Gordon JI, Bergelson J. 2014. Genome-wide association study of Arabidopsis thaliana leaf microbial community.Nature Communications5.
Hunter PJ, Hand P, Pink D, Whipps JM, Bending GD. 2010.Both leaf properties and microbe–microbe interactions influence within-species variation in bacterial popula-tion diversity and structure in the lettuce (Lactuca species) phyllosphere.Applied and Environmental Microbiology76(24):8117–8125DOI 10.1128/AEM.01321-10.
Inácio J, Pereira P, Carvalho DM, Fonseca A, Amaral-Collaco MT, Spencer-Martins I. 2002.Estimation and diversity of phylloplane mycobiota on selected plants in a mediterranean–type ecosystem in Portugal.Microbial Ecology44(4):344–353 DOI 10.1007/s00248-002-2022-z.
Innerebner G, Knief C, Vorholt JA. 2011.Protection of Arabidopsis thaliana against leaf-pathogenic Pseudomonas syringae by Sphingomonas strains in a controlled model system.Applied and Environmental Microbiology77(10):3202–3210 DOI 10.1128/AEM.00133-11.
Jackson CR, Denney WC. 2011.Annual and seasonal variation in the phyllosphere bacterial community associated with leaves of the southern magnolia (Magnolia grandiflora).Microbial Ecology61(1):113–122DOI 10.1007/s00248-010-9742-2. Jumpponen A, Jones KL. 2009.Massively parallel 454 sequencing indicates hyperdiverse
fungal communities in temperate Quercus macrocarpa phyllosphere.New Phytologist 184(2):438–448DOI 10.1111/j.1469-8137.2009.02990.x.
Jumpponen A, Jones KL. 2010.Seasonally dynamic fungal communities in the Quercus macrocarpa phyllosphere differ between urban and nonurban environments.New Phytologist 186(2):496–513DOI 10.1111/j.1469-8137.2010.03197.x.
Kadivar H, Stapleton AE. 2003.Ultraviolet radiation alters maize phyllosphere bacterial diversity.Microbial Ecology45(4):353–361DOI 10.1007/s00248-002-1065-5.
Kembel SW, Cowan PD, Helmus MR, Cornwell WK, Morlon H, Ackerly DD, Blomberg SP, Webb CO. 2010.Picante: R tools for integrating phylogenies and ecology. Bioinformatics26(11):1463–1464DOI 10.1093/bioinformatics/btq166. Kembel SW, Mueller RC. 2014.Plant traits and taxonomy drive host
associa-tions in tropical phyllosphere fungal communities 1.Botany92(4):303–311 DOI 10.1139/cjb-2013-0194.
Kembel SW, O’Connor TK, Arnold HK, Hubbell SP, Wright SJ, Green JL. 2014. Relationships between phyllosphere bacterial communities and plant functional traits in a neotropical forest.Proceedings of the National Academy of Sciences of the United States of America111(38):13715–13720DOI 10.1073/pnas.1216057111. Kim M, Singh D, Lai-Hoe A, Go R, Rahim RA, Ainuddin AN, Chun J, Adams JM. 2012.
Krajina VJ, Klinka K, Worrall J. 1982.Distribution and ecological characteristics of trees and shrubs of British Columbia. University of British Columbia, Faculty of Forestry. Laforest-Lapointe I, Messier C, Kembel SW. 2016.Host species identity, site and time
drive temperate tree phyllosphere bacterial community structure.Microbiome4:27 DOI 10.1186/s40168-016-0174-1.
Lambais MR, Crowley DE, Cury JC, Büll RC, Rodrigues RR. 2006.Bacterial di-versity in tree canopies of the Atlantic forest.Science312(5782):1917–1917 DOI 10.1126/science.1124696.
Lambais MR, Lucheta AR, Crowley DE. 2014.Bacterial community assemblages associated with the phyllosphere, dermosphere, and rhizosphere of tree species of the Atlantic forest are host taxon dependent.Microbial Ecology68(3):567–574 DOI 10.1007/s00248-014-0433-2.
Leff JW, Del Tredici P, Friedman WE, Fierer N. 2015.Spatial structuring of bacterial communities within individual Ginkgo biloba trees.Environmental Microbiology 17(7):2352–2361DOI 10.1111/1462-2920.12695.
Legendre P, Legendre L. 1998.Numerical ecology. Developments in environmental modelling, vol. 24. Elsevier Science, 852p.
Leveau JH, Lindow SE. 2001.Appetite of an epiphyte: quantitative monitoring of bacterial sugar consumption in the phyllosphere.Proceedings of the Na-tional Academy of Sciences of the United States of America98(6):3446–3453 DOI 10.1073/pnas.061629598.
Lichtenthaler HK, Buschmann C, Döll M, Fietz HJ, Bach T, Kozel U, Meier D, Rahmsdorf U. 1981.Photosynthetic activity, chloroplast ultrastructure, and leaf characteristics of high-light and low-light plants and of sun and shade leaves. Photosynthesis Research2(2):115–141DOI 10.1007/BF00028752.
Lindow SE, Brandl MT. 2003.Microbiology of the phyllosphere.Applied and Environ-mental Microbiology69(4):1875–1883DOI 10.1128/AEM.69.4.1875-1883.2003. McGuire KL, Treseder KK. 2010.Microbial communities and their relevance for
ecosystem models: decomposition as a case study.Soil Biology and Biochemistry 42(4):529–535DOI 10.1016/j.soilbio.2009.11.016.
Medina-Martínez MS, Allende A, Barberá GG, Gil MI. 2015.Climatic variations influ-ence the dynamic of epiphyte bacteria of baby lettuce.Food Research International 68:54–61DOI 10.1016/j.foodres.2014.06.009.
Miller WG, Brandl MT, Quiñones B, Lindow SE. 2001.Biological sensor for sucrose availability: relative sensitivities of various reporter genes.Applied and Environmental Microbiology67(3):1308–1317DOI 10.1128/AEM.67.3.1308-1317.2001.
Oksanen J, Kindt R, Legendre P, O’Hara B, Stevens MHH, Oksanen MJ, Suggests MASS. 2007.The vegan package. Community ecology package 10.Available at
http:// vegan.r-forge.r-project.org/.
Paradis E, Claude J, Strimmer K. 2004.APE: analyses of phylogenetics and evolution in R language.Bioinformatics20:289–290DOI 10.1093/bioinformatics/btg412. Penuelas J, Rico L, Ogaya R, Jump AS, Terradas J. 2012.Summer season and
of Quercus ilex in a mixed Mediterranean forest.Plant Biology14(4):565–575 DOI 10.1111/j.1438-8677.2011.00532.x.
R Development Core Team. 2013.R: a language environment for statistical computing. Vienna.Available athttp:// www.R-project.org/.
Redford AJ, Bowers RM, Knight R, Linhart Y, Fierer N. 2010.The ecology of the phyllosphere: geographic and phylogenetic variability in the distribution of bacteria on tree leaves.Environmental Microbiology12(11):2885–2893 DOI 10.1111/j.1462-2920.2010.02258.x.
Redford AJ, Fierer N. 2009.Bacterial succession on the leaf surface: a novel sys-tem for studying successional dynamics.Microbial Ecology58(1):189–198 DOI 10.1007/s00248-009-9495-y.
Reisberg EE, Hildebrandt U, Riederer M, Hentschel U. 2012.Phyllosphere bacterial communities of trichome-bearing and trichomeless Arabidopsis thaliana leaves. Antonie Van Leeuwenhoek101(3):551–560DOI 10.1007/s10482-011-9669-8. Ritpitakphong U, Falquet L, Vimoltust A, Berger A, Métraux JP, L’Haridon F.
2016.The microbiome of the leaf surface of Arabidopsis protects against a fungal pathogen.New Phytologist 210:1033–1043DOI 10.1111/nph.13808.
Rodriguez RJ, White Jr JF, Arnold AE, Redman RS. 2009.Fungal endophytes: diversity and functional roles.New Phytologist 182(2):314–330
DOI 10.1111/j.1469-8137.2009.02773.x.
Scheffers BR, Phillips BL, Laurance WF, Sodhi NS, Diesmos A, Williams SE. 2013. Increasing arboreality with altitude: a novel biogeographic dimension. Proceed-ings of the Royal Society of London B: Biological Sciences280(1770):20131581 DOI 10.1098/rspb.2013.1581.
Segata N, Izard J, Waldron L, Gevers D, Miropolsky L, Garrett WS, Huttenhower C. 2011.Metagenomic biomarker discovery and explanation.Genome Biology 12(6):R60DOI 10.1186/gb-2011-12-6-r60.
Shade A, Handelsman J. 2012.Beyond the Venn diagram: the hunt for a core micro-biome.Environmental Microbiology 14(1):4–12
DOI 10.1111/j.1462-2920.2011.02585.x.
Van Der Heijden MG, Bardgett RD, Van Straalen NM. 2008.The unseen majority: soil microbes as drivers of plant diversity and productivity in terrestrial ecosystems. Ecology Letters11(3):296–310 DOI 10.1111/j.1461-0248.2007.01139.x.
Vorholt JA. 2012.Microbial life in the phyllosphere.Nature Reviews Microbiology 10(12):828–840DOI 10.1038/nrmicro2910.
Wickham H. 2009.ggplot2: elegant graphics for data analysis. New York: Springer. Zhang J, Kobert K, Flouri T, Stamatakis A. 2014.PEAR: a fast and accurate Illumina