Author’s Accepted Manuscript
Assessing Mozambique's exposure to coastal
climate hazards and erosion
Pedro Cabral, Gabriela Augusto, Adeoluwa
Akande, Anjos Costa, Nelson Amade, Sérgio
Niquisse, Ali Atumane, António Cuna, Kiana
Kazemi, Ramires Mlucasse, Rubini Santha
PII:
S2212-4209(16)30619-7
DOI:
http://dx.doi.org/10.1016/j.ijdrr.2017.04.002
Reference:
IJDRR533
To appear in:
International Journal of Disaster Risk Reduction
Received date: 15 November 2016
Revised date:
10 April 2017
Accepted date: 12 April 2017
Cite this article as: Pedro Cabral, Gabriela Augusto, Adeoluwa Akande, Anjos
Costa, Nelson Amade, Sérgio Niquisse, Ali Atumane, António Cuna, Kiana
Kazemi, Ramires Mlucasse and Rubini Santha, Assessing Mozambique's
exposure to coastal climate hazards and erosion,
International Journal of
Disaster Risk Reduction,
http://dx.doi.org/10.1016/j.ijdrr.2017.04.002
This is a PDF file of an unedited manuscript that has been accepted for
publication. As a service to our customers we are providing this early version of
the manuscript. The manuscript will undergo copyediting, typesetting, and
review of the resulting galley proof before it is published in its final citable form.
Please note that during the production process errors may be discovered which
could affect the content, and all legal disclaimers that apply to the journal pertain.
1
Assessing Mozambique’s exposure to coastal climate hazards and erosion
Pedro Cabral1, Gabriela Augusto1, Adeoluwa Akande1, Anjos Costa1,2, Nelson Amade1,2, Sérgio Niquisse1,2, Ali Atumane1,2, António Cuna1,2, Kiana Kazemi1, Ramires Mlucasse1,2, Rubini Santha1
1
NOVA IMS, Universidade Nova de Lisboa, 1070-312, Portugal
2
Universidade Católica de Moçambique, Beira, Moçambique
*Corresponding author, pcabral@novaims.unl.pt
Abstract
An increasing number of people in the world are living in coastal areas characterized by high geophysical and biophysical sensitivity. Thus, it is necessary to provide coastal planners with tools helping them to design efficient management plans to mitigate the negative effects caused by a growing number of coastal climate hazards that threaten life and property. We calculate an Exposure Index (EI) for the coastline of Mozambique and assess the importance of the natural habitats in reducing exposure to coastal climate hazards. We estimate, for year 2015, an increase of 276% in the number of people affected by a high, or very high, level of exposure when compared to a “Without habitats” scenario, i.e. excluding the protective effects of sand dunes, mangroves, and corals. The results of the EI are supported by the Desinventar Database, which has historic data concerning loss and damage caused by events of geological or weather related origin. These results also indicate where the most exposed areas are thereby providing useful information to design effective coastal plans that increase resilience to climate hazards and erosion in Mozambique.
Key-words: InVEST; climate change; ecosystem services; coastal hazard; Desinventar
1. Introduction
The severity of the impacts of extreme and non-extreme weather and climate events depends strongly on the level of vulnerability and exposure to these events [1]. It is widely accepted that coasts will be exposed to increasing climate hazards in the coming decades due to climate change and sea-level rise [2]. Exposure is defined as “the situation of people, property, systems, or other elements present in hazard zones that are thereby subject to potential losses” [3] and vulnerability refers to “the characteristics and circumstances of a community, system or asset that make it susceptible to the damaging effects of a hazard” [2]. Exposure is also referred to as biophysical
2
vulnerability, site, and situation of the place, whereas vulnerability is referred to as social vulnerability comprising the built environment and the social fabric [4,5].
Coastal regions are particularly exposed, although with different levels of vulnerability, to the adverse effects of climate change and sea-level rise, leading to increased risks that include loss and damage by climate hazards and coastal erosion, which may be exacerbated by increasing human-induced pressures [6]. However, coastal areas are attracting an increasing number of people because they often provide more subsistence resources than those found inland, more access points to marine trade and transport, more recreational, and cultural opportunities and, for some, a special sense of place at the land/sea interface [7]. This population growth, and the associated high urbanization rates, are driven by fast economic development and migration toward the coast [8,9]. Consequently, the degree of exposure coastal populations is being boosted by the pressures added to coastal systems that need to accommodate more and more people and associated infrastructures [10,11], and by the expected increase in coastal flooding and sea level rise [12]. The exposure of coastal areas depends greatly on their geomorphologic characteristics, and a significant reduction in the exposure of coastal areas to climate hazards and erosion can be achieved through the conservation of natural habitats that provide protection to the coast (e.g. dunes, mangroves, corals, seagrasses, etc.), or by building coastal protection infrastructures [13–16]. The former is generally an option for most countries, but the latter is only viable for countries that can afford to pay for expensive engineering infrastructures [17].
The need exists to study coastal exposure and a considerable number of studies have been carried out for many regions in the world using different methodologies [10,13,18–23]. However, with some exceptions [24,25], these studies are scarce for Africa. Historic data availability for African countries, and particularly on sea-level rise, is fairly limited when compared to other regions in the World [26]. In Mozambique, a country that has been identified as being particularly exposed to increased flooding due to the occurrence of tropical storms [27,1,28], with the exception of a study for the city of Beira [28], there is no study reported to date about exposure to coastal climate hazards and erosion. Besides having one of the longest African coastlines (approximately 2,700km) this country also has approximately 60% of its population located in coastal districts [29–31].
In this article we calculate the exposure index of the Mozambique coast to climate hazards and erosion using a 1km2 spatial resolution. To assess the model pertinence, the results of the exposure index (EI) are compared with the Desinventar Database [32], which has historical data concerning loss and damage caused by events of geological or weather related origin. We also assess the importance of the habitats in reducing exposure to coastal climate hazards and erosion.
3
2. The study area
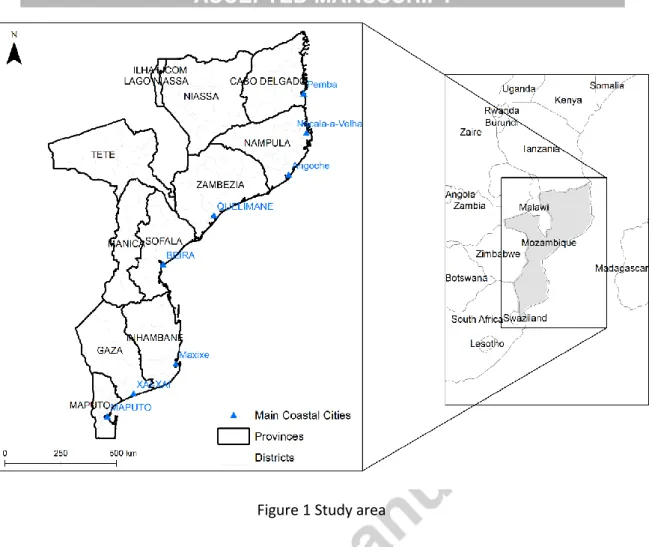
Mozambique is located in southeast Africa and comprises a land surface of about 800,000 km2. Maputo is the capital and the country’s largest city (Figure 1). The country had an estimated population of 25 million inhabitants in 2014 [33]. About 70% of Mozambicans live in rural areas, and 40% of them are located in the districts of Nampula and Zambézia [33]. About 45% of the population is under 14 years old, and the elderly represent about 3.5% of the total population [33]. Typically Mozambicans live in large families, 53.9% of the families have more than 5 members, and the presence of collateral related family, or unrelated elements in the household is relatively common (15%) [34]. The purchasing power in Mozambique has been rising sharply, but on average each Mozambican spends less than 21 USD per month, or about 14 USD per month if living in a rural area [34]. Most lodgings are built of adobe; only 18% of the houses are made of bricks, and 30% of the families live in houses made of precarious building materials [34]. Safe water supply reaches roughly half of the households, and the electric utility network is poor or nonexistent in rural households. Safe sanitation covers less than 1% of rural households. Nearly 45% of the Mozambican population cannot write or read, and this percentage is higher among women (58%) [34].
Mozambique is divided into 11 provinces and shares borders with Tanzania, Malawi, Zambia, Zimbabwe, South Africa, and Swaziland. After a devastating civil war that ended in 1992 [35], the first democratic elections took place in 1994, and since then the country has enjoyed political stability and rapid economic growth (7.4% of annual GDP growth in 2014) (World Bank, 2016). A Gross Domestic Product (GDP) of US$16.961 billion and a Gross National Income (GNI) per capita of US$600 in 2014 (World Bank, 2016) make Mozambique one of the poorest countries in the world. This country ranked 180th out of 188 countries in the most recent Human Development Index (HDI) [37].
4
Figure 1 Study area
There are 104 identified river basins flowing into 11 major rivers, with the Zambezi and Limpopo being the two largest, that drain the water from the Central African high plateau into the Indian Ocean [38,39]. The majority of the rivers have a torrential, wet season regime with high waters during 3-4 months, and low, dry season flows (sometimes totally dry) for the remainder of the year. Up to 52% of the country is within international river basins [39]. The continental shelf is wider in the center (approximately 145km, near Sofala), decreasing in both north and south [40,41].
The Mozambican coast is divided into three main areas: the sandy coastline in the south, the estuarine coast in the center, and the coralline coast, with coral limestone in the north [40,42]. The sandy coastline starts at the South African border and extends to the Save Delta. It is a lowland coast dominated by sand dunes, lakes, lagoons, and bays receiving river estuaries, namely the Maputo bay, which accepts the estuaries of four rivers [41,42]. This lowland coast is bordered by an extensive dune system [41] dominated by wetlands of the deltas of large rivers in the estuarine coastline. The estuarine coastline starts at the mouth of the Save (130km south of Beira), and extends to Angoche, encompassing the Zambezi river delta. The coralline coastline covers over 700km from Angoche until the Tanzanian border. This is a narrow coastline with the bordering plateau sloping into hills and highlands. The whole coast is also punctuated by numerous coral and
5
sandy islands, some very popular for recreation and leisure. The coast of Mozambique has 49 districts, belonging to different provinces, evenly distributed among the three natural areas.
Mozambique has a tropical climate with two distinct climatic seasons, a wet summer from October to March and a dry winter from April to September. The tropical cyclone season in the South Indian Ocean occurs between November and April, and over half of the storms that occur during a typical season appear in January or February [43]. On average 1.16 tropical cyclones per year made landfall in Mozambique, between 1980 and 2007 [44]. About half of those were formed in the Mozambique Channel [45]. The frequency and intensity of tropical cyclones has increased since 1993, with seven cyclones of category 3 to 5 hitting the coastline in the period 1994-2007, against only two in the previous 12 years [43]. Of the 15 cyclones occurring on the Mozambican coast between 1980 and 2007, eight hit the estuarine coastline, four in the coralline coastline, and three in the sandy coastline [46].
The Mozambique coast is largely dominated by natural habitats, although their conservation status is not always optimal [40,47]. Sand dunes are common all along the coast. In the southernmost part of the Mozambique coast, the sandy coastline consists of a low lying coastal plain separated from the coast by an uninterrupted undulating cordon of sand dunes extending for 100km, up to 2km width and rising to over 100m above sea level at some points [48]. This extensive dune system is interrupted on the estuary coast in the center by wetlands, where the dominant natural habitat is mangroves. In the narrow coralline coast north of Angoche the sand dunes are small, alternating with cliffs and attached beaches[48]. Mangroves occur along the whole Mozambican coast. In the coralline coast, where rivers are non-tidal, mangroves are mainly confined to the vicinity of river mouths. In the estuarine coast, the estuaries and deltas of big rivers such as the Save, Zambezi, Púnguè, and Buzi, allow for mangroves to extend for dozens of kilometers inland and hundreds of kilometers along the coast. Mangroves are also found in the sandy coastline, again in the estuary of rivers, notably in the Morrumbene estuary and on the bays of Maputo and Inhambane.
There are nine species of mangrove trees in Mozambique, and the estimated area of this forest in the country is over 350,000ha [40]. The estimated area of coral reefs in Mozambique coast ranges from 413 to 570km2 [38]. In the northernmost part of the coast, coral reefs constitute an almost continuous fringing reef for more than 700km on the eastern shores of the islands and in the exposed mainland coast. The turbidity of the coast around the main river mouths on the estuarine coast does not allow coral reefs to thrive, but along the sandy southern coast, for about 850km, coral reefs are again found, although more sparsely than in the north. Coral reefs are one of the major attractions for the coastal tourism industry, and many infrastructures are already in place for that activity [47].
6
Mozambique is likely to be severely affected by climate change and the rising sea level because of its location in the inter-tropical conversion zone, its long coastline with large portions below sea level, and because it is a catchment zone of large international river basins[31]. Coastal erosion is also a pressing concern in Mozambique. South of Maputo the estimated average coastal retreat increased from 0.11m/year in the period 1971-1975 to 1.1m/year in the period of 1999-2004 [49], caused by climate change and land cover changes [50]. Coastal erosion is also a major concern in the mangrove region, threatening the mangroves and forcing population displacement [50,51].
3. Materials and methods
The Exposure Index
The relative exposure of the Mozambican coastline to coastal erosion and inundation was estimated using the Coastal Vulnerability model available in InVEST [52]. InVEST is a free open-source tool developed by the Natural Capital Project, available at www.naturalcapitalproject.org. It includes a set of different ecosystem service models. Besides being an intuitive tool, it has also been designed for data poor environments as is the case of this study. The Coastal Vulnerability model provides an Exposure Index (EI) map by ranking biophysical variables for each coastline segment, or pixel (Eq. 1):
EI = (RGeomorphologyRReliefRHabitatsRWindExposureRWaveExposureRSurge)1/7 (Eq. 1)
where EI is the Exposure Index and Ri represents the ranking of the ith bio-geophysical variable used
to calculate the EI. The variables used in this model are the following [53]: RGeomorphology is the
rank of geomorphology for each coastline segment; RRelief is the relief ranking of each coastline
segment; RHabitats is a natural habitat ranking for each coastline segment; RWindExposure is the wind
exposure ranking of each coastline segment; RWaveExposure is the average height of adjacent seas, and
RSurge is the distance ranking between the coastline and the edge of the continental margin. Although
this model allows for the inclusion of a variable of sea-level rise (SLR), this variable was not considered in this study due to the lack of data.
This model weights equally the variables that consider the effect of storms on exposure by incorporating wind, waves, and surge potential data as well as data and models for habitat type, geomorphology, relief, and sea level rise [13]. This model was selected because it is freely accessible and because it provides spatially explicit and quantitative outputs, making it useful for coastal management assessments [13,52]. Additionally, it requires a relatively low quantity of data and has
7
been successfully applied in different study areas [13,53,54]. The model also enables the estimation of the population subject to coastal hazards and erosion by extracting population values from the grid cell that overlaps the shoreline segment [52].
Habitat scenarios
The habitats considered in this study, i.e. mangroves, coral reefs and sand dunes, are generally accepted as important factors in the protection of coastlines worldwide. The ability of mangroves to protect population and infrastructure from storms and cyclones has been widely assessed in numerous scientific studies [15,55]. Coral reefs have also been acknowledged for dissipating wave energy and, therefore, helping to avoid the worst effects of sea storms on habitats and infrastructures of nearby coasts [56,57]. Sand dunes are important in preventing coastal erosion and flooding [58,59]. Despite the presence of other important habitats, such as seagrass beds, and their importance in coastal protection [13], these were not included in the model due to data unavailability.
To assess the role of coastal ecosystems in reducing exposure to sea-level rise and storms, two scenarios were developed: (i) the “With habitats” scenario, which included the three habitats (mangroves, coral reefs, and sand dunes) in the exposure index; and (ii) the “Without habitats” scenario, which assumed that those habitats no longer provide protection. The “With habitats” scenario corresponds to the “current state” of the system. The “Without habitats” scenario is an extreme situation that is used to evaluate where, and to what extent, habitats play a significant role in protecting people, and to determine where their loss would affect exposure from coastal hazards. Future scenarios are expected to vary along this spectrum between the “current state” of the system and a total degradation of the protective effect of habitats.
Data and preprocessing
A national-scale database was developed to assess the Mozambican coastal exposure. This included data gathered from local (GIS Center of the Catholic University of Mozambique – UCM, in Beira) and state agencies (CENACARTA, National Centre of Cartography, http://www.cenacarta.com), as well as through the Internet to access global datasets produced by several organizations (Table 1). All the data were preprocessed using ArcGIS software [60] and had, or were converted into the Universal Transverse Mercator (UTM) projected coordinate system using the World Geodetic System datum 84 (WGS 84).
8 Table 1 Description of datasets used in the study
Dataset Description Source
Land polygon Geographic shape of the coastal area of interest, depicting the boundaries of land and seascape.
[61]
Relief The Digital Elevation Model (DEM) that was used to compute the relief ranking of each shoreline segment was the Advanced Spaceborne Thermal Emission and Reflection Radiometer (ASTER) which has a spatial resolution of 30 meters.
[62]
Geomorphology The geomorphology map was obtained using the shoreline map from the Global Self-consistent, Hierarchical, High-resolution Geography Database (GSHHG) and a lithology map from CENACARTA.
UCM GIS Center,
CENACARTA and [61] Natural habitats The dune and mangrove habitats were extracted from the
Mozambican land cover map of 1999 produced by CENACARTA. The coral reefs polygon ESRI shapefile was provided by the UCM GIS Center.
CENACARTA and UCM GIS Center (1999)
Climate forcing grid
This input was used to compute the Wind and Wave Exposure ranking of each shoreline segment. We used the full-spectral third-generation wind-wave model WaveWatch III.
[63]
Continental shelf Depth contour used as an indicator for surge level. [52] Bathymetry This input is used to compute the average depth along the fetch
rays to determine the exposure of each shoreline segment and in the computation of the surge potential. This grid has a spatial resolution of 30 arc-second.
[64]
Population We used the estimates of the Gridded Population of the World (GPW) population data for year 2015 with a spatial resolution of 2.5 arc minutes.
[65]
The lithology map used to compute the RGeomorphology variable was reclassified from 1 (very low
erodibility) to 5 (very high erodibility) with the help of experts from the Portuguese National Laboratory of Energy and Geology (LNEG). Alluvions and terraces were given the maximum value of erodibility (i.e., 5). Undifferentiated deposits received value 4. Sandstones, clays, and related rocks were classified with 3. Basic and carbonate rocks were classified with 2. Gneisses, migmatites, granites, and related rocks were given value 1. Finally, a GIS procedure was used to assign the value of the reclassified lithology polygons to the shoreline map.
9
The natural habitats were associated with an increasing exposure rank, from 1 (very low) to 5 (very high) [13]. The coral reefs and mangroves were classified with value 1, and dunes with value 2. The corals and mangroves protective distance considered was 2000m. The dunes’ protective distance was set to 300m [52].
Model validation
To validate the ability of the exposure index to capture the exposure to coastal climate hazards, we used the publicly available Desinventar Database [32]. This database compiles records of disaster loss and damage from events of geological or weather related origin in 82 countries, including Mozambique. The data contained in the Desinventar Database are allocated by district, so we report the exposure index of individual cells also using the district level. The districts have different numbers of cells, each with its own computed and classified exposure index, and for this reason we decided to classify as “Exposed” any district in which 10% or more of its cells belonged to the “High” or “Very High” classes of the exposure index. Using this criterion, data concerning loss and damage from coastal climate events from the Desinventar Database were compared to investigate if “Exposed” districts had a significantly different record from the districts considered “Less exposed” by the model concerning climate hazards typically associated with the coast: tropical depression, surge, strong wind, storm, rains, floods, flash flood, and cyclone. A total of 2003 records of damage and loss due to these events occurred in the 128 districts of Mozambique, 711 of these were located in 48 coastal districts.
4. Results
4.1 The Exposure Index (EI)
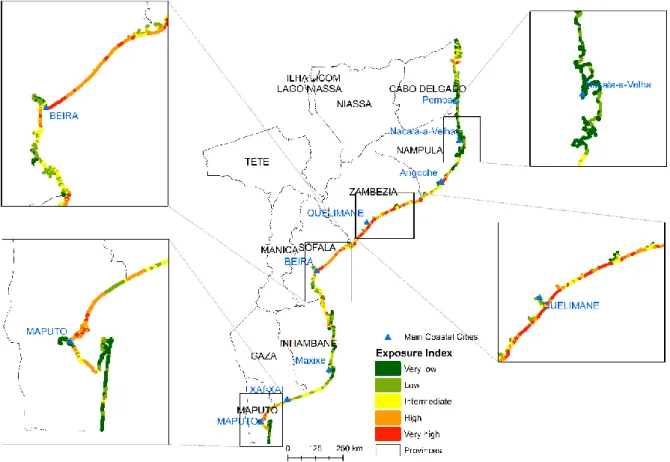
The exposure index (EI), which is a relative index resulting from the InVEST Coastal Vulnerability model, was calculated for the “with” and “without” habitats scenarios. The values of the cells of the two resulting rasters (one for each scenario) were combined together and classified into five quintiles as follows: Very low” (<2.54); “Low” (2.54 to 2.90); “Moderate” (2.90 to 3.22); “High” (3.22 to 3.53); and “Very high” (> 3.53). Figure 2 shows the relative exposure to coastal hazard and erosion of each 1km2 compared with all other segments of Mozambique in the “With habitats” scenario.
10
Figure 2 Exposure Index for Mozambique in the “With habitats” scenario
The most important concentration of cells classified as “High” and “Very high” exposure are located in the Provinces of Zambézia and Sofala, which correspond to lowlands with unfavorable geomorphology.
4.1.1 The habitats’ importance in coastal protection
About 23.4% of the cells of the resulting EI for the Mozambique coast were classified with “High” or “Very high” exposure to coastal climate events and erosion in the “With habitats” scenario. This value increases to 57.8% in the “Without habitats” scenario; 26 coastal districts (out of a total of 49) have 10% of more of their cells classified as “High” or “Very high” exposure level in the “With habitats” scenario. In the “Without habitats” scenario this number would increase to 41 (Figure 3). The absence of the protective effect of the habitats in Mozambique coast would expose about 577,448 people to coastal climate hazards and erosion, representing an increase of 276% in the number of exposed people. The average EI for the Mozambique coast would increase from 2.81 in the “With habitats” scenario to 3.26 if the protective effect of habitats was removed, i.e., an increase of 16%.
11
Figure 3 Exposed districts in the “With habitats” (A, map on the left) and in the “Without habitats” (B, map on the right) scenarios
4.2 Comparison of EI with recorded history of coastal climate events causing loss and damage
For validation purposes, we considered only the exposed districts of the “With habitats” scenario, as this is assumed to be the “current state” of the system. The coastal districts in this scenario were split into two sets regarding coastal climate hazards types according to the Desinventar Database, one referring to the districts deemed exposed by the model, and the other set with the districts that the model considers less exposed (Figure 3). On average, each exposed district suffered 15.8 climate related events causing loss or damage, whereas the less exposed districts suffered on average 12.7 events for the same period of time (Table 2). This difference is not statistically significant (p-value= 0.199).
12
Table 2 Coastal climate events causing damage and/or loss and human casualties between 1975 and 2015 (Source: Desinventar Database, 2016 [32])
Average in exposed districts
Average in less exposed districts
p-value
Coastal climate events causing damage and/or loss
15.8 12.7 0.199
Coastal climate events causing human casualties
5.28 2.48 0.012
However, the human casualties occurring as a direct consequence of climate related events are still the most important indicator of the severity of the event. Thus, the most pertinent variable to be considered in the model assessment is the number of events causing fatalities, as this is the first consequence to be avoided. According to the Desinventar Database, there were 147 climate related events that caused deaths in the coastal districts of Mozambique between 1975 and 2015. Cyclones, floods, and flash floods accounted for the large majority of these events (Figure 4). On average, the exposed districts suffered 4.66 climate related events causing death among their population, whereas the less exposed districts suffered 2.65 deadly climate related events. This difference is statistically significant (p-value of 0.012).
0 0.5 1 1.5 CYCLONE FLASH FLOOD FLOOD RAINS STORM STRONG WIND THUNDER STORM TROP. DEPRESS.
Coastal climate hazards causing human casualties in
Mozambique coastal districts (1979-2015)
Average number of events with human casualties in less Exposed Districts
Average number of events with human casualties in Exposed Districts
13
Figure 4 Coastal climate hazards causing human casualties in Mozambique’s coastal districts (1979-2015) (Source: Desinventar Database, 2016)
These results support the pertinence of the EI indicating that exposed districts are more likely to suffer damage and loss from climatic events, and are also more likely to suffer fatalities from cyclones, floods, and storms. As the two sets of data are totally unrelated except for the geographic location, and the Desinventar Database records the historic “ground truth” of coastal climate hazards, it is therefore reasonable to assume that the EI is a pertinent measure of coastal exposure to climate coastal events and erosion on the Mozambique coast.
5. Discussion
An Exposure Index for Mozambique
The Mozambique coast is attracting considerable interest for development projects in agriculture, aquaculture, energy crops, tourism, and related infrastructures [31,66]. Whereas most of these projects are desirable and may help to improve the life of a growing population, the local and national decision makers should account for all ecosystem services whenever a natural habitat is replaced by some other land use required for these projects. The protection of the coast is one of the ecosystem services seldom accounted for. The EI map proposes a first glance regarding the exposure to climate hazards and erosion of the whole Mozambique coast. Moreover, it provides valuable hints regarding the importance of habitat conservation for the protection of coastal populations from climate hazards and coastal erosion.
Results point to the particularly high exposure of districts belonging to the central estuarine region, where 14 out of 15 have more than 10% of their coastal area classified as “High” or “Very high” by the EI. The removal or extreme deterioration of mangrove in this region would place all the districts of the estuarine region into the situation of highly exposed. Coincidently, the estuarine coast is also the region where cyclones hit twice as often as in the north or the south [46], and is the coastal region more prone to suffer from floods due to the transnational and torrential nature of its big rivers. Moreover, mangroves due to the extraordinary range of goods and services provided to the local population [51,55], attract a great number of inhabitants who tend to dwell very close to the coastline. As a consequence, the number of people affected by coastal hazards is greater in this region. It should also be noted that while providing protection to the coast mangroves themselves are affected by climate hazards [67]. The importance of mangrove conservation and management is clearly expressed by the Mozambique government national strategy and action plan for mangrove
14
protection and rehabilitation of mangrove forests [30]. It should be stressed though that the regular flow of freshwater, crucial for the conservation status of mangroves [30,40], requires the management of river basins well outside of Mozambique.
The importance of the wooded dunes in the sandy coast is also clearly highlighted by the EI results. The absence of this habitat would expose nine more districts to coastal climate hazards and erosion. Without sand dunes, 14 of the 15 districts in the southern coast would be highly and very highly exposed to climate events and erosion. Wooded sand dunes are also under considerable pressure due to the development of tourism and increasing reclamation of land for agriculture, and this region of the coast is particularly subject to coastal erosion due to sea dynamics [50].
The absence of habitats in the coral coast would also increase the number of exposed districts by 58%. The deficient management of fishing is one of the main threats to coral reefs on the Mozambique coast [47], while inland pollution and the deterioration of mangroves trapping sediments from inland are also a concern [31]. It must be noted however that many of the coral reefs of Mozambique are located in the dozens of islands that were not included in this study.
Model validation
Model validation is an important aspect to consider when producing exposure maps, or any kind of modelling output, in order to demonstrate the correctness of the theoretically presumed indications of exposure and the validity of the indicators [68,69]. In this paper we used the publically available Desinventar Database [32] to assess the accuracy of our model. This freely available database has proved to be an extremely valuable asset to be used in exposure studies. The validation method developed in this study shows how to take advantage of this database in a very straightforward way.
Limitations
A number of limitations of this modeling approach are identified in the InVEST model manual including the simplification of the exposure index calculation into the geometric mean of seven variables and exposure categories [52]. In addition to those, we would like to stress some features, such as the quality and conservation status of the habitats that were not considered in our model. Other identified limitations include data scarcity, which was an important hindrance we had to deal with. For instance, data about the sea level rise for Mozambique come from a single station in Maputo. If more observations were available, it would be possible to estimate the trend of sea level variation by fitting the available observations to a linear regression and producing different sea level rise scenarios. For this reason, we did not create scenarios of sea level rise in this study.
15
The habitats dataset was produced in 1999, which makes it outdated. Nevertheless, we must accept its important impact on the results. Future versions of this model should use more recent maps of habitats, as well as consider additional habitats that are important for coastal protection (e.g. seagrass beds, kelp forests, others) [13], mostly because there has been a strong upturn in tourism and other economic activities in Mozambique coastal areas. We used estimates of Mozambican population for year 2015, which may also inaccurately represent the number of people actually living in the coastal districts of Mozambique. Additionally, and regarding the importance of casualties caused by climate related events, the lack of estimates for population in Mozambique districts in the period covered by the database, precludes further investigation. During that time period the Mozambique population more than doubled, and there were massive unmonitored population displacements during the civil war. Another point to address concerns the coastal morphology. South of mouth of the Zambezi river the coast is a large lowland plain where the land morphology provides no physical obstacles to storm progression, and therefore the 1km inland distance may not be the appropriate measure to estimate the population and infrastructure likely to be affected by cyclones or floods. This is especially the case for the estuarine region, where mangroves encourage the settlement of more population than sand dunes or beaches. Thus, the affected population is likely to be largely underestimated in these areas. Bearing in mind that most lodgings in the country are of light construction, cyclones do cause loss and damage hundreds of kilometers inland.
Finally, it is important to stress that this is not a vulnerability model for the Mozambique coast [4]. The EI map only addresses exposure, or the “biophysical vulnerability”. Studies concerning the social vulnerability to climate hazards in Africa will undoubtedly be of utmost importance and interest, especially in highly dynamic demographic regions, as is the case of Mozambique.
6. Conclusions
Material losses due to climate events in developing countries, such as Mozambique, have severe implications in the lives of the populations [51,70]. Climate related events often cause the loss of crops and infrastructures, endangering the lives and health of the population through famine, water contamination, and blocking much needed aid for the population during and long after the disaster [51,70]. Mozambique is demonstrating an astonishing capacity to prepare and adapt its population to climate hazards with very limited resources and capacities [71]. Some challenges demand international support as pressure on coastal areas will increase with the economic development of an increasing population and ongoing climate change. This support is especially crucial in the management of the large rivers that the country shares with neighboring states: more than the impact of the level of fresh water flow on the welfare of the local population and the conservation of
16
coastal habitats, we should note that according to the Desinventar Database, the main events causing casualties, loss, and damage in Mozambique are droughts and floods.
This study presented a methodology for obtaining an EI for the Mozambique coastline. The results are statistically supported by independent validation data from the Desinventar Database. The EI is a valid indicator to assess the coastal exposure and anticipate the effects of land cover changes in the exposure of coastal infrastructures and populations to coastal climate hazards and erosion. The model provides a consistent framework to assess and analyze coastal exposure in a country which needs to deal with coastal hazards regularly, and where coastal erosion is a pressing challenge. Additionally, the study reveals the importance of preserving the natural habitats to save lives from coastal hazard events. This is particularly important for poor countries that do not have the financial means to build and maintain coastal protection infrastructures. Finally, it also demonstrates the importance of having updated datasets for building better exposure models. The model’s accuracy can be easily improved with the update of the multiple underlying datasets and some local adjustments to expand affected areas according to coastal morphology. The findings of this study may help decision makers to prioritize conservation efforts to avoid the worst effects of climate coastal hazards and coastal erosion in Mozambique.
Acknowledgements
The authors would like to acknowledge the contributions of Aurete Pereira and Tomás Oliveira from LNEG for helping with information about the lithology map. We would also like to thank Gregg Verutes from the Natural Capital Project, who helped us decisively in calibrating and interpreting some results of the InVEST coastal vulnerability model.
17
References
[1] O.-D. Cardona, M.K. van Aalst, J. Birkmann, M. Fordham, G. McGregor, R. Perez, et al., Determinants of Risk: Exposure and Vulnerability, in: C.B. Field, V. Barros, T.F. Stocker, Q. Dahe (Eds.), Manag. Risks Extrem. Events Disasters to Adv. Clim. Chang. Adapt., Cambridge University Press, Cambridge, 2012: pp. 65–108. doi:10.1017/CBO9781139177245.005. [2] C.B. Field, V.R. Barros, D.J. Dokken, K.J. Mach, M.D. Mastrandrea, eds., Coastal Systems and
Low-Lying Areas, in: Clim. Chang. 2014 Impacts, Adapt. Vulnerability, Cambridge University Press, Cambridge, 2014: pp. 361–410. doi:10.1017/CBO9781107415379.010.
[3] UNISDR, Terminology on Disaster Risk Reduction. United Nations International Strategy for Disaster Reduction, (2009). http://www.unisdr.org/we/inform/publications/7817 (accessed January 11, 2016).
[4] S.L. Cutter, B.J. Boruff, W.L. Shirley, Social Vulnerability to Environmental Hazards, Soc. Sci. Q. 84 (2003) 242–261. doi:10.1111/1540-6237.8402002.
[5] V.N. Martins, D.S. Silva, P. Cabral, Social vulnerability assessment to seismic risk using multicriteria analysis: the case study of Vila Franca do Campo (São Miguel Island, Azores, Portugal), Nat. Hazards. 62 (2012) 385–404. doi:10.1007/s11069-012-0084-x.
[6] R.J. Nicholls, P.P. Wong, V.R. Burkett, J.O. Codignotto, J.E. Hay, R.F. McLean, et al., Coastal systems and low-lying areas. Contribution of Working Group II to the Fourth Assessment Report of the Intergovernmental Panel on Climate Change., in: M.L. Parry, O.F. Canziani, J.P. Palutikof, P.J. van der Linden, C.E. Hanson (Eds.), Clim. Chang. 2007 Impacts, Adapt.
Vulnerability, Cambridge University Press, Cambridge, UK, 2007: pp. 315–356. https://www.ipcc.ch/pdf/assessment-report/ar4/wg2/ar4-wg2-chapter6.pdf.
[7] B. Neumann, A.T. Vafeidis, J. Zimmermann, R.J. Nicholls, Future coastal population growth and exposure to sea-level rise and coastal flooding--a global assessment., PLoS One. 10 (2015) e0118571. doi:10.1371/journal.pone.0118571.
[8] G. McGranahan, D. Balk, B. Anderson, The rising tide: assessing the risks of climate change and human settlements in low elevation coastal zones, Environ. Urban. 19 (2007) 17–37. doi:10.1177/0956247807076960.
[9] K. Smith, We are seven billion, Nat. Clim. Chang. 1 (2011) 331–335. doi:10.1038/nclimate1235.
18
beaches of Porto de Mós and Falésia, Algarve (Portugal), J. Coast. Conserv. 16 (2012) 503– 510.
[11] EEA, The changing faces of Europe’s coastal areas, Copenhagen, Denmark, 2006. http://www.eea.europa.eu/publications/eea_report_2006_6.
[12] IPCC, Climate Change 2014: Synthesis Report. Contribution of Working Groups I, II and III to the Fifth Assessment Report of the Intergovernmental Panel on Climate Change [Core Writing Team, R.K. Pachauri and L.A. Meyer (eds.)], Geneva, Switzerland, 2014.
[13] K.K. Arkema, G. Guannel, G. Verutes, S.A. Wood, A. Guerry, M. Ruckelshaus, et al., Coastal habitats shield people and property from sea-level rise and storms, Nat. Clim. Chang. 3 (2013) 913–918. doi:10.1038/nclimate1944.
[14] E.B. Barbier, Valuing the storm protection service of estuarine and coastal ecosystems, Ecosyst. Serv. 11 (2015) 32–38. doi:10.1016/j.ecoser.2014.06.010.
[15] S. Das, A.-S. Crépin, Mangroves can provide protection against wind damage during storms, Estuar. Coast. Shelf Sci. 134 (2013) 98–107. doi:10.1016/j.ecss.2013.09.021.
[16] S. Das, The role of natural ecosystems and socio-economic factors in the vulnerability of coastal villages to cyclone and storm surge, Nat. Hazards. 64 (2012) 531–546.
doi:10.1007/s11069-012-0255-9.
[17] S. Brown, R.J. Nicholls, C.D. Woodroffe, S. Hanson, J. Hinkel, A.S. Kebede, et al., Sea-Level Rise Impacts and Responses: A Global Perspective, in: Springer Netherlands, 2013: pp. 117–149. doi:10.1007/978-94-007-5234-4_5.
[18] P.D. Kunte, N. Jauhari, U. Mehrotra, M. Kotha, A.S. Hursthouse, A.S. Gagnon, Multi-hazards coastal vulnerability assessment of Goa, India, using geospatial techniques, Ocean Coast. Manag. 95 (2014) 264–281. doi:10.1016/j.ocecoaman.2014.04.024.
[19] M.E. Hereher, Vulnerability assessment of the Saudi Arabian Red Sea coast to climate change, Environ. Earth Sci. 75 (2016) 30. doi:10.1007/s12665-015-4835-3.
[20] G.S. Dwarakish, S.A. Vinay, U. Natesan, T. Asano, T. Kakinuma, K. Venkataramana, et al., Coastal vulnerability assessment of the future sea level rise in Udupi coastal zone of Karnataka state, west coast of India, Ocean Coast. Manag. 52 (2009) 467–478. doi:10.1016/j.ocecoaman.2009.07.007.
19
of coastal multi-hazard vulnerability along the Cuddalore–Villupuram, east coast of India using geospatial techniques, Ocean Coast. Manag. 54 (2011) 302–311.
doi:10.1016/j.ocecoaman.2010.12.008.
[22] T. Wu, X. Hou, Q. Chen, Coastal economic vulnerability to sea level rise of Bohai Rim in China, Nat. Hazards. 80 (2016) 1231–1241. doi:10.1007/s11069-015-2020-3.
[23] P. Sheik Mujabar, N. Chandrasekar, Coastal erosion hazard and vulnerability assessment for southern coastal Tamil Nadu of India by using remote sensing and GIS, Nat. Hazards. 69 (2013) 1295–1314. doi:10.1007/s11069-011-9962-x.
[24] K.A. Addo, Assessing Coastal Vulnerability Index to Climate Change: the Case of Accra – Ghana, J. Coast. Res. 165 (2013) 1892–1897. doi:10.2112/SI65-320.1.
[25] I.O. Adelekan, Vulnerability of poor urban coastal communities to flooding in Lagos, Nigeria, Environ. Urban. 22 (2010) 433–450. doi:10.1177/0956247810380141.
[26] P. Woodworth, A. Aman, T. Aarup, Sea level monitoring in Africa, African J. Mar. Sci. 29 (2007) 321–330. doi:10.2989/AJMS.2007.29.3.2.332.
[27] R.J. Nicholls, R.S.J. Tol, Impacts and responses to sea-level rise: a global analysis of the SRES scenarios over the twenty-first century, Philos. Trans. R. Soc. A Math. Phys. Eng. Sci. 364 (2006) 1073–1095. doi:10.1098/rsta.2006.1754.
[28] D. Chemane, H. Motta, M. Achimo, Vulnerability of coastal resources to climate changes in Mozambique: a call for integrated coastal zone management, Ocean Coast. Manag. 37 (1997) 63–83. doi:10.1016/S0964-5691(97)00073-2.
[29] INE, Recenseamento Geral da População e Habitação, (2016).
http://www.ine.gov.mz/operacoes-estatisticas/censos/censo-2007/rgph-2007.
[30] República de Moçambique, Estratégia e plano de acção nacional para restauração de mangal 2015-2020. Ministério da Terra, Ambiente e Desenvolvimento Rural, Centro de
Desenvolvimento Sustentável para as Zonas Costeira, (2015) 43.
[31] República de Moçambique, Estratégia Nacional de Adaptação e Mitigação de Mudanças
Climáticas 2013-2025, Ministério para a Coordenação da Acção Ambiental, (2015) 71. http://www.cgcmc.gov.mz/pt/politicas-estrategias/94-estrategia-nacional-de-adaptacao-e-mitigacao-de-mudancas-climaticas.
20 Reduction, (2016). http://www.desinventar.net/.
[33] INE, Estatísticas e Indicadores Sociais, Maputo, Mozambique, 2014.
http://www.ine.gov.mz/estatisticas/estatisticas-demograficas-e-indicadores-sociais/estatisticas-e-indicadores-sociais/estatisticas-e-indicadores-sociais-2014/view. [34] INE, Relatório final do inquérito ao orçamento familiar - IOF-2014/15, Maputo, Mozambique,
2016. http://www.ine.gov.mz/operacoes-estatisticas/inqueritos/inquerito-sobre-orcamento-familiar/relatorio-final-do-inquerito-ao-orcamento-familiar-iof-2014-15/view.
[35] R. Brouwer, M.P. Falcão, Wood fuel consumption in Maputo, Mozambique, Biomass and
Bioenergy. 27 (2004) 233–245. doi:10.1016/j.biombioe.2004.01.005.
[36] World Bank, Mozambique, (2016). http://data.worldbank.org/country/mozambique
(accessed March 19, 2016).
[37] UNDP, Human Development Report 2015 - Work for Human Development, 2015.
http://hdr.undp.org/sites/default/files/2015_human_development_report_1.pdf.
[38] C. Wong, M. Roy, A.K. Duraiappah, Focus on Mozambique, 2005.
[39] F. Tauacale, Water Resources of Mozambique “and the situation of the shared rivers,” in: River Basin Inf. Syst. Meet., Nairobi, Kenya, 2002.
http://www.unep.org/DEWA/water/RiverBasin/documents/Presentations/Francisco.doc. [40] F.M.A. Barbosa, C.C. Cuambe, S.O. Bandeira, Status and distribution of mangroves in
Mozambique, South African J. Bot. 67 (2001) 393–398. doi:10.1016/S0254-6299(15)31155-8. [41] S.J. Armitage, G.A. Botha, G.A.T. Duller, A.G. Wintle, L.P. Rebêlo, F.J. Momade, The formation and evolution of the barrier islands of Inhaca and Bazaruto, Mozambique, Geomorphology. 82 (2006) 295–308. doi:10.1016/j.geomorph.2006.05.011.
[42] MICOA, Centro de Desenvolvimento Sustentável para as Zonas Costeiras, Ministério para a Coordenação da Acção Ambiental, (2016).
http://www.zonascosteiras.gov.mz/rubrique.php3?id_rubrique=2O/;Jny 2001. 67 393-398 (accessed June 12, 2016).
[43] A. Mavume, L. Rydberg, M. Rouault, J. Lutjeharms, Climatology and Landfall of Tropical Cyclones in the South- West Indian Ocean, West. Indian Ocean J. Mar. Sci. 8 (2010). doi:10.4314/wiojms.v8i1.56672.
21
to cyclones, Singap. J. Trop. Geogr. 33 (2012) 320–334. doi:10.1111/sjtg.12000. [45] C.J. Matyas, Tropical cyclone formation and motion in the Mozambique Channel, Int. J.
Climatol. 35 (2015) 375–390. doi:10.1002/joc.3985.
[46] K. Asante, R. Brito, G. Brundrit, P. Epstein, A. Fernandes, M. M.R., et al., Main Report: INGC Climate Change Report: Study on the impact of climate change on disaster risk in
Mozambique, (2009) 55.
http://www.mz.undp.org/content/mozambique/en/home/library/environment_energy/stud y_on_the_impact_of_climate_change_on_disaster_risk_management.html.
[47] H. Motta, M. Pereira, M. Gonçalves, T. Ridgway, M. Schleyer, Coral reef monitoring in Mozambique. II: 2000 report. MICOA/CORDIO/ORI/WWF, (2002) 31.
[48] J. Palalane, M. Larson, H. Hanson, D. Juízo, Coastal Erosion in Mozambique: Governing Processes and Remedial Measures, http://dx.doi.org/10.2112/JCOASTRES-D-14-00020.1. (2016).
[49] M.E. Moreira, A dinâmica dos sistemas litorais do Sul de Moçambique durante os últimos 30 anos, Finisterra. 40 (2005). doi:10.18055/FINIS1495.
[50] J.V.Q. Langa, Problemas na zona costeira de Moçambique com ênfase para a costa de Maputo, Rev. Gestão Costeira Integr. 7 (2007) 33–44. doi:10.5894/rgci8.
[51] E.A. Massuanganhe, C. Macamo, L.-O. Westerberg, S. Bandeira, A. Mavume, E. Ribeiro, Deltaic coasts under climate-related catastrophic events – Insights from the Save River delta, Mozambique, Ocean Coast. Manag. 116 (2015) 331–340.
doi:10.1016/j.ocecoaman.2015.08.008.
[52] H. Tallis, T. Rickets, A. Guerry, S. Wood, R. Sharp, E. Nelson, et al., InVEST 3.1.1 User’s Guide: Integrated Valuation of Environmental Services and Tradeoffs. The Natural Capital Project, (2015).
http://ncp-dev.stanford.edu/~dataportal/invest-releases/documentation/current_release/.
[53] M.G. Chung, H. Kang, S.-U. Choi, Assessment of Coastal Ecosystem Services for Conservation Strategies in South Korea, PLoS One. 10 (2015) e0133856.
doi:10.1371/journal.pone.0133856.
[54] T. Hopper, M.S. Meixler, Modeling Coastal Vulnerability through Space and Time, PLoS One. 11 (2016) e0163495. doi:10.1371/journal.pone.0163495.
22
[55] E.B. Barbier, The protective service of mangrove ecosystems: A review of valuation methods, Mar. Pollut. Bull. 109 (2016) 676–681. doi:10.1016/j.marpolbul.2016.01.033.
[56] B.T. van Zanten, P.J.H. van Beukering, A.J. Wagtendonk, Coastal protection by coral reefs: A framework for spatial assessment and economic valuation, Ocean Coast. Manag. 96 (2014) 94–103. doi:10.1016/j.ocecoaman.2014.05.001.
[57] M.B.S.F. Costa, M. Araújo, T.C.M. Araújo, E. Siegle, Influence of reef geometry on wave attenuation on a Brazilian coral reef, Geomorphology. 253 (2016) 318–327.
doi:10.1016/j.geomorph.2015.11.001.
[58] M.E. Hanley, S.P.G. Hoggart, D.J. Simmonds, A. Bichot, M.A. Colangelo, F. Bozzeda, et al., Shifting sands? Coastal protection by sand banks, beaches and dunes, Coast. Eng. 87 (2014) 136–146. doi:10.1016/j.coastaleng.2013.10.020.
[59] J.P. Doody, Sand Dune Conservation, Management and Restoration, Springer Netherlands,
Dordrecht, 2013. doi:10.1007/978-94-007-4731-9. [60] ESRI, ArcGIS, (2014). www.esri.com.
[61] NOAA, Global Self-consistent, Hierarchical, High-resolution Geography Database (GSHHG), National Oceanic and Atmospheric Administration, Natl. Ocean. Atmos. Adm. (2015). http://www.ngdc.noaa.gov/mgg/shorelines/ (accessed March 3, 2016).
[62] NASA/METI, ASTER Global DEM data (GDEM V2), (2012). http://earthexplorer.usgs.gov/.
[63] H.L. Tolman, User Manual and System Documentation of WAVEWATCH III version 3.14
Technical Note, 2009.
[64] GEBCO, General Bathymetric Chart of the Oceans (GEBCO), (2014). http://www.gebco.net/. [65] CIESIN, Center for International Earth Science Information Network (CIESIN), Columbia
University; and Centro Internacional de Agricultura Tropical (CIAT). Gridded Population of the World Version 3 (GPWv3). Palisades, NY: Socioeconomic Data and Applications Center, (2005). doi:http://sedac.ciesin.columbia.edu/plue/gpw.
[66] OECD, Investment Policy Reviews: Mozambique, (2013) 29.
https://www.oecd.org/daf/inv/investment-policy/IPR-Mozambique-Oct2013-Summary.pdf. [67] C.C.F. Macamo, E. Massuanganhe, D.K. Nicolau, S.O. Bandeira, J.B. Adams, Mangrove’s
response to cyclone Eline (2000): What is happening 14 years later, Aquat. Bot. 134 (2016) 10–17. doi:10.1016/j.aquabot.2016.05.004.
23
[68] A. Fekete, Validation of a social vulnerability index in context to river-floods in Germany, Nat. Hazards Earth Syst. Sci. 9 (2009) 393–403. www.nat-hazards-earth-syst-sci.net/9/393/2009/ (accessed August 11, 2016).
[69] V.N. Martins, P. Cabral, D. Sousa e Silva, Urban modelling for seismic prone areas: the case study of Vila Franca do Campo (Azores Archipelago, Portugal), Nat. Hazards Earth Syst. Sci. 12 (2012) 2731–2741. doi:10.5194/nhess-12-2731-2012.
[70] C.J. Matyas, J.A. Silva, Extreme weather and economic well-being in rural Mozambique, Nat. Hazards. 66 (2013) 31–49. doi:10.1007/s11069-011-0064-6.
[71] N. Viana, Coping with floods: Mozambique and Britain, Contemp. Rev. 290 (2008) 493. http://connection.ebscohost.com/c/articles/36321574/coping-floods-mozambique-britain.

![Table 2 Coastal climate events causing damage and/or loss and human casualties between 1975 and 2015 (Source: Desinventar Database, 2016 [32])](https://thumb-eu.123doks.com/thumbv2/123dok_br/19176378.943378/13.892.97.731.198.382/table-coastal-climate-causing-casualties-source-desinventar-database.webp)
