Fitting nonlinear autoregressive models to describe coffee seed germination
Ajuste de modelos não lineares autorregressivos na descrição da germinação se sementes de café
Iábita Fabiana SousaI Johan Eugen Kunzle NetoII Joel Augusto MunizIII
Renato Mendes GuimarãesII Taciana Villela SavianI Fabiana Rezende MunizI ISSN 0103-8478
ABSTRACT
Cumulative germination of coffee has a longitudinal behavior mathematically characterized by a sigmoidal model. In the seed germination evaluation, the study of the germination curve may contribute to better understanding of this process. The aim of this study was to evaluate the goodness of fi t of Logistic and Gompertz models, with independent and fi rst-order autoregressive errors structure, AR (1), in the description of coffee (Coffea arabica L.) line Catuai vermelho IAC 99 germination, at fi ve different potential germination. The data used were from an experiment conducted in 2011 at the Seed Analysis Laboratory of the Federal University of Lavras. The Logistic and Gompertz nonlinear models were appropriately adjusted to the percentage germination data. The Gompertz model with fi rst-order autoregressive errors structure was the best to describe the germination process.
Key words: growth models, Autocorrelated errors, Nonlinear regression, Germination potential, Regression and correlation.
RESUMO
A germinação acumulada de sementes de café tem um comportamento longitudinal matematicamente caracterizado por um modelo sigmoidal. Na avaliação de sementes, o estudo da curva de germinação pode contribuir para melhor entendimento de tal processo. O objetivo deste estudo foi avaliar a qualidade do ajuste dos modelos Logístico e Gompertz, com estrutura de erros independentes e autorregressivos de primeira ordem, AR(1), na descrição de germinação de sementes de café (Coffea arabica L.), linhagem Catuaí vermelho IAC 99, em cinco diferentes potenciais de germinação. Os dados utilizados foram provenientes de um experimento conduzido no ano de 2011 no Laboratório de Análises de Sementes da Universidade Federal de Lavras. Os modelos não lineares Logístico e Gompertz se ajustaram adequadamente aos dados de porcentagem de germinação acumulada. O modelo
Gompertz com estrutura de erros autorregressivos de primeira ordem apresentou-se como o melhor para descrever o processo germinativo ao longo do tempo.
Palavras-chave: modelos de crescimento, erros autocorrelacionados, regressão não linear, potencial de germinação, regressão e correlação.
INTRODUCTION
Seed germination is a sequence of
physiological events infl uenced by external and
internal factors, where each factor can act by itself or in interaction with others (NASSIF et al., 1998; FLORIANO, 2004). The cumulative germination of seeds, as well as other biological phenomena, generally has a longitudinal behavior mathematically characterized by a sigmoidal model. It has an increasing function at early stages of development and then an increase of lesser intensity, which sometimes
shows stability. The identifi cation and separation of
these phases become important since each phase can have different biological interpretations (MAZZINI et al., 2003; TERRA et al., 2010).
Sigmoidal curves, also known as growth models, have wide application in agricultural research (MENDES et al., 2008; TERRA et al., 2010; DERAKHSHAN & GHEREKHLOO, 2013) and can be evaluated by means of nonlinear models,
IEscola Superior de Agricultura Luiz de Queiroz (ESALQ), Universidade de São Paulo (USP), Piracicaba, SP, Brasil. IIUniversidade Federal de Lavras (UFLA), Lavras, MG, Brasil.
wich operates through data modelling by a nonlinear combination of parameters depending on one or more independent variables. Several models have been proposed for modeling growth curves, such as Logistic, Gompertz, Von Bertalanffy, Richards and Weibull (RATKOWSKY, 1983; ESPIGOLAN et al., 2013). In
many cases these models have their specifi c functional
form according to the treated problem, related to some
mechanism inherent to the specifi c process.
Nonlinear Logistic and Gompertz models are suitable for the description of seed germination, since they estimate the maximum percentage of accumulated germination (GASPAR-OLIVEIRA et al., 2008; TOMAZ et al., 2010), the time and the speed to achieve the maximum germination potential
and have good fi t.
In studies of germination curves some important statistical assumptions must be taken into consideration, such as the variance heterogeneity of seed germination in time course and the existence
of autocorrelation between the residuals of the fi t.
Therefore, the failure to consider the assumptions associated with the model can lead to biased estimates and underestimation of the parameters variances.
The present research aimed to evaluate
the goodness of fi t of the Logistic and Gompertz
nonlinear models, to data of seed germination of C.
arabica cultivar ‘Catuaí vermelho IAC 99’, across a range of germination rates.
MATERIAL AND METHODS
The research was conducted from September 6th to October 6th, 2011, in the Seed
Analysis Laboratory (LAS) of the Department of Agriculture (DAG), Federal University of Lavras (UFLA), in Lavras, MG. Five lots (I-V) of coffee were used, with minimum germination potential of 73%, 88%, 90%, 90% and 97%, respectively. The intention was to work with different potentials to examine whether these parameters affect germination curves. Each treatment consisted of four replicates of 100 seeds each, using paper towel rolls (germitest) as substrate, moistened with distilled water in the ratio of 2.5 times the weight of the dry paper, placed in germination chamber at 30ºC (MAPA, 2009). Seed germination was monitored each day for 30 days, using root protrusion as the criterion of germination.
Logistic (M1) and (M2) and Gompertz (M3) and (M4) nonlinear models, with independent
and autoregressive errors of fi rst-order AR (1), were fi tted to the percentage germination data, respectively,
expressed as follow (SEBER & WILD, 1989).
(1
1
[ (
)]
(2)
[ (
)]
t t
t t t
Y
u
exp
X
Y
u
exp
X
1 ([ ( ( ))] 3)
[ ( ( ))] (4)
t t t
t t t t
Y exp exp X u
Y exp exp X u
where:
t
Y
- cumulative germination percentage at time t; - represents the highest cumulative germination percentage, stabilizing value of Y with respect to timet; - time at which
Y
reaches half of its maximumvalue at the Logistic model and approximately 37%
of its maximum value at the Gompertz model; γ -
growth rate, which represents the germination rate to reach the asymptotic value;
exp
- base of the neperian logarithm;X
t - time required for seeds germination, given in days,t
1, 2,3,...,30;
u
t - residue at time t;u
t1- residue at time t-1; - thefi rst-order autoregressive parameter; t - white noise
of the Normal distribution N~(0,σ2), for independent
errors structure t=
u
t.Parameter estimates of nonlinear models (with and without autoregressive error) were obtained using the generalized least squares method, considering the variance heterogeneity and/or residual auto-correlation (HOFFMAN & VIEIRA, 1998; MAZZINI et al., 2005). The least squares estimates of the parameters were obtained using the Gauss-Newton iterative method and
performing residual regression by fi rst derivatives
of nonlinear model parameters, until convergence was achieved (SAVIAN & MUNIZ, 2007). The most parsimonious model to describe germination
was identifi ed using the accuracy of adjustments
according to the following criteria (ZEVIANI et
al., 2012): adjusted coeffi cient of determination
(R2
aj) - the larger was the value of R 2
aj, better was
the model; Residual Standard Deviation (RSD)
- the lower was the RSD, better was the fi tted
model; the Akaike’s Information Criterion (AIC); the Bayesian Information Criterion (BIC); and Likelihood Ratio Test (LRT). After adjustment of Logistic and Gompertz models, the residues analysis was proceeded based on the statistics of Shapiro-Wilk test for normality, and Dubin-Watson
for error independence, adopting a signifi cance
Residual analysis was performed through statistical tests. The adjustment procedures for models with independent and correlated error structures were implemented using gnls function (adequacy
of the linear model using generalized least squares) of the nlme package (linear and nonlinear models
of mixed effects) in the R program (version 2.13.1) (PINHEIRO et al., 2014). For the residues analysis of nonlinear regression, methods that can be adjusted in R were used as the gradient matrix of the model set in the function lm. Initial values were obtained using
an iterative graphical method to initial values in a nonlinear regression.
RESULTS AND DISCUSSION
It was found in all analyzed lots the lack of normality (P<0.003) and in some situations such as
fi tting the Logistic model for seeds of lot I (P<0.001)
and the Gompertz model for seeds of lots I, II, III and IV (P<0.004), was also checked the violation of the assumption of residual independence, indicating the need for appropriate corrective actions to validate the
fi tted models.
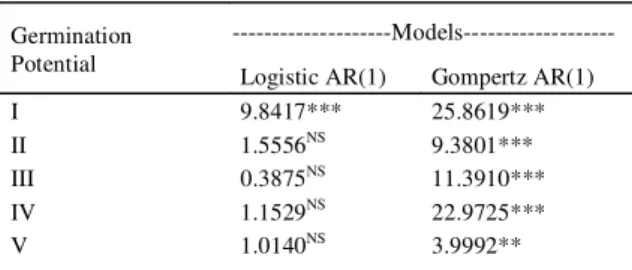
In the study of nonlinear models that describe plant growth it is quite reasonable to incorporate autocorrelation, given that the growth measures are taken in the same experimental unit. PRADO et al. (2013), in a study on the adjustment of Logistic and Gompertz models on fruit growth data of dwarf coconut identified residual autocorrelation for both variables analyzed and, when considering the autoregressive process for the modeling, it was obtained more precise estimates. PEREIRA et al. (2005), in a study on the prediction of mineralized nitrogen in oxisol by using nonlinear models, incorporated the residual autocorrelation and found more precise parameters estimates. MAZZINI et al. (2005) and MENDES et al. (2008) analyzing growth of beef cattle, and GUEDES et al. (2004) evaluating averaged data of lambs, observed a higher goodness of fit for models that incorporated autoregressive parameters. After implementation of appropriate corrective measures, a new estimation was done following a new residual diagnosis with normal distribution. In table 1, the statistic of the maximum likelihood ratio test is presented for Logistic and Gompertz models. For the logistic model, only for lot I, LRT identified a best fit to the data, considering the correlated residues AR (1). However with the Gompertz model in all lots, the best fit presented structure of errors AR (1).
The Gompertz model with structure of
errors AR (1) showed a better fi t to the data, evidenced
by lower values for the criteria RSD, AIC and BIC.
The adjusted coeffi cients of determination (R2 aj)
showed similar results, all above 99%, not satisfi ed
the choice of the best model by this statistic (Table 2). The seeds lots showed similar highest
cumulative germination percentage (α), being all
estimates above 90% (Table 3). With the exception of lot V, the estimated percentages were superior to the
minimum percentages used in the classifi cation of the
lots, with the largest difference found for lot I, which the minimum percentage of germination was 73% and in fact germinated 93.23%, with an increase of 27.6%. Lots III and IV had equal minimum percentage of germination and differed slightly, with a small
advantage for Lot IV. The parameter (β) is related
to the day that accumulated germination reaches approximately 40% of the maximum cumulative germination. Lot V obtained the shortest time to reach the germination potential, which may be related to
the high power of seeds germination. Parameter (γ),
representing the speed of germination, had on lot V the highest estimated value, which indicates that the cumulative germination percentage was reached in a shorter time than the other qualities studied. Estimates of the standard errors of the parameters
(α, β, γ) decreased signifi cantly when considering
the autoregressive process. On lot I, for example, the decrease ranged around 37%, 45% and 41%, respectively. Similar results were presented by PRADO et al.(2013), MELO et al.(2011) andMENDES et al. (2008), who considered the autoregressive structure and obtained more precise estimates.
Regarding the fi rst order autoregressive
parameter ( 1), the error associated with the seeds germination rate on a date is negatively correlated with the error of the earlier date. AGR were increased until Table 1 - Statistics of the Likelihood Ratio Test (LRT) for
Logistic and Gompetz models, with errors structure AR (1), in lots of different germination potential.
---Models---Germination
Potential Logistic AR(1) Gompertz AR(1)
I 9.8417*** 25.8619***
II 1.5556NS 9.3801***
III 0.3875NS 11.3910***
IV 1.1529NS 22.9725***
V 1.0140NS 3.9992**
reaching the maximum of 28% day-1 for lot I, about 21%
day-1 for lot II, 23% day-1 for lot III, 26% day-1 for lot IV
and 35% day-1 for lot V. At this stage, the germination
rate was high and positive, reaching a maximum at
the infl ection point of the curve, which occurred near
the 9th day. From this point, the concavity of the curve
changes and the germination rate starts to decrease exponentially due to factors that gradually inhibit the germination. It is noted that lot V, characterized as the best germination potential, had a shorter time
for germination process, since in the thirteenth day virtually all the seeds had already germinated (Figure 1). In general, these results corroborate with EIRA et al. (2006), about the physiology and germination of coffee seed, in which on the tenth day 50% of coffee
seeds showed root protrusion, and on the fi fteenth day
most seeds have already germinated.
It was noted that both models adequately describe seed germination, with curves very close to the observed values, but highlighting the Gompertz model considering the structure of autocorrelated errors of order 1 (Figure 2).
CONCLUSION
Germination of coffee is described by Logistic and Gompertz nonlinear models, presenting adequate biological interpretation of the parameters.
Gompertz model with fi rst-order autoregressive errors structure fi ts more appropriately to describe
the percentage of cumulative germination of coffee seeds, when compared to the Logistic model, being the most suitable model. According to the adjustment, germination phases over time were well established. Table 3 - Parameters estimates for fitting Gompertz model, with
structures of autoregressive first-order errors, to the seed percentage germination data for the five lots.
Lost ---Parameters---
ϕ1
I 93.23 9.69 0.85 -0.74
II 93.08 9.49 0.66 -0.51 III 96.52 10.01 0.63 -0.55 IV 95.47 9.32 0.78 -0.72
V 97.26 8.61 1.01 -0.39
Table 2 - Estimates of selection criteria: adjusted coefficient of determination (R2
aj), residual standard deviation (RSD), Akaike’s information
criterion (AIC) and Bayesian Information Criterion (BIC) for the adjusted models.
---Selection
Criteria---Lots Models
R2
aj RSD AIC BIC
Logistic 0.99995 2.1329 135.4249 141.0297
Gompertz 0.99998 2.1422 135.6855 141.2903
Logistic AR(1) 0.99995 2.1122 127.5831 134.5891
I
Gompertz AR(1) 0.99999 2.0609 111.8236 118.8296
Logistic 0.99975 2.3135 140.3023 145.9071
Gompertz 0.99999 1.4631 112.8095 118.4143
Logistic AR(1) 0.99968 2.3187 140.7467 145.7527
II
Gompertz AR(1) 0.99999 1.4477 105.4295 112.4355
Logistic 0.99974 2.7985 151.7209 157.3257
Gompertz 0.99999 2.0910 134.2351 139.8399
Logistic AR(1) 0.99978 2.7977 153.3334 160.3394
III
Gompertz AR(1) 0.99999 2.0613 124.8441 131.8500
Logistic 0.99986 1.9117 128.8573 134.4651
Gompertz 0.99999 1.3780 109.2151 114.8199
Logistic AR(1) 0.99987 1.9111 130.1595 137.1655
IV
Gompertz AR(1) 0.99999 1.3119 882.426 952.486
Logistic 0.99991 1.4915 113.9644 119.5692
Gompertz 0.99999 0.6221 615.024 671.077
Logistic AR(1) 0.99965 2.0397 114.9503 121.9563
V
Figure 1 - Representative histogram of absolute germination rate (AGR) of coffee seeds estimated by the Gompertz function in the fi ve
seed lots.
ACKNOWLEDGEMENTS
Thanks to Coordenação de Aperfeiçoamento de Pessoal de Nível Superior (CAPES) and Universidade Federal de
Lavras (UFLA) for fi nancial and technical supports.
REFERENCES
DERAKHSHAN, A.; GHEREKHLOO, J. Factors affecting
Cyperus difformis seed germination and seedling emergence. Planta daninha, Viçosa, v.31, n.4, p.823-832, 2013. Available from: <http://www.scielo.br/scielo.php?pid=S0100-835820130004 00008&script=sci_arttext> Accessed: Dec. 20, 2013. doi: 10.1590/ S0100-83582013000400008.
EIRA, M.T. et al. Coffee seed physiology. Brazilian Journal of Plant Physiology, Londrina, v.18, n.1, p.149-163, 2006. Available from: <http://www.scielo.br/scielo.php?script=sciarttext&pid=S167 704202006000100011>. Accessed: Dec. 18, 2011. doi: 10.1590/ S1677-04202006000100011.
ESPIGOLAN, R. et al. Aplicação de modelos não lineares para descrever a evolução de características de crescimento e carcaça em bovinos da raça Hereford. Ciência Rural, Santa Maria, v.43, n.3 p.513-519, 2013. Available from: <http://www.scielo.br/scielo. php?script=sci_arttext&pid=S0103-84782013000300023&lng= pt&nrm=iso&tlng=en>. Accessed: Jan. 18, 2013. doi: 10.1590/ S0103-84782013005000011.
FLORIANO, E.P. Germinação e dormência de sementes fl orestais. Santa Rosa: ANORGS, 2004. 19p. (Caderno didático n.2).
GASPAR-OLIVEIRA, C.M. et al. Duração do teste de germinação de Brachiaria brizantha cv. ‘marandu’ (Hochst. ex A. Rich.) Stapf. Revista Brasileira de Sementes, Londrina, v.30, n.3, p.30-38, 2008. Available from: <http://www.scielo.br/pdf/rbs/ v30n3/05.pdf>. Accessed: Dec. 18, 2013. doi: 10.1590/S0101-31222008000300019.
GUEDES, M.H.P. et al. Estudo das curvas de crescimento de cordeiros das raças Santas Inês e Bergamácia: considerando heterogeneidade de variâncias. Ciência e Agrotecnologia, Lavras, v.28, n.2, p.381-388, 2004. Available from: <http://www.scielo. br/pdf/cagro/v28n2/a19.pdf>. Accessed: Dec. 18, 2013. doi: 10.1590/S1413-70542004000200019.
HOFFMAN, R.; VIEIRA, S. Análise de regressão: uma introdução à econometria. São Paulo: HUCITEC, 1998. 379p.
MAPA. MINISTÉRIO DA AGRICULTURA PECUÁRIA E ABASTECIMENTO. Regras para análise de sementes. Brasília: Secretaria de Defesa Agropecuária, Mapa, 2009. 398p.
MAZZINI, A.R. de A. et al. Curva de crescimento de novilhos Hereford: heterocedasticidade e resíduos autorregressivos. Ciência Rural, Santa Maria, v.35, p.422-427, 2005. Available from: <http://www.scielo.br/scielo.php?pid=S0103847820050002000 28&script=sci_arttext>. Accessed: Jan. 18, 2012. doi: 10.1590/ S0103-84782005000200028.
MAZZINI, A.R. de A. et al. Análise da curva de crescimento de machos Hereford. Ciênciae Agrotecnologia, Lavras, v.27, n.5, p.1105-1112, 2003. Available from: <http://www.scielo.br/ scielo.php?script=sci_arttext&pid=S1413-70542003000500019>. Accessed: Jan. 21, 2012. doi: 10.1590/S1413-70542003000500019.
MELO, A.L.P. et al. Identifi cação e modelagem da autocorrelação
residual no ajuste do modelo de Wood às curvas de lactação de cabras. CiênciaRural, Santa Maria, v.41, n.10, p.1818-1822, 2011. Available from: <http://www.readcube.com/articles/10.1590/ S0103-84782011001000024?locale=en>. Accessed: Jan. 03, 2014.
MENDES, P.N. et al. Modelo logístico difásico no estudo do crescimento de fêmeas da raça Hereford. Ciência Rural, Santa Maria, v.38, n.7, p.1984-1990, 2008. Available from: <http://www.scielo.br/scielo.php?pid=S0103-847820080 00700029&script=sci_abstract&tlng=pt>. Accessed: Jan. 21, 2012. doi: 10.1590/S0103-84782008000700029.
NASSIF, S.M.L. et al. Fatores externos (ambientais) que
infl uenciam na germinação de sementes. Informativo Sementes IPEF - Abril 1998. Available from: <http://www.ipef.br/
tecsementes/ger minacao.asp>. Accessed: Jun. 17, 2013.
PEREIRA, J.M. et al. Nonlinear models to predict nitrogen mineralization in an Oxisol. Scientia Agricola, Piracicaba, v.62, n.4, p.395-400, 2005. Available from: <http://www.scielo.br/ scielo.php?pid=S010390162005000400014&script=sci_arttext>. Accessed: Nov. 22, 2011. doi: 10.1590/S0103-90162005000400014.
PINHEIRO, J.C. et al. nlme: linear and nonlinear mixed effects models. Vienna: R Development Core Team, 2014. 335p.
PRADO, T.K.L. do et al. Ajuste dos modelos Gompertz e Logístico aos dados de crescimento de frutos de coqueiro anão verde. Ciência Rural, Santa Maria v.43, n.5, p.803-809, 2013. Available from: <http://www.scielo.br/pdf/cr/2013nahead/a13313cr5976.pdf>. Accessed: May 22, 2013. doi: 10.1590/S0103-84782013005000044.
RATKOWSKY, D.A. Nonlinear regression modeling: A unifi ed
practical approach. New York, Marcel Dekker, 1983. 276p.
SAVIAN, T.V.; MUNIZ, J.A. A study of in situ degradability: heterogeneity of variances and correlated errors. Scientia Agricola, Piracicaba, v.64, n.5, p.548-554, 2007. Available from: <http://www.scielo.br/scielo.php?script=sci_arttext&pid =S0103-90162007000500013>. Accessed: Nov. 05, 2011. doi: 10.1590/S0103-90162007000500013.
SEBER, G.A.F.; WILD, C.J. Nonlinear regression. New York: John Wiley, 1989. 792p.
TERRA, M.F. et al. Ajuste dos modelos Logístico e Gompertz aos dados de crescimento de frutos da tamareira-anã (Phoenix roebelenii
O’BRIEN). Magistra, Cruz das Almas, v.22, n.1, p.01-07, 2010. Available from: <http://pt.scribd.com/doc/92170015/1-Ajuste-Dos- Modelos-Logstico-e-Gompertz-Aos-Dados-de-Crescimento-de-Frutos-Da-Tamareira-An-Phoenix-Roebelenii-Obrien>. Accessed: Jan. 03, 2014. doi: 10.1590/S0103-84782013005000044.
TOMAZ, C.A. et al. Duração do teste de germinação do capim-tanzânia. Revista Brasileira de Sementes, Londrina, v.32, n.4,
p.80-87, 2010. Available from: <http://www.scielo.br/pdf/rbs/ v32n4/09.pdf>. Accessed: Jan. 03, 2014. doi: 10.1590/S0101-31222010000400009.