doi:10.1590/0037-8682-0138-2016
Short Communication
Corresponding author:Prof. Edson Zangiacomi Martinez. e-mail: [email protected]
Received 15 April 2016 Accepted 9 June 2016
Incidence of snakebites from 2007 to 2014 in the
State of São Paulo, Southeast Brazil, using a
Bayesian time series model
Davi Casale Aragon
[1],[2], José André Mota de Queiroz
[2],[3]and Edson Zangiacomi Martinez
[2][1]. Departamento de Puericultura e Pediatria, Faculdade de Medicina de Ribeirão Preto, Universidade de São Paulo, Ribeirão Preto, São Paulo, Brasil. [2]. Departamento de Medicina Social, Faculdade de Medicina de Ribeirão Preto, Universidade de São Paulo, Ribeirão Preto, São Paulo, Brasil.
[3]. Departamento de Estatística, Universidade Estadual de Maringá, Maringá, Paraná, Brasil.
Abstract
Introduction: The monthly incidence of snakebites from 2007 to 2014 in the State of São Paulo, Brazil, was assessed. Methods:
A statistical model based on the discrete double Poisson distribution was proposed, including pairs of sine and cosine functions of time to account for seasonality and autoregressive terms. Results: The analysis indicated a slight increase in the incidence of snakebites.The inclusion of two pairs of trigonometric functions seemed to be relevant in the model adjustment, given the seasonal pattern of the data. Conclusions: The snakebites occurred predominantly during the warm season, from November to April.
Keywords: Snakes.Time series. Poisonous animals.
Accidents associated with venomous snakes are a public health concern in several areas of Brazil(1). Official data
suggest that approximately 26,000 snakebites occur each year in Brazil(2), although this number could be underestimated
due to inadequacies in data collection and the large number of unreported cases(2). Diffi culties in accessing health services
could also contribute to the underreporting of snakebites(3).
Information systems with a good performance are needed for adequate surveillance of the number of accidents per geographical region, types of venom, and the consequences of the bites(2). Records of these accidents are useful to reduce the
incidence by promoting health education and to decrease their severity, frequency of sequelae, and lethality(4).
The State of São Paulo is the most populous in Brazil, with a high concentration of industrial, agricultural, and commercial activities. Two important biomes of the state are the Cerrado (Brazilian savannah) and the Atlantic forest (wet forest), although the expansion of agricultural and pasturelands has drastically reduced the areas of native vegetation. According to the Köppen-Geiger classifi cation, São Paulo has seven distinct climatic types, but the predominant is the type Cwa, which is characterized by a tropical climate, with rains in the
summer and droughts in the winter. The venomous snakes that occur in this region belong to three genera: Bothrops, Crotalus, and Micrurus(5). Bothrops snakebites are the most commonly
recorded, which refl ects the capacity of these snakes to adapt to a range of environments(3). In the State of São Paulo, there are
no snakes of the genus Lachesis in nature(6). In addition, bites
by coral snakes (Micrurus spp.) are uncommon in the region(7).
The present ecological study analyzed 14,419 snakebites that occurred in the State of São Paulo, Southeast Brazil, between January 2007 and December 2014. The data were obtained from the Brazilian Informatics Department of the Unifi ed Health System [Departamento de Informática do Sistema Único de Saúde (DATASUS); http://tabnet.datasus.gov.br]. During this period, 9,414 accidents were attributed to Bothrops snakes, 1,570 to Crotalus snakes, 177 to Micrurus snakes, and 1,167 to nonpoisonous snakes. Furthermore, a large number of reports were of bites from unidentifi ed species of snakes (2,268 records).
TABLE 1
Distribution of snakebites reported in the State of São Paulo, Brazil between 2007 and 2014*.
Snakes
Bothrops Crotalus Micrurus nonpoisonous snakes unidentifi ed snakes
(%) (%) (%) (%) (%)
Sex
men 78.4 81.6 74.2 68.9 76.1
women 21.6 18.4 25.8 31.1 23.9
Age group (years)
<1 0.9 0.6 0.6 1.5 1.4
1–4 1.7 1.5 4.5 4.1 3.2
5–9 4.4 2.6 5.6 6.3 3.8
10–14 6.6 5.3 4.5 7.9 8.7
15–19 7.3 5.1 9.0 7.7 8.6
20–39 32.1 35.9 41.2 35.6 34.3
40–59 33.5 35.1 28.8 28.7 28.0
60–64 5.5 6.0 4.0 3.9 4.9
65–69 3.6 3.7 - 1.9 3.0
70–79 3.6 3.3 1.1 1.9 3.3
≥80 0.9 0.9 0.6 0.5 0.8
*Snakebites reported in the State of São Paulo, Brazil between 2007 and 2014 distributed by each genus of snake according to the sex and age groups of the victims.
in urban areas(9). Individuals aged between 1 and 9 years were
more exposed to bites from Micrurus snakes (Table 1), probably because these snakes have a pattern of colored rings that attract the attention of children who are unaware of the danger(9) (10).
As a secondary objective, we introduced a Bayesian time series model that described the behavior of the time series, including seasonal and autoregressive terms. This model, expressed in a general form, considers that the number yt of snakebites at each month t follows a double Poisson (DP) distribution(11) with log-mean given by
where β0 is a constant, β1 describes a linear trend over time, St
is a period function that refl ects the full seasonal cycle over T
time units, given by
J is the number of pairs of sine and cosine functions, ηj1 and ηj2
are unknown parameters to be estimated, γk is the autoregressive
term of the order p, and y is the mean number of snakebites in the period. Considering an annual seasonality pattern, we set T = 12 months. An extension of the model to incorporate possible covariates can be obtained to include additive terms in the expression for log(μt) . The DP distribution, introduced by Efron(11), is useful for modeling count data that exhibits
underdispersion or extra-Poisson variation. The well-known Poisson distribution can be understood as a specifi c case of the DP distribution.
The Bayesian estimation(12) was undertaken in OpenBUGS
software version 3.2.2, using Markov Chain Monte Carlo
(MCMC) methods of simulation and considering non-informative prior distributions for all parameters of the model. In this way, a vague prior normal distribution with a mean value of zero and a variance of 105 was assigned to the parameters β
0, β1,
η11, η12, η21 and η22, and a prior uniform on (-1,1) to the parameter
γ1. In order to eliminate the effect of the initial values, the fi rst
1,000 iterations were discarded. After this burn-in period, another 500,000 samples were generated, from which every 10th sample was taken, in order to avoid correlation between
successive samples. Further information on the MCMC methods can be found in textbooks, as for example, Gilks et al.(13).
A number of models were fi t to the data for each genus of snakes, considering different values to the order p of the autoregressive components, and to the number J of pairs of sine and cosine functions in St. The deviance information criterion (DIC) was used to compare the different results(14). The DIC
value can be estimated using the MCMC output, and models with the lowest DIC values are those that best fi t the data. In all cases, models based on the DP distribution provided a better fi t to the data, as compared with similar models based on the Poisson distribution.
Table 2 shows the parameter estimates and their respective 95% credible intervals (95% CI) for the time series models considering the counts of bites by each genus. Bites from Micrurus snakes were excluded from the analysis due to their small number. If the associated 95% CIs do not include the value of 1, a statistically signifi cant effect can be assumed. The models with the lowest DIC values considered two pairs of sine and cosine functions (J=2) and one autoregressive term (p=1). In addition, correlograms (not shown) suggested that the residuals for the models were not correlated. Notably, in all fi ts, the time
log(��) =�0+�1�+��+� ��(��−�− ��),
�
�=1
�� ∑��=1���1sin�2���� �+��2cos�2���� ��
log(��) =�0+�1�+�� � �� ��−�− ��
�
�=1
(A) Bothrops 0 50 100 150 200 Jan 2007 Jan 2008 Jan 2009 Jan 2010 Jan 2011 Jan 2012 Jan 2013 Jan 2014 Jan 2015 l l l l l l l l l
l l ll l l
l
l ll
l l
lll l l l l l ll l l l l l l l l l l ll l l ll l l l
l l l ll l l
l l l l l l l l ll l l
l l l l l l l l ll l l l l l
l l l
l l l l l l l l Observed values Predicted values (B) Crotalus 0 1 0 20 30 4 0 50 Jan 2007 Jan 2008 Jan 2009 Jan 2010 Jan 2011 Jan 2012 Jan 2013 Jan 2014 Jan 2015 lll
l l l ll
l l l l lll
l l l ll
l l l l l
l l
l ll l
ll l l l l
l l
l l l ll
l l ll lll
l lll
l l l ll
l l
l
l
l l l l
l l ll lll
l
l ll
l l l l
l l
l l
l
l l l l
l l l Observed values
Predicted values
(C) Nonpoisonous snakes
0 1 0 20 30 4 0 50 Jan 2007 Jan 2008 Jan 2009 Jan 2010 Jan 2011 Jan 2012 Jan 2013 Jan 2014 Jan 2015 l l l l
l l ll ll
l ll ll l
l l ll
lll l l l ll l l ll
ll l l l l
l l
l l ll ll l
l l l l
l l l ll
l l ll l ll
l l l ll
ll l l l l
l l
l l ll ll l
l l l l
l ll ll
l ll Observed values
Predicted values
(D) Unidentified snakes
Number of reports
Number of reports
Number of reports
Number of reports
0 10 20 3 0 4 0 50 Jan 2007 Jan 2008 Jan 2009 Jan 2010 Jan 2011 Jan 2012 Jan 2013 Jan 2014 Jan 2015 l l l l ll l
l l
l ll l ll
l l
l l l
l ll l l ll
l l
l l l
l ll l l l
l l l l l l l
l ll l ll
l
l l l
l l
ll l l l l l l l l l l
ll l l l l l l ll l l
ll l l l l l l ll l l ll Observed values Predicted values
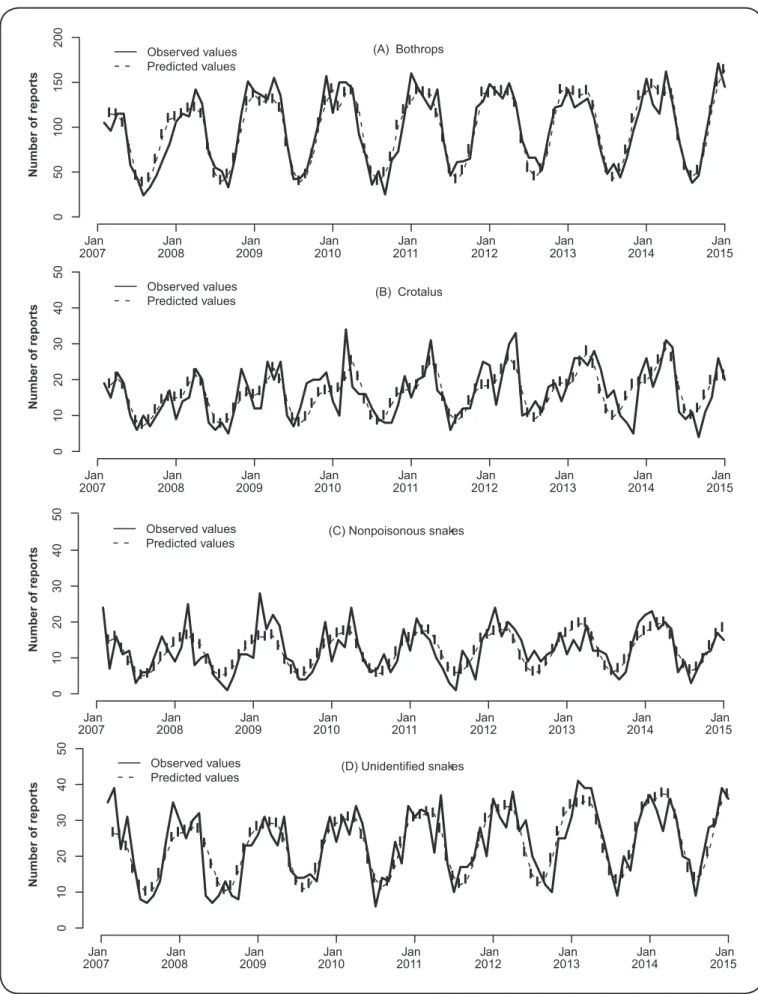
FIGURE 1. Observed and predicted values for snakebite incident data in the State of São Paulo, Brazil between 2007 and 2014. (A)Bothrops snakes. (B)Crotalus
TABLE 2
Parameter estimates (95% CIs) for the models based on the double Poisson distribution*.
Bothrops Crotalus Nonpoisonous snakes Unidentifi ed Snakes
Parameter Estimate (95% CI) Estimate (95% CI) Estimate (95% CI) Estimate (95% CI)
β0 4.417 (4.340; 4.493) 2.551 (2.417; 2.688) 6.692 (6.665; 6.719) 2.888 (2,774; 2.994)
β1 0.002 (0.0002; 0.003) 0.004 (0.001; 0.006) 0.008 (0.007; 0.009) 0.004 (0.002; 0.006)
γ1 0.003 (0.001; 0.006) 0.004 (-0.008; 0.015) 0.00008 (0.00004; 0.0001) -0.001 (-0.010; 0.008)
η11 0.216 (0.116; 0.3123) 0.288 (0.172; 0.402) 0.139 (0.124; 0.154) 0.303 (0.188; 0.416)
η12 0.415 (0.352; 0.477) 0.266 (0.174; 0.355) 0.207 (0.196; 0.217) 0.406 (0.324; 0.489)
η21 -0.165 (-0.219; -0.119) -0.136 (-0.233; -0.042) -0.031 (-0.040; -0.022) -0.130 (-0.200; -0.059)
η22 -0.100 (-0.153; -0.048) -0.167 (-0.254; -0.081) -0.083 (-0.092; -0.075) -0.063 (-0.132; 0.006)
*Parameter estimates and their respective 95% CIs for the models based on the double Poisson distribution, taking into considering the number of snakebite incidents according to each genus in the State of São Paulo, Brazil between 2007 and 2014. 95% CIs: 95% credible intervals.
series had a signifi cant and positive slope (β1>0), which is more
expressive when considering the count data of the bites by nonpoisonous snakes. This suggests that the number of accidents associated with snakes has been increasing, or that there has been more interest in reporting this type of accident. Figure 1
compares the observed and predicted values for each time series. We emphasize the importance of inserting two pairs of sine and cosine functions (at least one parameter in each pair, ηj1 and ηj2,
j = 1,2, is signifi cant) in the model to better capture the shape
of the seasonality of the series, improving the fi t compared with the use of only one pair of these functions. In all the cases, it is apparent that the majority of the snakebites occurred during the warm season, from November to April. This result is consistent with the observation that snakes are ectothermic animals that require high temperatures for thermoregulation, which is fundamental for satisfactory metabolism; thus, a higher number of accidents are likely to occur in the warmer months. In addition, the increased incidence of snakebites in the warm season might be seen as a result of the greater availability of prey during this period(15).
Notably, a relatively large number of the records did not identify the species of snake responsible for the accident, and this is a potential limitation of the present study. In addition, it is assumed that there is a considerable number of unreported cases of snakebites in Brazil(2). As soon as accurate information
becomes available, future studies could develop maps that describe the distribution of poisonous snakes and the spatial incidence of snakebites, allowing a better description of risk areas and the requirement for antivenom accessibility according to geographical area. These studies might investigate the spatial association between the incidence of snakebites and variables such as vegetation cover, agricultural practices, weather variables, altitude, and other ecological variables of interest.
Finally, as a statistical note, the proposed Bayesian model based on the DP distribution was effi cient to describe the monthly frequency of snakebite incidents in the State of São Paulo. The parameter estimation based on frequentist methods
can be challenging due to the complexity of the likelihood function, and the use of Bayesian methods is thus a reasonable alternative. This model can also be useful in studying the epidemiological time series in other contexts, when a seasonal pattern in the data and autoregressive components are observed.
Confl icts of Interest
The authors declare that there are no confl icts of interest.
Financial Support
This work has received fi nancial support from the National Counsel of Technological and Scientifi c Development [Conselho Nacional de
Desenvolvimento Científi co e Tecnológico(CNPq)], Process 305942/2012-3.
REFERENCES
1. Cupo P. Bites and stings from venomous animals: a neglected Brazilian tropical disease. Rev Soc Bras Med Trop 2015; 48: 639-641.
2. Machado C, Bochner R, Fiszon JT. Epidemiological profi le of snakebites in Rio de Janeiro, Brazil, 2001-2006. J Venom Anim Toxins Incl Trop Dis 2012; 18: 217-224.
3. Bochner R, Fiszon JT, Machado C. A profi le of snake bites in Brazil, 2001 to 2012. J Clin Toxicol 2014; 4:194.
4. Feitosa ES, Sampaio V, Sachett J, Castro DBD, Noronha MDDN, Lozano JLL, et al. Snakebites as a largely neglected problem in the Brazilian Amazon: highlights of the epidemiological trends in the State of Amazonas. Rev Soc Bras Med Trop 2015; 48 (supl I):34-41.
5. Ribeiro LA, Albuquerque MJ, Pires de Campos VAF, Katz G, Takaoka NY, Lebrão ML, et al. Obits by venomous snakes in the State of São Paulo: evaluation of 43 cases from 1988 to 1993. Rev Ass Med Bras 1998; 44:312-318.
6. Ribeiro LA, Jorge MT. Acidente por serpentes do gênero Bothrops: série de 3.139 casos. Rev Soc Bras Med Trop 1997; 30:475-480. 7. Bucaretchi F, de Capitani EM, Vieira RJ, Rodrigues CK, Zannin
Brazil: a review of literature reports. Clin Toxicol (Phila) 2016; 54: 222-234.
8. Hui Wen F, Monteiro WM, Moura da Silva AM, Tambourgi DV, Mendonça da Silva I, Sampaio VS, et al. Snakebites and scorpion stings in the Brazilian Amazon: identifying research priorities for a largely neglected problem. PLoS Negl Trop Dis 2015; 9:e0003701.
9. Mota-da-Silva AM, Bernarde PS, Abreu LC. Accidents with poisonous animals in Brazil by age and sex. J Hum Growth Dev 2015; 25: 54-62.
10. Cavazos MEO, Garza CR, Guajardo-Rodríguez G, Hernández-Montelongo BA, Montes-Tapia FD. Snake bites in pediatric patients, a current view. Complementary Pediatrics 2012; p. 123-136. DOI: 10.5772/34749.
11. Efron B. Double exponential families and their use in generalized linear regression. J Amer Statist Assoc 1986; 81:709-721.
12. Martinez EZ, Achcar JA. Trends in epidemiology in the 21st century: time to adopt Bayesian methods. Cad Saude Publica 2014; 30:703-714.
13. Gilks WR, Richardson S, Spiegelhalter D. Markov Chain Monte Carlo in Practice. London: Chapman & Hall, 1995.
14. Spiegelhalter DJ, Best NG, Carlin BP, Van der Linde A. The deviance information criterion: 12 years on (with discussion). J R Stat Soc Series B 2014; 76:485-493.