Vol. 51, n. 4 : pp.711-721, July-Aug 2008
ISSN 1516-8913 Printed in Brazil BRAZILIAN ARCHIVES OF
BIOLOGY AND TECHNOLOGY
A N I N T E R N A T I O N A L J O U R N A L
Improved Purification Process of
β
- and
α
-Trypsin Isoforms
by Ion-Exchange Chromatography
Alexandre Martins Costa Santos1*, Jamil Silvano de Oliveira1, Eustáquio Resende Bittar2,1, Anderson Lourenço da Silva1, Marcos Luiz dos Mares Guia, Marcelo Porto Bemquerer3,1 and Marcelo Matos Santoro1
1
Laboratório de Enzimologia e Físico-Química de Proteínas, (Lab. Prof. Marcos Luiz dos Mares Guia; Departamento de Bioquímica e Imunologia; Universidade Federal de Minas Gerais; ICB; Av. Antônio Carlos, 6627; [email protected]; 31270-901; Belo Horizonte - MG - Brasil. 2 Instituto de Estudos Avançados em Medicina Veterinári; Universidade de Uberaba; Uberaba - MG - Brasil. 3 Embrapa Recursos Genéticos e Biotecnologia; Parque Estação Biológica – PqEB; Av. W5 Norte (final); Brasília - DF – Brasil
ABSTRACT
The purpose of this work was to improve the separation and yield of pure β- and α-trypsin isoforms by ion- exchange chromatography and to characterize some physical–chemical properties of these isoforms. Purification of trypsin isoforms was performed by ion-exchange chromatography in 0.1 mol/L tris-HC buffer, pH 7.10 at 4oC. The sample loading, salt concentration, flow rate and pH of mobile phase were varied to determine their effects on the resolution of the separation. The resolution was optimized mainly between β- and α-trypsin. Pure isoforms were obtained by chromatographying 100 mg of commercial trypsin during seven days, yielding 51 mg of high purity β -trypsin and 13 mg of α-trypsin partially pure, with small amounts of contaminating of ψ-trypsin. Thus, time and resolution of purification were optimized yielding large amounts of pure active enzymes that are useful for several research areas and biotechnology.
Key words: Trypsin isoforms, resolution, ion-exchange chromatography, purification, specific activity, mass spectrometry
*Author for correspondence
INTRODUCTION
Trypsin is the first discovered and probably the best characterized enzyme. It has been known for more than 130 years that pancreatic juice is able to digest proteins (Graf and Szilágyi, 2003). This
protein was among the first proteolytic enzymes isolated in pure form in enough amounts for exact chemical and enzymological studies.
The structure of trypsin molecule and the mechanism of its action have been studied in
products. The content of the individual constituents is often unknown and variable, and small amounts of pure β- and α-trypsin are obtained.
Various chromatographic methods have been developed for purification of trypsin and their isoforms including ion-exchange (Schroeder and Shaw, 1968 and Gooding and Schmuck, 1983), hydrophobic interaction (Strop and Cechová, 1981), reversed-phase (Titani et al., 1982) and
affinity chromatography (Feinstein, 1970 and Chang Shiet al., 1996). The method developed by
Schroeder and Shaw (Schroeder and Shaw, 1968) using ion–exchange chromatography on SE-Sephadex at neutral pH with benzamidine in the elution buffer has proved to be the most successful and is frequently employed. Despite this previous methodology has shown to be able to separate trypsin isoforms, it presents low yield, requires a long time of purification and supplies impure isoforms with low resolution among their main peaks. In this paper we show an optimization of the methodology developed by Schroeder and Shaw by increasing the separation effectiveness of
β-and α-trypsin based on differences of salt concentrations, sample loading, flow rate and pH. Optimal conditions for analytical as well as preparative scale separations were developed.
MATERIALS AND METHODS Proteins and Chemicals
Tris(hydroxymethyl) aminomethane, benzamidine-hydrochloride, bovine trypsin type III (T8253) LOT 125HO676 EC 3.4.21.4, Nα-benzoyl-DL
-arginine-p-nitroanilide (BApNA) were purchased
from Sigma (St. Louis, MO, USA). Calcium chloride was purchased from Merck (Darmstadt, Germany). Sodium chloride and acetonitrile (HPLC grade) were purchased from Carlo Erba (Rodano, MI. Italy). Acetic acid and hydrochloride acid were purchased from Synth (Diadema, SP. Brazil). Formic acid was purchased from Reagen (Rio de Janeiro, RJ, Brazil). p-Nitro phenyl p
-guanidino benzoate-HCl (NPGB) was purchased from INC Pharmaceuticals (Cleveland, Ohio. USA). Diethylbarbituric acid (Veronal) was purchased from Riedel – De Haen
(Seelze-Hannover, Germany). SE-SEPHADEX-C50
matrix cation exchanger (capacity: 2.3 meq/g and particle size: 40.0-120.0 µm) was purchased from
Pharmacia Fine Chemicals INC (Uppsala, Sweden). Type I water was purified with a Barnstead nanopure Diamond Ultrapure water system (Barnstead International, Dubuque, USA).
Equipments
The following equipaments were employed UV-visiblerecording spectrophotometer UV-160-A-Shimadzu (Kyoto, Japan), automatic fraction collector LKB-Frac-100-Pharmacia (Uppsala, Sweden), Q-Tof Micromass Mass Spectrometer (Manchester, UK), freeze dry system Labconco (Kansas City, USA).
Mobile phase preparation
A 0.10 mol/L tris(hydroxymethyl) aminomethane buffer, pH 7.10 or 7.69, containing 90-150 mmol/L NaCl and 20.0 mmol/L CaCl2, 1.0
mmol/L benzamidine-hydrochloride and other buffers were prepared in deionized water using hydrochloride acid to adjust the pH. All preparations were adjusted at room temperature. The mobile phase was prepared considering chromatographic temperature, in such a way that at 4oC the value of pH increased to the desired pH.
This was possible due to the knowledge of temperature coefficient (-0.028/oC) dpK/dT of tris
(Beynon and Easterby, 1996).
Stationary phase preparation and packing of the column
In order to improve the method developed by Schroeder and Shaw (Schroeder and Shaw, 1968), we reproduced the chromatographic system used in 1968 by these authors, with small modifications in the ionic strength of mobile phase. The chromatographic system used a stationary phase SE-Sephadex (C-50 beaded) (Pharmacia, 1977) that was prepared in the same way described in the classical article by Schroeder and Shaw (Schroeder and Shaw, 1968).
efficiency was monitored in each test group by measuring the level of variation of the stationary phase and peak symmetry (Harris, 2001 and Skoog, 1980).
Sample preparation and application
Commercial trypsin samples of 100-300 mg were dissolved in 30 mL of the mobile phase in an ice bath and applied to the top of the column.
Ion-exchange chromatography
Enzymes were purified by workbench cationic ion-exchange chromatography at 4oC, with
isocratic elution in a column with 85.0 x 2.2 cm internal diameter (i.d), 323 mL volume. The column worked under hydrostatic pressure (20 cm of water column) and it was operated with the solvent reservoir bellow the head of the column to avoid packing. The fractions (3.5 mL/tube) were colleted afterelution with 140 mL of buffer using a LKB-Frac-100 with tubes containing 250 µL of 1.5 mol/L of aqueous solution of formic acid to preserve enzymatic activity after chromatography. The eluate was monitored by measurements of optical density at 280 nm. The fractions were pooled, dialyzed against 1.0 mmol/L HCl at 4oC,
by a dilution factor of 106 times sample volume for
24 h, lyophilized, aliquoted, (Everse and Stolzenbach, 1971) and stored at 4oC.
Test conditions
The following variables that could affect the chromatographic resolution were tested:
- Flow rates of 60, 70, 100, 120, 130, 140 and 150 µL/min;
- NaCl of 90, 100, 125, 150, mmol/L ;
- Sample loadings of 100, 150, 200, 250 and 300, mg of commercial trypsin;
- pH of 7.10 and 7.69 at 4oC.
All tests were done in triplicate for each point.
Data analysis
Calculation of chromatographic resolution was performed by the following equation (Harris, 2001).
R= [(PEAK VR2 – PEAK VR1) / 0.5 X (W2 + W1)]
where:
- peak Vr = retention volume of peak - w = width of the base of the peak
The values of w and peak Vr were obtained by deconvolution analysis of chromatograms using by the Origin5.0 software.
Protein concentration determination
The protein concentration was determined spectroscopically using the trypsin molar extinction coefficient at 280 nm of ξ = 40,000 mol
-1L.cm–1(Walsh and Wilcox, 1971). Measurements
were done in a 1.0 mmol/L HCl solution in triplicate.
Molecular mass determination
Molecular masses and purity of proteins were determined by electrospray mass spectrometry
using a Q-ToF MicroTM (Micromass, UK)
equipped with an electrospray ionization source operated in the positive ion mode. Samples (20
µL) from aliquots of 1.0 mL at 1.0 mg/mL concentration spectroscopically measured in HCl 1.0 mmol/L were resuspended in 20 µL of the aqueous solution of 50% (v/v) of acetonitrile plus 0.2 % (v/v) formic acid. Samples were injected directly into the electrospray source via a loop injector at a solvent flow rate of 10 µL/min. Experimental conditions were: source (capillary = 3000 V, sample cone = 70 V, and extraction cone = 2 V) ToF (flight tube = 2500 V and MCP detector= 5630 V). Mass spectrometer calibrations were performed using sodium iodide in the 100– 3000 m/z range. The spectrum data obtained was
the result from 30 scans (2.5 s) combined. Original data (m/z) were treated (baseline subtraction,
smoothing and centering) and analyzed by the MassLynx 4.0 software.
Enzyme assays
All enzymatic activities were measured at 37oC in
a final volume of 1.0 mL. Isoforms of trypsin were assayed with the chromogenic synthetic substrate
N,α-Benzoyl-p-Nitroanilide (BApNA) 10 mmol/L
in dimethyl sulphoxide (DMSO) in 0.1 mol/L tris (hydroxymethyl) aminomethane buffer, pH 8.0, containing 20 mmol/L CaCl2. (Erlanger et
al.,1961).
Determination of active enzyme concentration
buffer being changed sometimes from Diethyl barbituric acid (Veronal) to tris (hydroxymethyl) aminomethane.
RESULTS AND DISCUSSION
In a classical paper (Schroeder and Shaw, 1968) SE-Sephadex-C50 matrix with buffer near neutrality was showed to provide a good method for separation of trypsin isoforms, but with low yield and low resolution between α- and β-trypsin isoforms. The initial goal of our work was to analytically study the conditions of the
chromatographic processes described by
Schroeder and Shaw and to try to develop new conditions to improve the separation of β- and α -trypsin isoforms.
The procedure chosen to monitor the efficacy of the separation methods were: resolution among isoforms (R) and mass spectrometry for the determination of identity and purity of the trypsin isoforms.
Preliminary tests with the column
The first step was to decrease the flow rate of the chromatography due to excessive packing of stationary phase at the flow rate described by Schroeder and Shaw. This parameter was monitored by visual analysis (measurement of height variation of stationary phase during the process) and loss of peak symmetry.
The flow rate average of 290 µL/min (Schroeder and Shaw, 1968) was divided by approximately 5 (60 µL/min), 4 (70 µL/min), 3 (100 µL/min) and 2 (150 µL/min) their chromatographic profiles were compared.
Preliminary results (data not shown) showed that flow rates of 60, 70 and 100 µL/min caused small modifications in the level of stationary phase and in peak symmetry of α-and β-trypsin isoforms. But with a flow rate of 150 µL/min, the modifications in the chromatographic profiles were remarkable (loss of peak symmetry, data not shown) and a significant column stationary phase packing was observed. Therefore, the initial working condition chosen was a method with a low flow rate of 60 µL/min, aiming to allow an equilibration between adsorbing sites and the proteins.
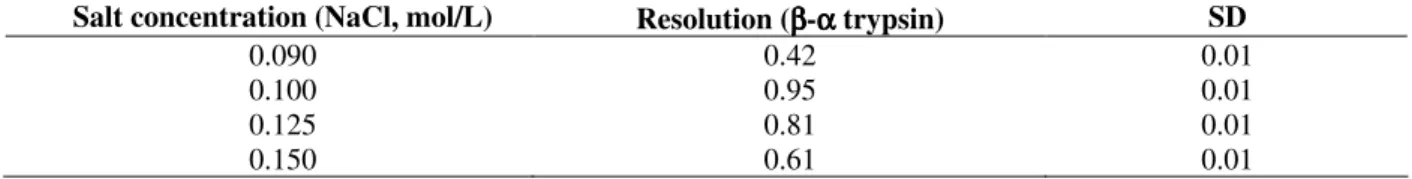
Salt concentration dependence of ββββ- and αααα -trypsin separation
Trypsin is a protein that has a strong adsorption to SE-Sephadex and salt addition to the elution buffer is needed for deadsorption and elution in an isocratic mode. Different experimental conditions were tested aiming better resolution between β- and α-trypsin. The NaCl concentration in elution buffer was varied in the 90 – 150 mmol/L range. The main results are listed in Table 1.
Table 1 - Effect of salt concentration on chromatographic resolution. Conditions for the analyses were as follows: SE-Sephadex column, 85.0 x 2.2 cm (i.d), mobile phase 0.1 mol/L tris-HCl buffer, pH 7.69, 0.02 mol/L CaCl2, 1.0
mmol/L benzamidine and NaCl; sample loading, 100 mg; flow rate of 60 µL/min at 4oC. Experiments were
performed in triplicate. SD refers to standard deviation.
Salt concentration (NaCl, mol/L) Resolution (ββββ-αααα trypsin) SD
0.090 0.42 0.01
0.100 0.95 0.01
0.125 0.81 0.01
0.150 0.61 0.01
The best results were obtained with a concentration of 100mmol/L NaCl. Runs made with NaCl concentrations of 125 and 150 mmol/L showed a decrease in resolution between α- and β -trypsin (Table.1). Runs made with a NaCl concentration of 90mmol/L were less efficient, due to a strong adsorption of the isoforms onto the matrix that were slowly deadsorptioned with a lower resolution. Other disadvantages of working with low salt concentration (smaller than 90
mmol/L NaCl) are a higher elution volume and a longer time for separation of isoforms. Thus, the best salt concentration for this separation was 100mmol/L NaCl.
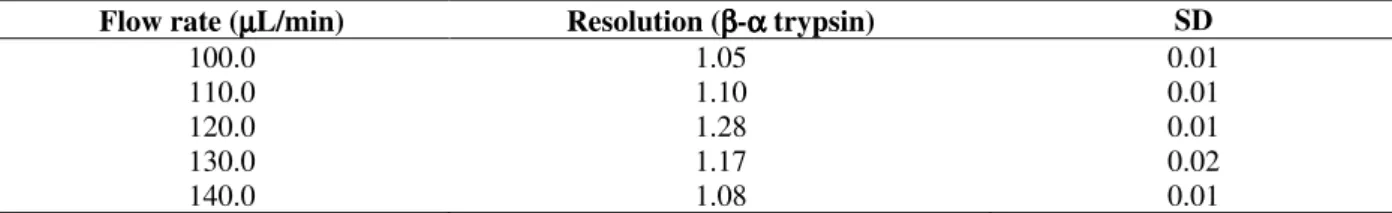
Second flow rate test
chromatographic time should be decreased (Scopes, 1996). Thus a fast flow rate can reduce the time for the chromatography experiment. However, it is preferable to start experiments with low flow rate increasing to high flow rate, to avoid the excessive packing of the stationary phase. Monitoring of packing was done by noticing the following parameters: shape of peaks and visual observation of stationary phase level variation.
A flow rate of 60 µL/min caused problems with diffusion effects and with long time of purification, thus larger flow rates were tested (100 –150 µL/min).
The best chromatographic resolution was observed with a flow rate of 120 µL/min, as listed in table.2. Flow rates of 100 and 110 µL/min showed low resolution and chromatographic times are still unacceptable long.
Table 2 Effect of flow rate on chromatographic resolution. Conditions for the analyses were as follows: SE -Sephadex column, 85.0 x 2.2 cm (i.d), mobile phase 0.1 mol/L tris-HCl, 0.02 mol/L CaCl2, 1.0 mmol/L benzamidine
and 0.1 mol/L NaCl, pH 7.69; sample loading, 100.0 mg. Runs were made at 4oC. Experiments were performed in
triplicate. SD refers to standard deviation.
Flow rate (µµµµL/min) Resolution (ββββ-αααα trypsin) SD
100.0 1.05 0.01
110.0 1.10 0.01
120.0 1.28 0.01
130.0 1.17 0.02
140.0 1.08 0.01
With 130 and 140 µL/min, flow rate profiles were similar (data not shown), displaying a good separation between β- and α-trypsin isoforms (Table.2). Nevertheless, the flow rates of 130 and 140 µL/min caused packing of stationary phase of about 1.0 - 2.0 cm, while at 120 µL/min only small alterations were noticed in the level of matrix in column at the end of the chromatographic process. Chromatography with a flow rate of 120 µL/min showed better separation of trypsin isoforms. The retention time of β-trypsin changed from 12 days (at 60 µL/min) to about 3 days (at 120 µL/min) and the peaks became more symmetrical. A possible explanation for this phenomenon is that at moderate flow rates, the protein solution has an adequate time to equilibrate and adsorb to the ion exchanger. Fast flow rates can reduce peak resolution for some such as an: excessive matrix
packing leading to a decrease in the number of theoretical plates resulting in low resolution among isoforms. Additionally, it decreases the time of interaction between protein and matrix
Influence of sample loading
Once the best flow rate and salt concentration were determined, it was necessary to investigate how much protein could bind to a given volume of matrix and also the loading capacity of the column for trypsin. Sample loadings tested were: 100 mg (3.33 mg/mL), 150 mg (5.0 mg/mL), 200 mg (6.6 mg/mL), 250 mg (8.3 mg/mL) and 300 mg (10.0 mg/mL) of commercial trypsin (Walsh and Wilcox, 1971). The influence of sample loading upon chromatographic resolution of β- and α -trypsin is shown in Table 3.
Table 3: Effect of loading capacity on chromatographic resolution. Conditions for the analyses were as follows: SE -Sephadex collumn, 85.0 x 2.2 cm (i.d), mobile phase 0.10 mol/L tris-HCl buffer, 0.02 mol/L CaCl2, 1.0 mmol/L
benzamidine and 0.10 mol/L NaCl, pH 7.69; flow rate 120 µL/min at 4oC. Experiments were done in triplicate. SD
refers to standard deviation.
Sample load (mg) Resolution (ββββ-αααα trypsin) SD
65.0 1.27 0.01
80.0 1.28 0.01
100.0 1.28 0.02
150.0 1.16 0.02
200.0 1.03 0.01
250.0 0.86 0.02
Analyzing Table 3 it can be noticed that a sample loading of 100 mg results in acceptable resolution of individual trypsin isoforms (β-α). Loading 80 or 65 mg results in resolutions almost identical to the obtained when 100 mg are loaded. Thus, it is more advantageous to use 100 mg instead of 80 or 65 mg, for yield and time reasons. When sample loading is in the range of 150-300 mg, the resolution is worst, resulting in the obtention of greater amounts of impure β-trypsin (omitted data). At sample loading in the range of 150-250 mg of commercial trypsin it was noticed that the retention time decreased and peaks have lost their Gaussian shape, as typical of overloading. With values over 250 mg of commercial trypsin the peaks became totally flat and lost symmetry (Gooding and Schmuck, 1983). Thus, the best resolution was obtained with maximum sample loading of 100.0 mg of commercial trypsin.
Influence of pH in the chromatographic process
In the article of Schroeder and Shaw (Schroeder and Shaw, 1968) it was mentioned that “all pH adjustments were made at room temperature, and the values cited in this paper refer to such
measurements regardless of the temperature of chromatography, which was often 2- 4 oC...”.
All previous experiments in this paper were
performed considering chromatographic
temperature. The buffer used for chromatography was tris (hydroxymethyl) aminomethane and it has a dpKa / dT= -0.028/oC (Beynon and Easterby,
1996). In pH range from 3 to 11 the change in proton concentration will usually be smaller compared to the concentration of buffer species, and the pH shift is to a first approximation, equal to the change in the pKa (Beynon and Easterby,
1996). When solutions were adjusted at room temperature (25oC) to pH 7.10 and were used in
chromatographic processes at 4 oC, as it was done
by Schroeder and Shaw (Schroeder and Shaw, 1968), the pH shifted to 7.69. When the chromatographic process is conducted in pH 7.10 at 4oC, it leads to significant modifications in the
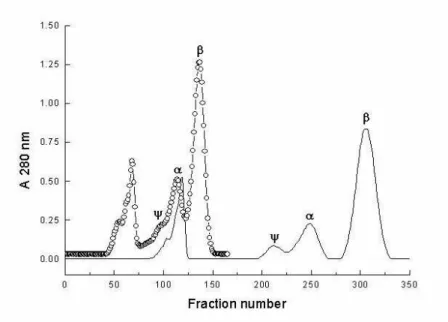
chromatographic resolution, as can be seen in Fig.1 and Table 4.
Figure 1 - Effect of pH on the chromatography. The conditions were as follows: flow rate 120
µL/min, sample loading, 100 mg, mobile phase 0.1 mol/L tris-HCl buffer, pH 7.69 at 4 oC (
О) and 7.10 at 4 oC (), 0.02 mol/L CaCl2, 1.0 mmol/L benzamidine and 100
mmol/L NaCl on the stationary phase SE-Sephadex. Fractions of 3.5 mL were collected. The reported pH values are the calculated ones at 4oC and the corresponding
Table 4 - Effect of pH on chromatographic resolution. Conditions for the analyses were as follows: SE-Sephadex column, 85.0 x 2.2 cm (i.d), mobile phase 0.1 mol/L tris-HCl buffer, 0.02 mol/L CaCl2, 1.0 mmol/L benzamidine
and 0.1 mol/L NaCl; sample loading, 100 mg; flow rate 120 µL/min. The reported pH values are the ones at 4oC.
Experiments were performed in triplicate. SD refers to standard deviation.
pH Resolution (ββββ-αααα trypsin) SD
7.69 1.28 0.08
7.10 1.60 0.05
The change from pH 7.69 to 7.10 at 4oC in the
stationary phase results in an increase in the retention of both β- and α- trypsins (Fig.1). This is due to the fact that the isoforms of trypsin are more protonated at pH 7.10 than at pH 7.69. Running the chromatography at pH 7.10 is a much better experimental condition, with higher resolution mainly for β-trypsin that is totally separated from α-trypsin, after about seven days (Fig.1 and Table.4). In order to investigate if ψ- and α-trypsins separation could be improved at a pH smaller than 7.10, a run was made at pH 6.90. The resolution between β- and α-trypsins decreased to 1.47 and the retention time of β -trypsin shifted to nine days; the resolution between
ψ- and α-trypsins did not show any significant improvement. Thus, the best condition for isolating ψ-trypsin is probably between pHs 6.90 and 7.10, but the separation between α- and ψ -trypsin in a run performed at pH 7.10 was already satisfactory in comparison to previous results, yielding enough amounts of nearly pure proteins.
Besides, theses isoforms can be further purified by re-chromatography of these samples.
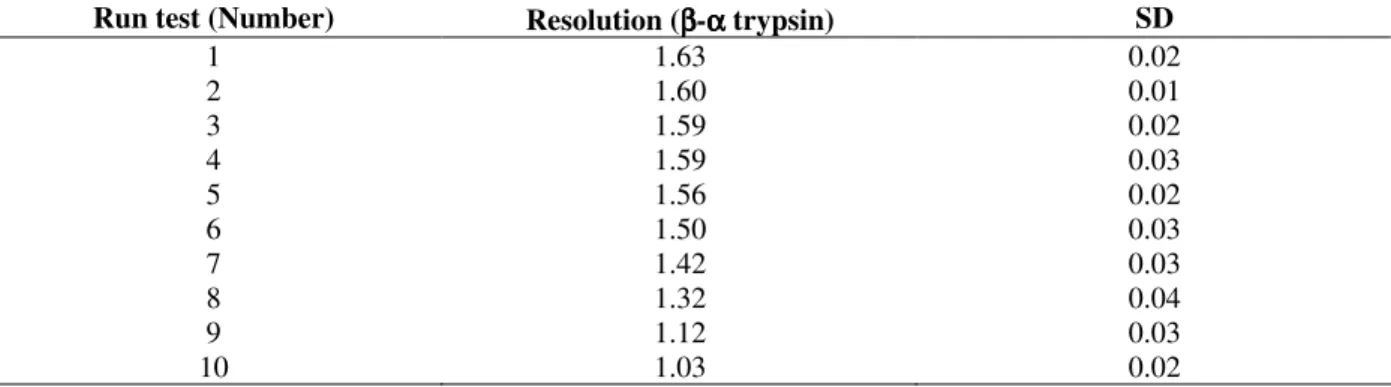
Reproducibility test
In order to test the reproducibility (precision) of the improved chromatographic process (0.1 mol/L tris-HCl, pH 7.10, 0.1 mol/L NaCl, 0.02 mol/L CaCl2, 1.00 mmol/L benzamidine, sample loading
of 100 mg of commercial trypsin and flow rate of 120 µL/min at 4oC), ten consecutive runs were
performed, without column regeneration and repacking for the next separation. As one can observed in Table 5 the maximum number of consecutive runs with acceptable resolution (resolution ≥ 1.50 (Harris, 2001) were six.
After six runs the resolution dropped to 1.42 and
β- and α-trypsin were not totally separated anymore. So, this column and method were standardized to operate at optimal conditions only for five consecutive runs.
Table 5 - Effect of reproducibility on the chromatographic resolution. Conditions for the analyses were as follows: SE-Sephadex column, 85.0 x 2.2 cm (i.d), mobile phase 0.10 mol/L tris-HCl buffer, 0.02 mol/L CaCl2, 1.0 mmol/L
benzamidine and 0.1 mol/L NaCl, pH 7.10; sample loading, 100 mg and flow rate of 120 µL/min at 4oC.
Experiments were performed in triplicate. SD refers to standard deviation.
Run test (Number) Resolution (ββββ-αααα trypsin) SD
1 1.63 0.02
2 1.60 0.01
3 1.59 0.02
4 1.59 0.03
5 1.56 0.02
6 1.50 0.03
7 1.42 0.03
8 1.32 0.04
9 1.12 0.03
10 1.03 0.02
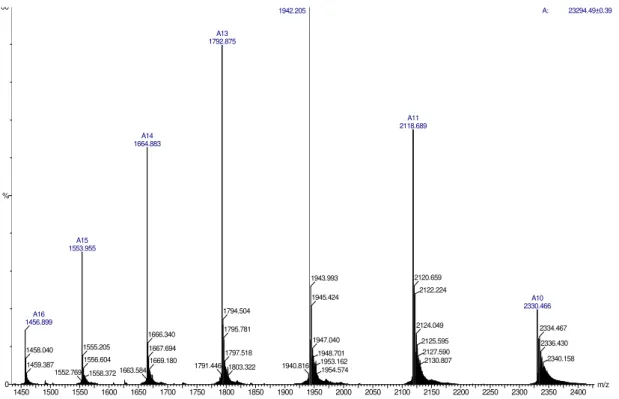
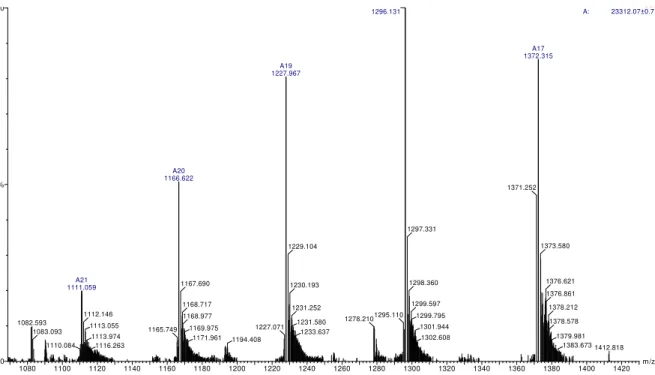
Molecular mass determination and purity
Molecular mass and purity of proteins were determined by electrospray mass spectrometry and results are given in Figs.2 and 3. These figures show the distribution patterns of ion peaks of
patterns of ions peaksfor α-trypsin. It shows small contaminating amounts of ψ-trypsin. Molecular mass values of β-, α- and ψ-trypsins were calculated by manual method in MassLynx® 4.0
software and the results were M (β) = 23,294.49
±0.03 Da, M (α) = 23,312.07 ± 0.01 Da and M (ψ)
= 23,330.25 ± 0.01 Da. It is important to notice that the difference between M (α) and M (β) is 17.58 Da due to the addition of one water molecule (18 Da) when β-trypsin is converted to
α-trypsin. These values are in accordance with the values described by Ashton (Ashton et al., 1994).
Thus, the identity and the purity of the isoforms were satisfactorily confirmed, validating our optimized method of chromatography.
Other characterization parameters of the improved chromatographic methodology
When 100 mg of commercial protein was applied to the column, under these optimized conditions, the recovery yield was about 85 mg of protein, of the total purified protein, 60 % is β-trypsin, 15 % is α-trypsin, 5 % is ψ- trypsin and the remaining
20 % is composed of minor isoforms (gama, delta and zeta) and other peptides.
In order to discover the active site concentration before and after the chromatography, commercial protein was dialyzed against 1.0 mmol/L HCl at 4oC with a dilution factor of 106 times and assayed
by active–site titration with NPGB (Scopes, 1996). The results were the following: 71.0 ± 2.0 % for commercial trypsin (before chromatography), 96.0
± 1.5% for purified β-trypsin and 95.0 ± 1.8% for purified α- trypsin. These results show that, in the new optimized chromatographic process, autolysis is inhibited during the chromatography and the enzyme activity is kept high.
Determination of specific activities of commercial and purified trypsin isoforms was made using BApNA (Erlanger, et al., 1961), and the results are
shown in fig.4.
1450 1500 1550 1600 1650 1700 1750 1800 1850 1900 1950 2000 2050 2100 2150 2200 2250 2300 2350 2400 m/z 0
100
%
4.20e3
A: 23294.49±0.39 1942.205
A13 1792.875
A14 1664.883
A15 1553.955
A16 1456.899
1458.040 1459.387
1552.769 1555.205 1556.604
1558.372 1663.584 1666.340 1667.694 1669.180
1791.446 1794.504 1795.781
1797.518
1940.816 1803.322
A11 2118.689
1943.993 1945.424
1947.040 1948.701
1953.162 1954.574
2120.659 2122.224
A10 2330.466
2124.049 2125.595 2127.590 2130.807
2334.467 2336.430 2340.158
Figure 2 - Mass spectrometry of purified β-trypsin. The conditions were: source (capillary = 3000 V, sample cone = 70 V, and extraction cone = 2 V) and ToF (flight tube = 2500 V and MCP detector = 5630 V). Analyzed spectrogram yielded an average mass for β- trypsin
1080 1100 1120 1140 1160 1180 1200 1220 1240 1260 1280 1300 1320 1340 1360 1380 1400 1420 m/z 0
%
A: 23312.07±0.71 1296.131
A19 1227.967
A20 1166.622
A21 1111.059
1082.593 1083.093
1110.084 1112.146
1113.055
1165.749 1113.974
1116.263
1167.690
1168.717 1168.977
1169.975 1227.071 1171.961 1194.408
1229.104
1230.193
1231.252
1295.110 1231.580 1278.210
1233.637
A17 1372.315
1371.252
1297.331
1298.360
1299.597 1299.795
1301.944 1302.608
1373.580
1376.621 1376.861 1378.212 1378.578 1379.981
1383.673 1412.818
Figure 3 - Mass spectrometry of purified α-trypsin. Experimental conditions are the same as in fig.2. Average mass of α- trypsin was 23,312.07 ± 0.01 Da.
The results are in accordance to Foucault (Foulcault, et al., 1974a and Foulcault, et al.,
1974b). The low specific activity found with commercial trypsin is due to factors unstabilizing the sample, as peptides inhibitors in the commercial trypsin preparation, storage time or storage at very low temperatures, possibly leading to cold denaturation.
These results showed that the enzyme isoforms were not modified during the process of separation. During all steps in the purification process the specific activity of the enzymes did not change significantly.
CONCLUSIONS
The optimized separation methodology of the main trypsin isoforms (β and α) by cationic chromatography developed in this work offers many quantitative and qualitative advantages when compared to previous methodologies using ion-exchange or other chromatographic methods. This improved methodology, using 0.1 mol/L tris-HCl, 0.1 mol/L NaCl, 0.02 mol/L CaCl2, 1.0 mmol/L
benzamidine, pH 7.1 at 4oC with flow rate of 120
µL/min and sample loading of 100 mg of commercial trypsin, results in a chromatographic profile with total resolution between β- and α -trypsins, with β-trypsin showing high purity and activity levels, while α- trypsin is partially pure, with insignificant amounts of contaminating ψ -trypsin. In addition, the improved methodology gives high yield of pure amounts of those enzymes at small purification time. Thus, the method proposed can be very useful in the routine of purification of trypsin isoforms which can be used in basic and applied research, for instance, large-scale proteomic projects requiring extensive use of high-quality trypsinolysis for sample analysis.
ACKNOWLEDGEMENTS
The authors would like to thank Dr. Thiago R. Mares Guia for generous help and particular interest and encouragement in all this work, and to the “Núcleo de Estrutura e Função de Biomoléculas” for allowing the use of mass spectrometer. Santos, A. M. C. is recipient of a (CNPq) scholarship.
RESUMO
O propósito deste trabalho foi melhorar a separação e o rendimento das isoformas puras β- e
α- tripsina por meio de cromatografia de troca iônica e caracterizar algumas propriedades físico-químicas dessas isoformas. A purificação de isoformas de tripsina foi realizada em SE Sephadex, com tampão tris-HCl, pH 7,10 a 4oC. A
quantidade de amostra, a concentração salina, o fluxo e o pH da fase móvel foram variados para determinar o efeito sobre a resolução da separação. A resolução foi otimizada principalmente entre β- e α-tripsina, utilizando o pH 7,10 a 4oC. Isoformas puras foram obtidas a partir de 100 mg de tripsina comercial bovina depois de sete dias de cromatografia, fornecendo 51,0 mg de β-tripsina totalmente pura e 13,0 mg de α-tripsina parcialmente pura, com quantidades pequenas de contaminação por ψ-Tripsina. Assim, tempo e resolução da purificação foram otimizados redendo grandes quantidades de enzimas puras e ativas que são úteis em várias áreas de pesquisa e ciências biotecnológicas.
REFERENCES
Ashton, D.S., Ashcroft, A.E., Beddell, C.R., Cooper, D.J., Green, B.N. and Oliver, R.W.A. (1994), On the analysis of bovine trypsin by electrospray- mass spectrometry. Biochem. Biophys. Res. Commun., 199, 694-698.
Beynon, R. J. and Easterby, J. S., (1996), Effect of temperature on pH. In Buffer solutions the basic, IRL PRESS, New York, p.31.
Bollag, D.M., Rozycki, M.D. and Edelstein, S.J., (1996), Protein Methods, second edition, Wiley-Liss press, New York, pp.229-269.
Chase Jr, T., Shaw, E. (1967), p – Nitrophenyl- p’ – Guanidinobenzoate HCl: A new active site titrant for trypsin. Biochem. Biophys. Res. Commun., 29, 508-514.
Everse, J. and Stolzenbach, F.E. (1971), Lyophilization. Method. Enzymol., 22, 33-39.
Erlanger, B. F., Kokowsky, N., Cohen, W. (1961), The preparation and properties of two new chromogenic substrates of trypsin. Arch.Biochem.Biophys., 95, 271-278.
Foulcault, G., Seydoux, F., Von, J. (1974a), Comparative Kinetic properties of α, β and ψ forms of trypsin. Eur.J.Biochem., 47, 295-302.
Foulcault, G., Kellershohn, F., Seydoux, J.Y., Parquet, C.I., Arrio, B. (1974b), Comparative study of some conformational properties of α, β and ψ bovine trypsins. Biochimie., 56, 1343-13507.
Gooding, K. M. and Schmuck, M. N. (1983), Purification of trypsin and other basic proteins by high performance cation-exchange chromatography. J. Chromatogr., 266, 633-642.
Gráf, L., Szilágyi, L. (2003), Trypsin: is there anything new under the sun. J. Mol. Struct-Theochem., 666-667, 481-485.
Harris, D.C. (2001), Separações analíticas. In Análise Química Quantitativa, quinta edição, LTC press, Rio de Janeiro, pp.551-576.
Pharmacia LKB Biotechnology (1977), Ion exchange chromatography- Principles and Methods, Rahms I Lund, Uppsala, pp. 19-23.
Schroeder, D. D. and Shaw, E. (1968), Chromatography of Trypsin and Its Derivates. J. Biol. Chem., 243, 2943-2949.
Scopes, R.(1996), Proteins ed. Price, N.C. Academic Press, San Diego, p.33-48.
Skoog, D.A. (1980), Principles of Instrumental Analysis, Third Edition. Saunders College Publishing, New York, pp.727-731.
Smith, R.L. and Shaw, E. (1969), Pseudotrypsin- A modified bovine trypsins produced by limited autodigestion. J. Biol. Chem., 244, 4704-4712. Strop, P. and Cechová, D. (1981), Separation of α- and
β- trypsin by hydrophobic interaction chromatography. J. Chromatogr., 207, 55-62.
Titani, K., Sasagawa, T., Resing, K. and Walsh, K.A. (1982) A simple and rapid purification of commercial trypsin and chymotrypsin by reverse-phase high-performance liquid chromatography. Anal. Biochem., 123, 408-412.
Yong-Chang Shi, Yong-Ming Jiang, De-Xin Sui, Yan-Li Yan-Li, Tian Chem, Yan-Lin Ma, Zhong-Tian Ding, (1996), Affinity chromatography of trypsin using chitosan as ligand support. J. Chromatogr.A., 742, 107-112. Walsh, K. A. and Wilcox, P.E. (1971), Serine protease,
Method. Enzymol., 19, 31-41.