RESEARCH ARTICLE
Numerical Simulation of CO
2
Flooding of
Coalbed Methane Considering the Fluid-Solid
Coupling Effect
Jianjun Liu1,2, Guang Li1,2*, Yue Zhang3
1School of Geoscience and Technology, Southwest Petroleum University, Chengdu, China,2State Key Laboratory of Oil and Gas Reservoir Geology and Exploitation, Southwest Petroleum University, Chengdu, China,3Jidong Oilfield Company, PetroChina, Tangshan, Hebei, China
Abstract
CO2flooding of coalbed methane (CO2-ECBM) not only stores CO2underground and
reduces greenhouse gas emissions but also enhances the gas production ratio. This cou-pled process involves multi-phase fluid flow and coal-rock deformation, as well as pro-cesses such as competitive gas adsorption and diffusion from the coal matrix into fractures. A dual-porosity medium that consists of a matrix and fractures was built to simulate the flooding process, and a mathematical model was used to consider the competitive adsorp-tion, diffusion and seepage processes and the interaction between flow and deformation. Due to the effects of the initial pressure and the differences in pressure variation during the production process, permeability changes caused by matrix shrinkage were spatially vari-able in the reservoir. The maximum value of permeability appeared near the production well, and the degree of rebound decreased with increasing distance from the production well.
Introduction
The porosity and permeability of fracture systems in coalbed methane reservoirs are influenced by effective stress and gas adsorption-desorption. In 1987, Gray put forward that when the coalbed methane desorbs, the coal matrix shrinks, which can cause crack expansion and per-meability increases [1]. In 1998, Mavor used observational data from the San Juan Basin to prove the coal matrix shrinkage hypothesis [2]. In the same year, Palmer and Mansoori derived the permeability calculation formula (P&M formula), which considers the effects of effective stress and matrix shrinkage on permeability. Based on this formula, they studied the actual production process of the San Juan Basin and successfully explained the“gas production rebound”phenomenon [3]. At present, many scholars have performed numerous studies on experimental and theoretical aspects. Jessen [4] reported a mixed gas injection mechanism based on research on the different effects associated with enhancing recovery efficiency using injected CO2, N2and mixed gases. Karacan [5] found that adsorption and swelling phenomena
OPEN ACCESS
Citation:Liu J, Li G, Zhang Y (2016) Numerical Simulation of CO2Flooding of Coalbed Methane
Considering the Fluid-Solid Coupling Effect. PLoS ONE 11(3): e0152066. doi:10.1371/journal. pone.0152066
Editor:Jie Zheng, University of Akron, UNITED STATES
Received:December 22, 2015
Accepted:March 8, 2016
Published:March 31, 2016
Copyright:© 2016 Liu et al. This is an open access article distributed under the terms of theCreative Commons Attribution License, which permits unrestricted use, distribution, and reproduction in any medium, provided the original author and source are credited.
Data Availability Statement:All relevant data are within the paper.
Funding:The research is financially supported by National Natural Science Foundation of China (Grant No. 51174170) and the National Science and Technology Support Program Project (Grant No. 2012BAC26B05). Jianjun Liu received the funding. The funders had no role in study design, data collection and analysis, decision to publish, or preparation of the manuscript.
methane mostly focus on competitive adsorption between CO2and CH4, gas-water two-phase
flow and the effect caused by coal or rock deformation on permeability. Very little research has been conducted on the dynamic evolution of permeability during CO2injection.
In this paper, based on the existing theory and test results [15–20], a mathematical model considered competitive adsorption, diffusion and seepage process and the interaction between flow and deformation was established, using software simulated the production situation of CO2flooding, emphasis analyses the dynamic evolution of permeability during the process of
CO2flooding.
Mathematical Model of CO
2Flooding of Coalbed Methane
Model assumptions: Both the coalbed methane and water flow under Darcy flow, and the two-phase fluid flow can be expressed as follows:
@ @x
krgkx
Bgmg @pg
@x rgg @D @x " # þ @ @y krgky
Bgmg @pg
@y rgg @D @y " # þ @ @z krgkz
Bgmg @pg
@z rgg @D
@z
" #
þqf qg¼ @
@tðrgSgÞ ð1Þ
@ @x
krwkx
Bwmw @pw
@x rwg
@D @x þ @ @y krwky
Bwmw @pw
@y rwg
@D @y þ @ @z krwkz
Bwmw @pw
@z rwg
@D
@z
qw¼ @
@tðrwSwÞ ð2Þ
wherekrgis the relative gas permeability;krwis the relative water permeability;kx,ky, andkzare
the absolute permeabilities in the X, Y, and Z directions, respectively;ρgis the gas density;ρwis the water density; g is the acceleration of gravity, m/s2;Pgis the gas pressure, MPa;Pwis the water pressure, MPa;Sgis the gas saturation;Swis the water saturation;ϕis porosity;Dis stan-dard height, m;μgis the viscosity of the gas;μwis the viscosity of the water;Bgis the formation volume factor of the gas;Bwis the formation volume factor of the water;qfis the amount of gas in the fracture due to the diffusion effect;qgis the source term of the gas, m3/d; andqwis the source term of the water, m3/d.
Permeability in coals is a function of effective stress and matrix shrinkage. The calculation uses the P&M equation (Palmer and Mansoori 1998 [3]), which is expressed as follows:
f f0
¼1þC
fðP PiÞ þxL 1
K M
Pi
PiþPL
P PþPL
InEq (3), the central part indicates the influence of stress change (cleat deformation) on porosity, the latter part indicates the influence of matrix shrinkage on porosity, when considers only cleat deformation, the expression can be expressed asEq (4):
f f0
¼1þC
fðP PiÞ ð4Þ
kf
kf0
¼ f
f0
!3
ð5Þ
whereCf ¼ 1
0M;
K M¼
1 3
1þm
1 m
;M¼E 1 m
ð1þmÞð1 2mÞ
ϕfis the fracture porosity at pressure p;ϕf0is the initial natural fracture porosity at a given
pressure;Cfis the pore volume compression coefficient, 1/kPa;ξLis the strain at infinite pres-sure;Kis the bulk modulus, kPa;Mis the axial modulus, kPa;Piis the initial pressure, kPa;Kf0 is the initial permeability,Eis the elasticity modulus, kPa; andμis Poisson's ratio;ϕ0is the
ini-tial porosity,Cfis rock compressibility.
Assuming that the absorption behaviors of CH4and CO2in coal follow the rule of
Lang-muir, the amount of adsorbed gas can be expressed as follows:
Vi ¼
ðVmÞibipi
1þXn
j¼1bjpj
ð6Þ
where(Vm)iis the adsorption constant of the pure species gas i, cm3/g;biis the pressure-con-stant of the pure species gas i, 1/MPa; andpiis the partial pressure of gas component i, MPa.
Coalbed methane diffuses from the matrix to fractures following Fick’s law:
@C
@t ¼
@2
C
@X2 ð7Þ
whereCis the gas concentration, mol/m, andXis the distance of gas diffusion, m. The convection diffusion equation for gas can be written as follows:
@
@tððpÞCÞ þ rð DðmÞ þCmÞ ¼0 ð8Þ
whereuis the pore velocity offluid, m/s, and D is the tensor diffusion, m2/s.
The capillary pressure equation and the saturation equation can be written, respectively as follows:
Pc ¼Pg Pw ð9Þ
SgþSw¼1 ð10Þ
wherePcis the capillary pressure, Pa.
Numerical Simulation of CO
2Flooding of Coalbed Methane
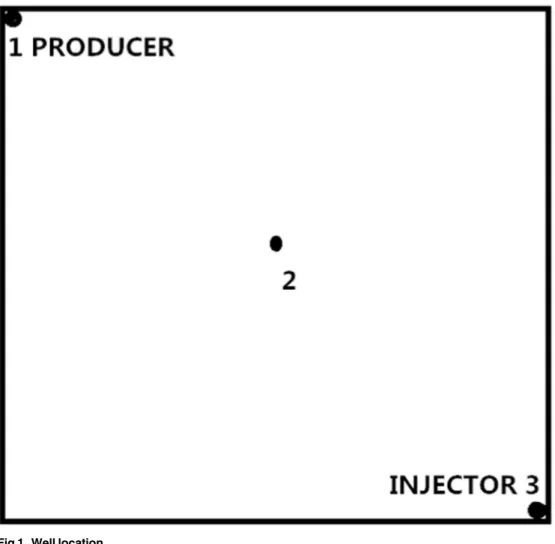
A commercial reservoir simulator was used in this study (CMG-GEM, 2012). The well location distribution is shown inFig 1. The model used closed boundaries and the change of tempera-ture was not considered in our study. CO2was injected using a constant rate of 2000 m3/d. (at
surface condition) for a period of 1940 days. Relevant parameters are provided inTable 1.
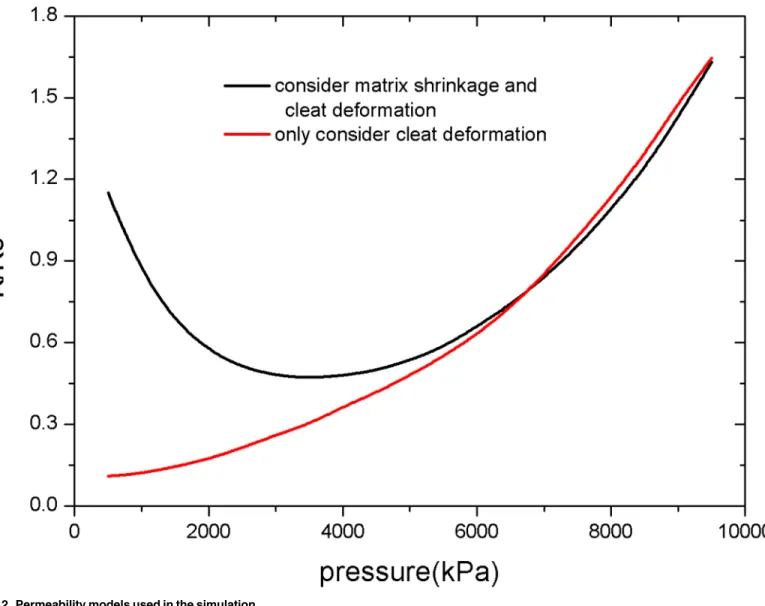
Fig 2compares the two permeability models used in the simulation. A significant difference in permeability changes is present between the two models. The effect on permeability caused by matrix shrinkage appears when the reservoir pressure reaches a low level (approximately 3.5 MPa), and becomes more significant with further drops in reservoir pressure.
Fig 1. Well location.
doi:10.1371/journal.pone.0152066.g001
Table 1. Selected parameters.
Parameters Value Parameters Value
Gridding 40*40*1 Reservoir temperature (°C) 45
Grid spacing (m) 5 5 9 Reservoir pressure (MPa) 7.65
Young’s modulus of elasticity (kPa) 3000000 Top depth (m) 900
Matrix porosity (%) 0.5 Cleat porosity (%) 0.1
Poisson ratio 0.4 CO2/CH4Langmuir pressure (kPa) 1090/350
CO2/CH4Diffusion value (d) 100/100 Cleat permeability (mD) 4.0
Coal compression coefficient (kPa-1) 1.45E-7 Coal density (kg/m3) 1400
Fig 2. Permeability models used in the simulation.
doi:10.1371/journal.pone.0152066.g002
Fig 3. Permeability distribution in the reservoir considering both matrix shrinkage and cleat deformation.
doi:10.1371/journal.pone.0152066.g003
To validate the effects of matrix shrinkage on fracture permeability, two different permeabil-ity equations were used in the simulation. One considers both cleat deformation and matrix shrinkage, and the other considers only cleat deformation.Fig 3shows the permeability distri-bution in the reservoir at various simulation times under conditions of both matrix shrinkage and crack deformation. To improve calculation speed and save calculation time, the grids used in the simulation are limited. This results in distribution contours that are not very smooth, but it does not affect the accuracy of the simulation. Because the permeability changes are affected by reservoir pressure,Fig 4shows the pressure distribution of the reservoir at various simulation times.
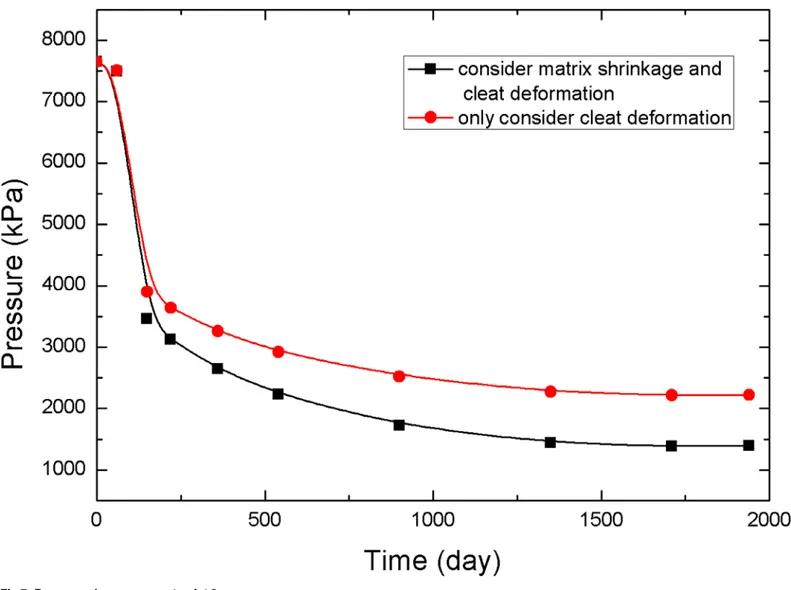
The points 1, 2, and 3 inFig 1(point 1 is near the production well, point 2 is in the middle of the reservoir, and point 3 is near the injection well) are selected to analyze the pressure and permeability data at different times, resulting in the curves in Figs5–10.
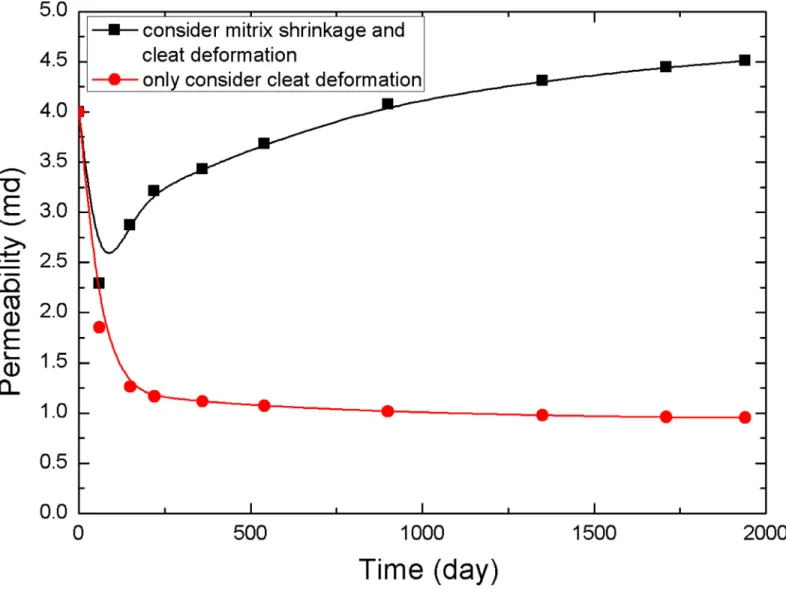
The value of permeability at point 1 during the whole simulation period is shown inFig 6. At the beginning of the simulation, the reservoir pressure near the wellbore rapidly decreases to less than 3.5 MPa (Fig 5), and the permeability near the wellbore appears to rebound due to matrix shrinkage. At low drawdown pressures, the degree of permeability rebound is greater. One interpretation of this pattern is that matrix shrinkage increases pore volume, leading to an increase in permeability. In a simulation of 1,940 days, the maximum value of permeability around the production well increased to 4.3 mD, exceeding the initial permeability in the reser-voir.Fig 6shows a typical permeability curve near the production well at various periods when permeability is influenced only by cleat deformation. As the output of CH4and pore pressure
decrease, the effective stress increases and cracks are compressed. This process makes the fluid pathways smaller and leads to a decrease in permeability.
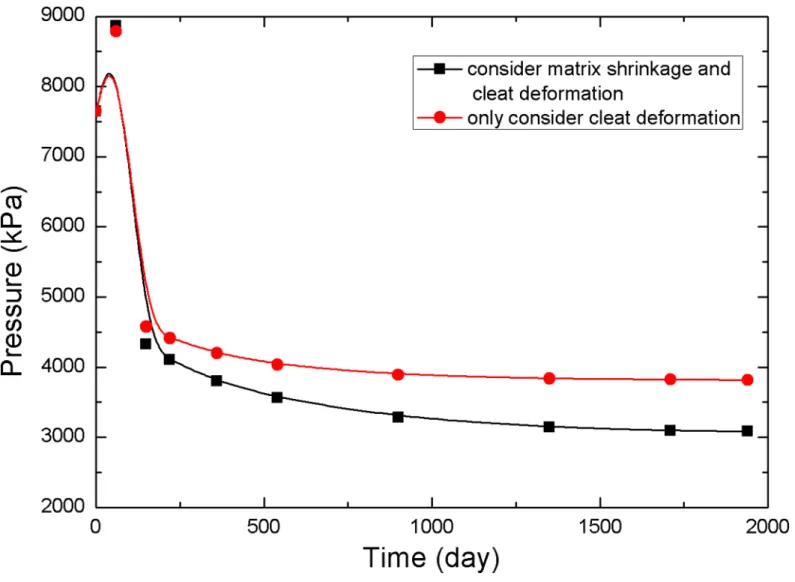
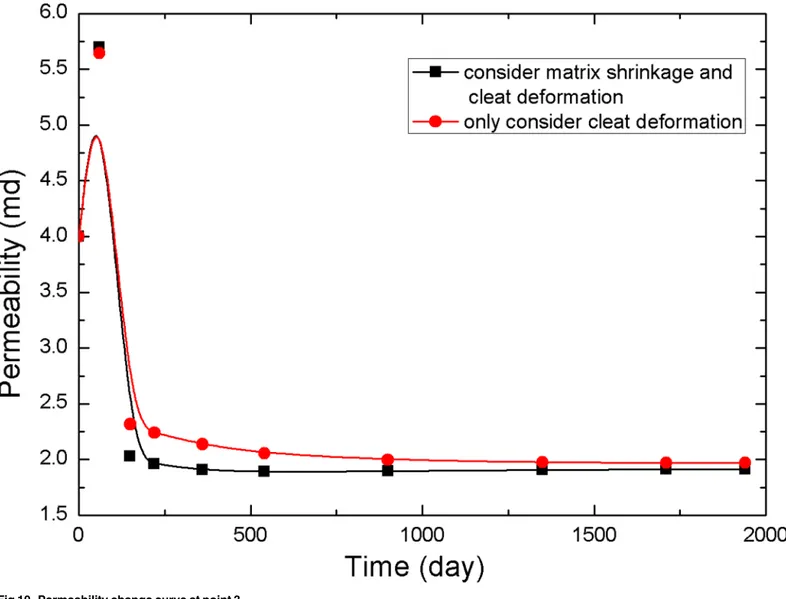
Fig 8presents the changes in permeability in the middle of the reservoir at various times. Because the pressure decrease was weaker than that of the area near the production well, the permeability rebound was not large, and the final value was less than 3 mD. However, the per-meability still increased by 1.5 mD more than the perper-meability in the case in which the fracture permeability formula does not consider matrix shrinkage.
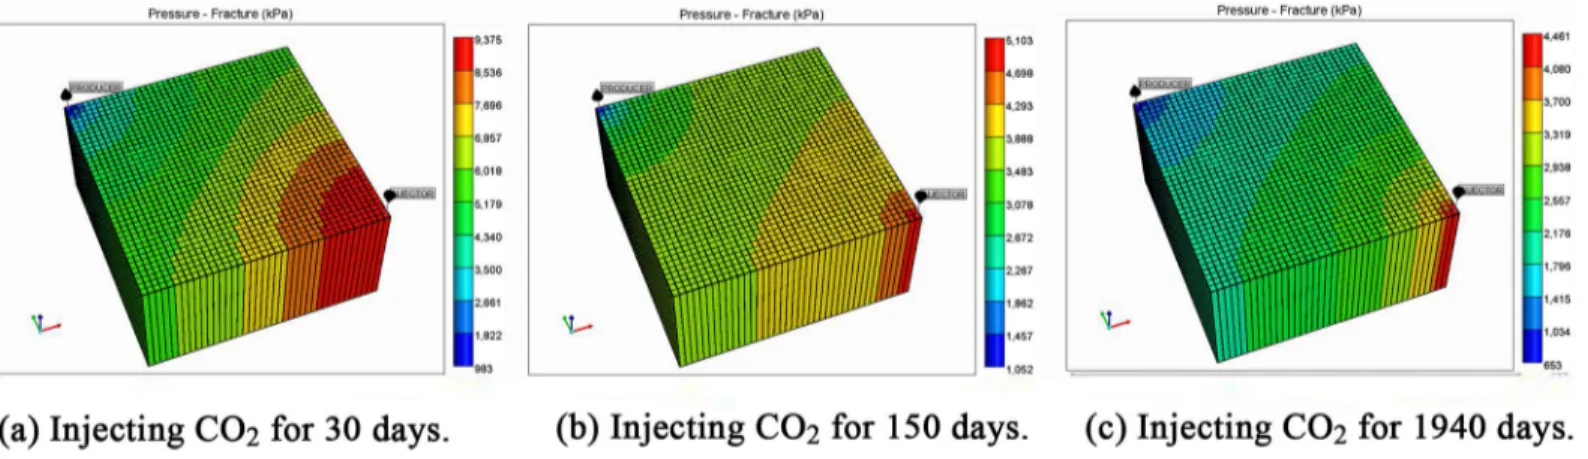
As a result of CO2injection, the pressure of the reservoir was replenished, slowing the
pres-sure decrease in the reservoir, especially near the injection well where the prespres-sure was main-tained at a high value (Fig 4). The permeability in these areas consistently decreased, and the permeability curve was similar to the case that only considers cleat deformation (Fig 10).
Fig 4. Pressure distribution in the reservoir considering both matrix shrinkage and cleat deformation.
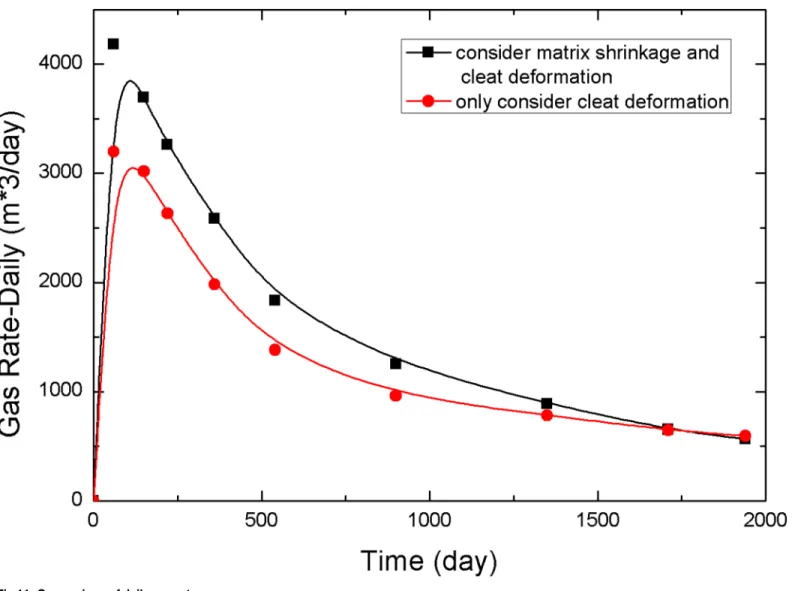
Fig 11compares the daily gas rates of both cases to analyze the effects of matrix shrinkage on CO2flooding of coalbed methane (CO2-ECBM). The peak value of daily gas rate was higher
when matrix shrinkage is considered, resulting in a maximum value of 4182 m3/day, which is 30.77% higher than that of the case that only considers cleat deformation. In the late stage of the simulation, low gas saturation becomes the main factor limiting the daily gas rate. After a simulation length of 1,700 days, the daily gas rate drops below that of the case that only consid-ers cleat deformation. Therefore, matrix shrinkage improves the fracture permeability, thereby increasing CH4production during the early stages and decreasing gas saturation during the
later stages.
The evolution of the cumulative production of CH4is shown inFig 12. The curve clearly
indicates that matrix shrinkage promotes the CO2-ECBM process. Matrix shrinkage allows
fracture permeability to increase and accelerates the output of gas. Under the given conditions in this study, the cumulative production of CH4was 2.25×10⁶m3, and the recovery was 80.3%,
which was 18.1% higher than the case that did not consider matrix shrinkage.
Fig 5. Pressure change curve at point 1.
doi:10.1371/journal.pone.0152066.g005
Fig 6. Permeability change curve at point 1.
Fig 7. Pressure change curve at point 2.
doi:10.1371/journal.pone.0152066.g007
Fig 8. Permeability change curve at point 2.
Fig 9. Pressure change curve at point 3.
doi:10.1371/journal.pone.0152066.g009
Fig 10. Permeability change curve at point 3.
Fig 11. Comparison of daily gas rate.
doi:10.1371/journal.pone.0152066.g011
Fig 12. Comparison of cumulative production.
Conclusions
A coupled mathematical model of CO2flooding that considers coal or rock deformation and
multi-physical processes (competitive adsorption, convection-diffusion, seepage) was estab-lished in this paper. Using the simulation software to solve the coupling model, our study emphasized the influence of coal matrix shrinkage on permeability during CO2flooding. The
conclusions have been reached:
1. Based on the initial pressure and the differences in pressure variations during the produc-tion process, the permeability changes caused by matrix shrinkage are spatially variable in the reservoir. The maximum permeability value appears near the production well, and the degree of rebound decreases with increasing distance from the production well.
2. Under the conditions of our study, matrix shrinkage has an galvanizing effect on CO2
-ECBM and increases the daily gas rate during the early production phase. Although the CH4saturation is lower in later stages, resulting in lower daily gas rates, the overall final
yield is greater.
3. In general, permeability in coals is a function of pressure drawdown. In the CO2-ECBM
process, CO2injection changes the distribution of pressure, which changes the permeability
in the reservoir. Therefore, selecting the appropriate well spacing and injection rate based on different reservoir characteristics is necessary to ensure that the CO2injection will
not reduce the permeability of the reservoir and to achieve the optimal effects of CO2
displacement.
Acknowledgments
The research is financially supported by National Natural Science Foundation of China (Grant No. 51174170) and the National Science and Technology Support Program Project (Grant No. 2012BAC26B05).
Author Contributions
Conceived and designed the experiments: GL. Performed the experiments: GL. Analyzed the data: GL. Contributed reagents/materials/analysis tools: JL. Wrote the paper: GL. Assisted in the numerical simulation: YZ. Gave suggestions when analyzing data: YZ.
References
1. Gray I. Reservoir engineering in coal seams: Part 1. The physical process of gas storage and move-ment in coal seams. SPE Reserv Eval Eng. 1987; 2: 28–34.
2. Mavor MJ, Vaughn JE. Increasing coal absolute permeability in the San Juan Basin fruitland formation. SPE Reserv Eval Eng. 1998; 1: 201–206.
3. Palmer I, Mansoori J. How permeability depends on stress and pore pressure in coalbeds: a new model. Proceedings of the SPE Annual Technical Conference and Exhibition; 1996 Oct 6–9; Denver,
CO. Calgary: SPE; 1996. doi:10.2118/36737-MS
4. Kovscek AR, Tang GQ, Jessen K. Laboratory and simulation investigation of enhanced coal bed meth-ane recovery by gas injection. Proceedings of the SPE Annual Technical Conference and Exhibition; 2005 Oct 9–12; Dallas, TX. Calgary: SPE; 2005. doi:10.2118/95947-MS
5. Karacan CO. Heterogeneous sorption and swelling in a confined and stressed coal during CO2
injec-tion. Energy Fuels. 2003; 17: 1595–1608. dio: doi:10.1021/ef0301349
6. Gensterblum Y, Hemert PV, Billemont P. The relationship between permeability and effective stress for Australian coal and its implications with respect to coalbed methane exploration and reservoir model.
for ECBM. International Journal of Coal Geology. 2008; 74: 123–138.
12. Ronny P, Dorian M, Luigi B. Coal characterization for ECBM recovery: Gas sorption under dry and humid condition, and its effect on displacement dynamics. Energy Procedia. 2011; 4: 2157–2161. doi:
10.1016/j.egypro.2011.02.101
13. Sander H, Yves G, Paul M. Sorption and changes in bulk modulus of coal—experimental evidence and
governing mechanisms for CBM and ECBM applications. International Journal of Coal Geology. 2014; 128: 119–133. doi:10.1016/j.coal.2014.04.010
14. Li D, Liu QF, Weniger P. High-pressure sorption isotherms and sorption kinetics of CH4 and CO2 on coals. Fuel. 2010; 89: 569–580. doi:10.1016/j.fuel.2009.06.008
15. Syed A, Shi JQ, Durucan S. Permeability and injectivity improvement in CO2 enhanced coalbed meth-ane recovery: thermal stimulation of the near wellbore region. Energy Procedia. 2011; 98(4): 2137–
2143. dio: doi:10.1016/j.egypro.2011.02.098
16. Zhou FD, Hou WW, Allinson G. A feasibility study of ECBM recovery and CO2storage for a producing
CBM field in southwest Qinshui basin, china. International Journal of Greenhouse Gas Control. 2013; 9: 26–40. doi:10.1016/j.ijggc.2013.08.011
17. Kumar H, Elsworth D, Mathews JP. Effect of CO2 injection on heterogeneously permeability coalbed reservoir. Fuel. 2014; 135: 509–521. doi:10.1016/j.fuel.2014.07.002
18. Mohammad S, Alireza K. Investigation of varying-composition gas injection for coalbed methane recov-ery enhancement: A simulation-based study. Journal of Natural Gas Science and Engineering. 2015; 27: 1205–1212. doi:10.1016/j.jngse.2015.09.071
19. Dutta P, Zoback MD. CO2sequestration into the wyodak coal seam of powder river basin-preliminary
reservoir characterization and simulation. International Journal of Greenhouse Gas Control. 2012; 9: 103–116. doi:10.1016/j.ijggc.2012.03.004