Abstract
One of the main challenges for engineers in designing high-speed crafts is the evaluation of hydrodynamic loads during the impact of hull to wave’s surface. This paper presents an experimental investi-gation on the pressure distribution on three wedge-sections with 15°, 20° and 30° deadrise during water-entry. Assessment of pres-sure distribution on the effects of parameters such as drop heights, deadrise angles and the weights of the models had done. Time histories of impact pressure were recorded. It was showed that, the maximum pressure for 20° wedge had increased 2.4 times in com-parison with 30° wedge while this number is 1.23 time for the 15° wedge. But the effects of weight and drop height were not as much as deadrise angle.
The results give an appropriate approximation of the maximum pressures by the model resembling high-speed craft’s hull sections, which can be used to estimate impact loads in different operational condition. The condition of water level during the impact process has also been observed in each test. The nature of impact test with non-constant speed can clarify the real behavior of falling objects, which can be assumed as the significance of current study.
Keywords
Water impact, Wedge, Pressure, High speed craft, Slamming
Investigation of Wedge Water-Entry Under Symmetric
Impact Loads by Experimental Tests
1 INTRODUCTION
Determination of hydrodynamic loads during impact is one of the challenging subjects for structural engineers in designing optimum structures of high-speed crafts. The structure of these vessels should have enough strength to resist dynamic impact loads, as well as minimum weight.
M. Nikfarjam a O. B. Yaakob a,b M. S. Seif c J. Koto d
a Faculty of Mechanical Engineering,
Universiti Teknologi Malaysia, [email protected]
b Marine Technology Centre, Universiti
Teknologi Malaysia, [email protected] c Department of Mechanical Engineering,
Sharif University of Technology, Center of Excellence In Hydrodynamics and Dynamics of Marine Vehicles, I.R.Iran, [email protected]
d Faculty of Mechanical Engineering,
Universiti Teknologi Malaysia, [email protected]
http://dx.doi.org/10.1590/1679-78253315
The complex fluid-structure interaction that occurs in the process of water-entry phenomena should be evaluated by analyzing the impact pressures which act on the hull sections of the craft. Due to difficulty of conducting real test using real vessel, the evaluation of two-dimensional water impact of simple geometries such as wedges can be simplified by using models to estimate the gen-eral hydrodynamic behavior of hull.
This paper presents an investigation into water impact problem of symmetric wedges with dif-ferent deadrise angles through experimentation, which can assist to improve the accuracy of estima-tion of hydrodynamic loads in the design phase of high-speed crafts.
Von-karman (1929) was the first researcher who developed a theoretical method for impact pres-sure based on momentum theorem and water added mass assumptions. He considered 2D sections of a seaplane during landing and derived simple formulas for estimation of impact pressure. This simple approach was continued by Wagner (1932), Payne (1988), Korobkin and Pokhnachov (1988) who considered water splash effect and impact pressures on the wetted width of various 2D sections.
Dobrovolskaya (1969) developed the first analytical solution for a solid wedge entering into wa-ter vertically, but since it needed to be solved by complex numerical methods, it had some limita-tions. After 1990, researchers are progressively finding simple and practical methods to estimate hydrodynamic impact loads for use in designing marine vehicles. For example, Zhao and Faltinsen (1993, 1996) and Mei et al. (1999) proposed a linear approximation of water level for 2D geometries. Besides these theoretical and numerical methods, experimental tests had been conducted for similar problems to validate the results. For example, Bisplinghoff and Doherty (1950), Chuang (1967, 1970 and 1973), Ochi and Bonilla (1970), Greenhow and Lin (1983) conducted experimental tests on rigid bodies while considering different parameters such as deadrise angles, weight, impact velocity, and also tried to improve the results of previous numerical analysis.
but the proposed method had not been explained deliberately. Sayeed et al. (2010) evaluated the slamming force on wedge with 10° deadrise and their results showed good correlation with Chaung's (1973) experimental data. The approach of using drop test was used by Peng et al. (2011) to show the value of slamming loads on the multi-hull crafts. They investigated the distribution of impact loads and its dependence on impact velocity. Numerical study was conducted by using finite ele-ment method, which showed an increasing trend of slamming pressure of main hull and cross struc-ture with the increase of impact velocity. Another significant research on experimental investigation on water impact was done by Huarte et al. (2011). They conducted experiments on the characteri-zation of flat plate’s impact loads, and found prominent results about trapped air and its effect on impact pressure.
Kwon et al. (2013) presented the results of experimental and numerical works on slamming loads and proved that their data can be used to analyze of slamming problems with good reliability. Shah et al. (2015) continued using the combined experimental and numerical approaches to analyses the im-pact behavior of wedge’s water-entry, and then proposed data for evaluation of aircraft ditching. In this study, the water-entry process for symmetric solid wedges with deadrise of 15°, 20° and 30° had been evaluated through experimental tests. Based on current results, the estimation for hydro-dynamic loads on 2D sections of typical high-speed crafts can be proposed for using in design phase for these types of marine vehicles.
With determination of maximum pressure and pressure coefficient for various models the data can be used for corresponding sections in marine vehicles to estimate the hydrodynamic loads that lead to optimum structural design. A significance of the current study is consideration of water-entry process with non-constant speed, which can be used to estimate pressure in real condition, even with different parameters such as weights and drop heights. Analyses of wedge impact had been carried out by Dobrovolskaya (1969), Mei (1998) and Mei et al. (1999) before, with considera-tion of constant speed.
2 THE EXPERIMENTAL SETUP
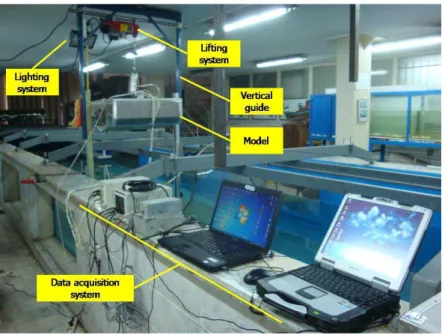
Experiments were carried out using specialized test-setup installed in the marine laboratory of Sha-rif University of Technology. This setup has a drop tower with two parallel fixtures fixed on top of the water tank. For evaluation of pressure on the wedges, 3 models with different deadrise angles were constructed from 4 mm marine aluminum plate and were stiffened to be adequately rigid. The models were attached to the sliding trolley, which was connected to the parallel fixture, as shown in Figure 1.
The general view of test setup is shown in Figure 2. The length of channel was 25 m and the width was 2.5 m, long and wide enough to prevent the reflected waves from hitting the model. The water height was 1.5 m. Two plates were installed on opposite sides of models to satisfy 2D effects. The wall effect should be at minimum, thus the clearance between the side walls of basin and the model was adjusted. The parameter of normalized wall clearance is defined as the ratio of the clear-ance between model and basin’s wall (w) to the basin’s width (WB).
w
Normalized wall clearance
W
Figure 1: Main configuration of the test setup.
The characteristics of the models and test conditions are illustrated in Table 1. The total weight of empty models was about 16 kg, and some additional weights were used to obtain the desired weight. The center of gravity was considered in middle of the models.
Model Deadrise
angle (°)
Weight (kg)
Drop height (cm)
1 15
20, 26, 30 50, 75, 100
2 20
3 30
Table 1: Characteristics of models.
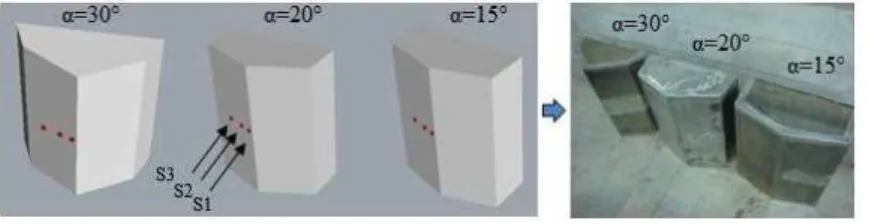
The general view of models is depicted in Figure 3. The selected dimensions for the models were appropriate for comparison of results with those in other published documents, such as models used by Yettou et al. (2005). Three PCB piezoelectric pressure sensors were installed on one side of the wedges to measure the time-variation of dynamic pressures. The position of sensors is shown in Figure 3, denoted as S1-S3, to measure pressures at P1, P2, P3 respectively (Figure 4).
Figure 3: General view of models.
The pressure sensors were set to have the ability of measuring small fluctuations at high levels, for pressure up to 1000 psi with accuracy range of 0.001 psi (1 psi=1 lb/in2=6894.76 N/m2). The diameter of the sensors was 3.5 mm, and they were installed on the center line of wedge in one side, as shown in Figure 4 (all dimensions are in mm). The resonant frequency of the sensors was over 500 KHZ and the data acquisition rate used was 25kHz.
Figure 4: Position of installed pressure sensors on the model.
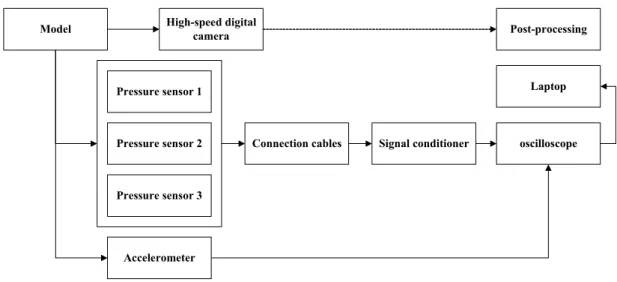
Figure 5: Connection diagram of the data acquisition system.
For detection of water level at the moment of impact, a high-speed digital camera with maxi-mum frame speed of 80 frames per second and maximaxi-mum resolution of 512x240 was installed at water level with suitable lighting system.
According to characteristics of models as specified in Table 1, nine models for each deadrise an-gle were considered for use in the experiments, with different weights and drop heights. Therefore, 27 tests had been accomplished, denoted using unique code as D*-W*-H*; the first indicator denotes the deadrise angle, the second indicator denotes the weight in kg and the last indicator denotes the drop height in cm. For example, D30-W30-H100 is a test of 30° wedge with 30 kg weight, dropped from 100 cm.
Each test was repeated three times, then averaged as final data. The standard deviation of re-sults for each test was considered 5-7%.
3 RESULTS AND DISCUSSION
This section presents the test’s results with respect to different parameters affecting wedge water-entry. To analyze the dynamic behavior of models, two non-dimensional coefficients (non-dimensional impact depth, Z and pressure coefficient, CP) were defined as in Equations (2) and (3):
H
Z
V
t
(2)2
0.5
P
P
C
V
(3)where H, V,
and t are drop height,impact velocity, water density and impact time, respectively and P is impact pressure. The variation of CP in comparison with Z was assumed as a parameter toestimate the hydrodynamic behavior of wedges during water impact. Model
Pressure sensor 1
Pressure sensor 2
Pressure sensor 3
Connection cables Signal conditioner oscilloscope
Laptop High-speed digital
camera
Accelerometer
3.1 The Effect of Deadrise Angle on Maximum Pressure
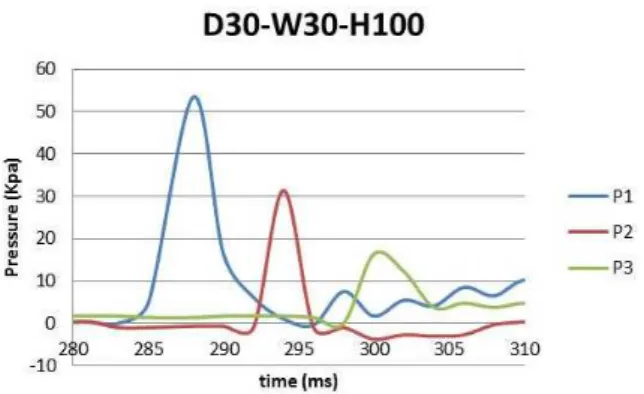
Figures 6-8 show the time variation of pressure for the models with different deadrise angles when dropped from highest distance (100 cm) with heaviest weight (30 kg). The vertical axis shows the peak pressure in Kpa and the horizontal axis indicates the time. P1, P2 and P3 represent the pres-sures which were measured by S1, S2 and S3, with reference to Figures 3 and 4.
Figure 6: Pressure distribution for test D15-W30-H100 in Kpa.
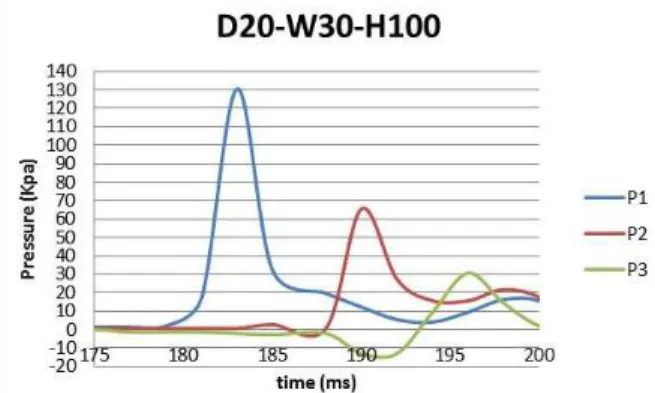
Figure 7: Pressure distribution for test D20-W30-H100 in Kpa.
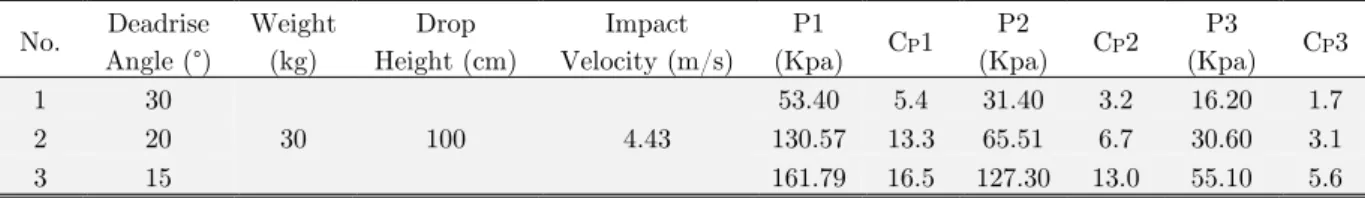
The figures show that, when the wedge came into contact with the water surface, the pressure distribution began by rising to sharp peaks, but decreased drastically after some fluctuations. The maximum pressures measured by S1 after contact were 53.4 Kpa for 30° wedge, 130.5 Kpa for 20° and 161.7 Kpa for 15° wedges. These values are shown in column S1 of Table 2, which also shows readings for the other two pressure sensors. As it can be found, the maximum pressure for 20° wedge had increased 2.4 times in comparison with 30° wedge while this number is 1.23 time for the 15° wedge. The minus pressure which can be seen before peak pressure was occurred due to increase in water velocity around the sensors that affect the pressure values.
In current experiments it was shown that the peak pressure is principally governed by the deadrise angle and the shape of the wedge. This conclusion was shown before by Yettou et al. (2005). When the deadrise angle increase, the projected area will decrease and the impact pressure will be smaller than the model with higher deadrise angle.
Table 2 shows the values of maximum pressures and pressure coefficients for different sensors. According to the data, the maximum values of pressure and pressure coefficients were strongly cor-related to the deadrise angle, where maximum pressure increased as the angle was reduced. Data plotted in Figure 9 shows that overall trend of the above data was similar even by different sensors. Therefore, it is clear that deadrise angle had considerable effect on the maximum pressure of differ-ent models.
No. Deadrise Angle (°)
Weight (kg)
Drop Height (cm)
Impact Velocity (m/s)
P1
(Kpa) CP1 P2
(Kpa) CP2 P3
(Kpa) CP3
1 30
30 100 4.43
53.40 5.4 31.40 3.2 16.20 1.7
2 20 130.57 13.3 65.51 6.7 30.60 3.1
3 15 161.79 16.5 127.30 13.0 55.10 5.6
Table 2: Values of maximum pressure from different sensors.
Figure 9: Effect of deadrise angle on the maximum pressure.
3.2 The Effect of Impact Velocity and Weight of Models on Maximum Pressure
The figures show that the pressure distribution for 30° wedge during the impact with different velocities had the same trend as the data discussed in Section 3.1.
Figure 10: Pressure distribution for test D30-W30-H50.
Figure 11: Pressure distribution for test D30-W30-H75.
Figure 12: Pressure distribution for test D30-W30-H100.
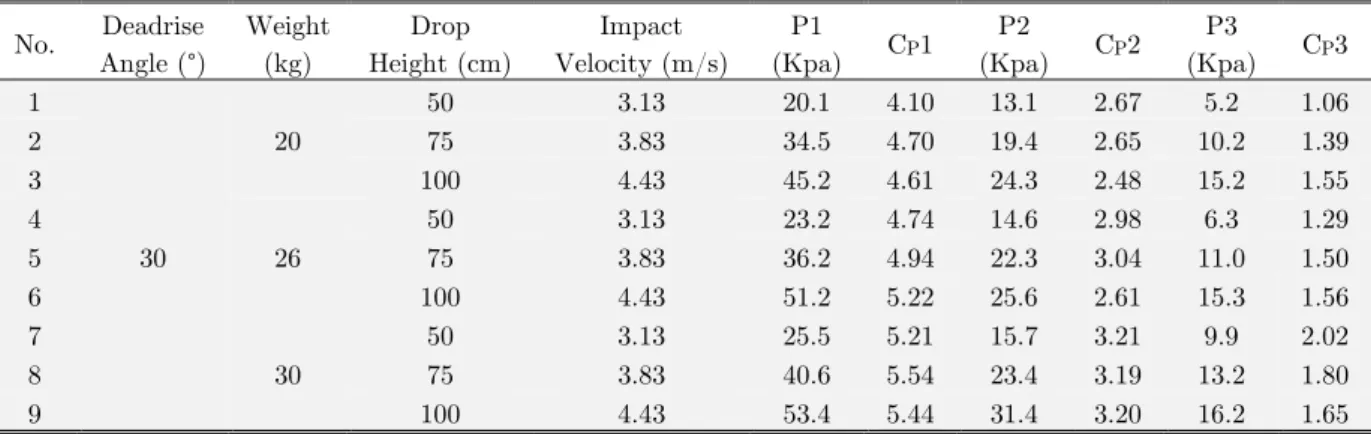
pressure and pressure coefficient for different weights and impact velocities during the test of 30° wedge.
No. Deadrise Angle (°) Weight (kg) Drop Height (cm) Impact Velocity (m/s) P1
(Kpa) CP1 P2
(Kpa) CP2 P3
(Kpa) CP3 1
30
20
50 3.13 20.1 4.10 13.1 2.67 5.2 1.06
2 75 3.83 34.5 4.70 19.4 2.65 10.2 1.39
3 100 4.43 45.2 4.61 24.3 2.48 15.2 1.55
4
26
50 3.13 23.2 4.74 14.6 2.98 6.3 1.29
5 75 3.83 36.2 4.94 22.3 3.04 11.0 1.50
6 100 4.43 51.2 5.22 25.6 2.61 15.3 1.56
7
30
50 3.13 25.5 5.21 15.7 3.21 9.9 2.02
8 75 3.83 40.6 5.54 23.4 3.19 13.2 1.80
9 100 4.43 53.4 5.44 31.4 3.20 16.2 1.65
Table 3: Value of maximum pressure and pressure coefficient for different weights and impact velocities (For 30° wedge).
Pressure coefficients from Table 3 are plotted in Figure 13. It can be seen that the values of pressure coefficient for specific weights and different impact velocities had similar magnitude but they did not follow the same trend. This means that the differences between values of CP could not
follow a specific order, and for this reason it would become less important for the analysis of water-entry problems.
Figure 13: Effect of drop heights on maximum CP in different weights for 30° wedge.
The mass of the model does not show a significant influence on the peak pressure in comparison with deadrise angle because the impact velocity which affecting the pressure is depended to drop height. For this reason, the weight of model was negligible in comparison with the others for analy-sis of hydrodynamic impact pressure.
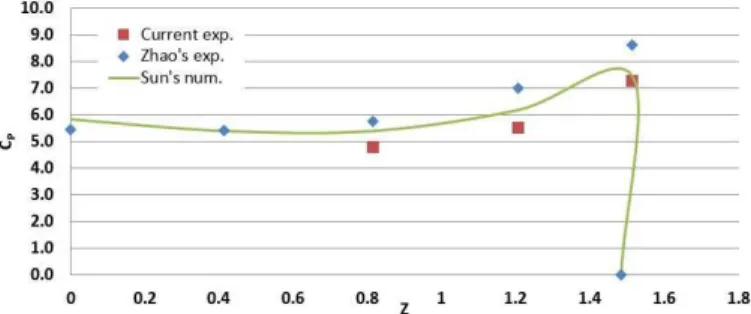
3.3 The Effect of Non-Dimensional Depth on Maximum Pressure
(1997). The CP values for the three points measured in the current experimental tests are specified
on the graph, and generally have good agreement between results. However, the peak pressure coef-ficient for the current experiments was 18% less than the data obtained by Zhao. In addition, the current data had been compared to the results obtained by Sun (2007), which were derived from numerical simulations by boundary element method. The difference between results of current ex-perimental tests in comparison with other two methods might be due to their assumption of con-stant speed, while the current tests considered free falling condition.
Figure 14: Distribution of CP in comparison with Z for a 30° wedge.
Based on the comparison with the other two solutions assuming a constant velocity, it can be concluded that more realistic approaches need to be developed for estimation of impact pressure during water-entry process.
4 CONCLUSIONS
In the current study, the distribution of pressure for three wedges with different deadrise angles has been investigated during the water-entry process by experimental drop tests. To determine the ef-fect of weight and impact velocity, pressure sensors have been installed to measure impact pressures acting on the models. The values of measured pressures have been compared with another two ex-perimental and numerical approaches. The analysis of the problem has yielded the following results: • Deadrise angle of wedges has significant effect on maximum impact pressure, and for specific
impact velocity, when the deadrise angle is increased, the maximum pressure will decrease significantly. As it was described, the maximum pressure for 20° wedge had increased 2.4 times in comparison with 30° wedge while this num-ber is 1.23 time for the 15° wedge.
• Weight of model has less effects on maximum pressure.
• Non-dimensional depth in current experiment has shown good agreement in comparison with the results of similar experimental and numerical methods, which means it can be used to ex-tend the data in computational problems.
im-List of Symbols
w Clearance between model and basin’s
wall
WB Basin’s width
S Sensor’s number
W Weight of model
H Drop height
P Impact pressure
t Impact time
CP Pressure coefficient
Z Non-dimensional depth
V Impact velocity
Greek symbols
Deadrise angle
Water densityReferences
Bisplinghoff, R.L., Doherty, C.S. (1952). Some studies of the impact of vee wedges on a water surface. Journal of the Franklin Institute, 253(6), 547-561.
Chuang, S.-L. (1967). Experiments on slamming of wedge-shaped bodies. Journal of Ship Research, 11(3), 190-198. Chuang, S.L. (1970). Investigation of impact of rigid and elastic bodies with water. (No. NSRDC-3248). David W Talornaval ship research and development center Bethesda MD.
Chuang, S.L. (1973). Slamming tests of three-dimensional models in calm water and waves. (No. DTNSRDC/SD-4095). David W Talor naval ship research and development center Bethesda MD structure Dept.
Dobrovolskaya, Z.N. (1969). On some problems of similarity flow of fluid with a free surface. Journal of Fluid Me-chanics, 36(4) , 805-829.
Engle, A., & Lewis, R. (2003). A comparison of hydrodynamic impacts prediction methods with two dimensional drop test data. Marine structures, 16(2), 175-182.
Faltinsen, O. M., Landrini, M., & Greco, M. (2004). Slamming in marine applications. Journal of Engineering Math-ematics, 48(3-4), 187-217.
Greenhow, M., Lin, W.M., (1983). Nonlinear-free surface effects: experiments and theory (No. 83-19). Massachusetts Inst. Of Thec. Cambridge Dept. of Ocean Engineering.
Huera-Huarte, F. J., Jeon, D., & Gharib, M. (2011). Experimental investigation of water slamming loads on panels. Ocean Engineering, 38(11), 1347-1355.
Korobkin, A.A., Pokhnachov, V.V. (1988). Initial stage of water impact. Annual review of fluid mechanics, 20(1), 159-185.
Kwon, S. H., Yang, Y. J., & Lee, H. S. (2013). Experimental and Numerical Study on Slamming Impact. Journal of Ocean Engineering and Technology, 27(1), 1-8.
Lin, M. C., & Shieh, L. D. (1997). Simultaneous measurements of water impact on a two-dimensional body. Fluid Dynamics Research, 19(3), 125-148.
Mei, X., Lui,Y.,Yue, D.K. P.(1999). On the water impact of general two-dimensional sections. Applied Ocean Re-search 21(1), 1-15.
Ochi, M.D., Bonilla-Norat, J. (1970). Pressure-velocity relationship in impact of a ship model dropped onto the water surface and in slamming in waves. (No. NSRDC-3153). naval ship research and development center Washington DC. Payne, P.R. (1988). Design of High Speed Boats, Volume 1: Planing. Fishergate Inc., Annapolis, Maryland.
Peng, S., Sun, H., Pan, J., Xia, Z., & Wu, W. (2011). Experimental Study and Numerical Simulation on Slamming of Trimaran. In The Twenty-first International Offshore and Polar Engineering Conference. International Society of Offshore and Polar Engineers.
Sayeed, T. M., Peng, H., & Veitch, B. (2010). Experimental investigation of slamming loads on a wedge. In Proceed-ings, International Conference on Marine Technology, MARTEC, Dhaka.
Shah, S. A., Orifici, A. C., & Watmuff, J. H. (2015). Water Impact of Rigid Wedges in Two-Dimensional Fluid Flow. Journal of Applied Fluid Mechanics, 8(2).
Sun, H., (2007). A boundary elementmethod applied to strongly nonlinear wavebodyinteraction problems, Ph.D thesis, Norwegian University of Science andTechnology, Trondheim.
Von-karman, T. (1929). The impact on seaplane floats during landing, National Advisory Committee for Aero-nautics: NACATN321. p. 2–8.
Wagner, H. (1932).Landing of Seaplanes,National AdvisoryCommittee for Aeronautics (NACA). Technical Memo-randum no. 622.
Wu, G. X., Sun, H., & He, Y. S. (2004). Numerical simulation and experimental study of water entry of a wedge in free fall motion. Journal of Fluids and Structures, 19(3), 277-289.
Yettou, E. M., Desrochers, A., & Champoux, Y. (2006). Experimental study on the water impact of a symmetrical wedge. Fluid Dynamics Research, 38(1), 47-66.