Lucía Benavente Briano
Graduated in Food Engineering
Production of Ellagitannins Concentrate
by UF
-
NF from Tropical Highland
Blackberries
Dissertation for obtaining the Master degree in Membrane
Engineering
Erasmus Mundus Master in Membrane Engineering
Advisor: Dr. Fabrice Vaillant, Professor, CITA-UCR/CIRAD
Co-advisor(s): Isabel Coelhoso, Professor, FCT-UNL
João G. Crespo, Professor, FCT-UNL
Jury:
President: Isabel Coelhoso, Professor, FCT-UNL Examiner(s): Dr. André Ayral, Professor, Université Montpellier 2
Dr. Patrice Bacchin, Professor, Université Paul Sabatier Dr. Karel Bouzek, Professor, ICT Prague Dr. Claudia Galinha, Post-Doc Researcher, FCT-UNL
Member(s): João Crespo, Professor, FCT-UNL
Lucía Benavente Briano
Graduated in Food Engineering
PRODUCTION OF
ELLAGITANNINS
CONCENTRATE BY UF
-
NF
FROM TROPICAL HIGHLAND
BLACKBERRIES
Dissertation presented to Faculdade de Ciências e Tecnologia, Universidade Nova de Lisboa for obtaining the master degree in Membrane Engineering
PRODUCTION OF ELLAGITANNINS CONCENTRATE BY UF-NF FROM TROPICAL HIGHLAND BLACKBERRIES
The EM3E Master is an Education Programme supported by the European Commission, the European Membrane Society (EMS), the European Membrane House (EMH), and a large international network of industrial companies, research centres and universities (http://www.em3e.eu).
Copyright @ Lucía Benavente Briano, FCT/UNL
A Faculdade de Ciências e Tecnologia e a Universidade Nova de Lisboa têm o direito, perpétuo e sem limites geográficos, de arquivar e publicar esta dissertação através de exemplares impressos reproduzidos em papel ou de forma digital, ou por qualquer outro meio conhecido ou que venha a ser inventado, e de a divulgar através de repositórios científicos e de admitir a sua cópia e distribuição com objectivos educacionais ou de investigação, não comerciais, desde que seja dado crédito ao autor e editor.
I
Acknowledgements
To my family: you were always there for me, even when oceans and continents lied between us; thank you very much for all your support and love.
To my advisor Dr. Fabrice Vaillant, thank you for your time, trust, guidance and support. I also want to thank Dra. Ana Mercedes Pérez and Dr. Max Reynes, without your experience and inputs this work would not have been the same.
To the rest of the CITA personnel: thank you very much for assisting me during my stay in Costa Rica. Special mentions to Juan Carlos, Camacho, Alonso, Graciela and Marielos, and for all of you that somehow helped me to conclude with the thesis.
To the whole EM3E organization: thank you for giving me chance of being here and getting soaked with membrane technology, specially to Dr. André Ayral and Mª Elena Vallejo. Special thanks to Dr. Gilbert Rios, who kindly contacted me with the people here in Costa Rica. I also want to mention my Portugal teachers: Isabel Coelhoso, Joao Crespo and all the other UNL people for your guidance.
To my special assistants/friends: Carla and Rita. Without you helping me and getting bathed and stained with blackberry juice this would have not been possible.
II
Abstract
Tropical highland blackberries are produced in Costa Rica and other tropical countries. Since weather conditions in tropical regions are more stressful than in temperate ones, polyphenol content in blackberries is hypothetically higher for tropically grown fruits.
Ellagitannins are hydrolysable tannins – polyphenols – that have been studied lately due to their health beneficial properties, such as antioxidants, cancer treatment agents and cardiovascular health improvers.
The concentration of such components by low-ultrafiltration/nanofiltration technologies is of great interest since low processing temperatures are used. Therefore, thermal labile components are not lost due to heat. CITA and CIRAD have issued a patent for using membrane technologies for the production of fruit juices and concentrate by using mostly membrane technology.
The results show that it is possible to concentrate ellagitannins in blackberry up to a concentration 5-times higher than the one in the initial clarified juice with a ceramic membrane at 30ºC, with a VRF of 11. Retentions of up to 99 % were obtained for anthocyanins and ellagitannins. The initial estimate of production cost per kilogram of product is of 34 U$S/kg and assuming a sales price of 72 U$S/kg of product the payback time for an investment of nearly 165,000 U$S and a consumption of 2000 kg/day of blackberries is of two and a half months.
The preliminary stability study showed that there is a need for further stabilization steps in order to assure the quality of concentrate, since polyphenol content decreased by 28%, anthocyanins by 52% and the ellagitannin estimate reduction percentage was of 22%, for a storage at 37ºC for a 5-week period.
All in all, it was possible to study the concentration of ellagitannins from blackberry clarified juice in a pilot scale.
III
Index of Figures
Figure 1. Classification of the tannins ... 5
Figure 2. Some examples of Ellagitannins . ... 6
Figure 3. Ellagitannins in Blackberry ... 8
Figure 4. Schematic diagrams of the principal types of membranes ... 10
Figure 5. Examples of an Plate-and-Frame design. ... 11
Figure 6. Tubular Ceramic membrane. ... 12
Figure 7. Spiral wound module diagram. ... 13
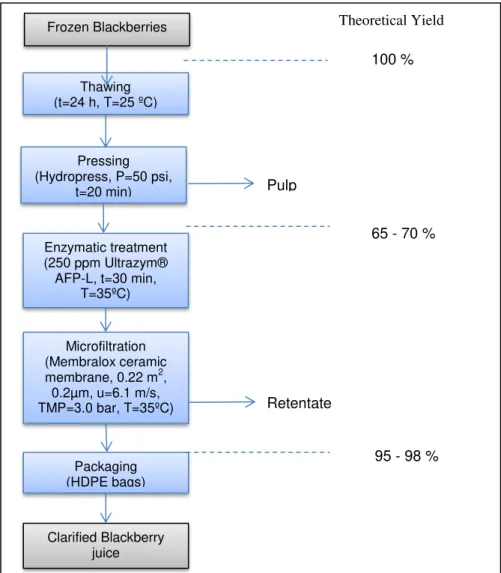
Figure 8. Process flow and Theoretical yields for the production of Clarified Blackberry Juice. ... 16
Figure 9. Views of the filtration equipment. ... 17
Figure 10. Ultrafiltration equipment diagram. ... 18
Figure 11. Ellagic acid concentration ratio vs. VRF for the different membranes for the concentrate.. 24
Figure 12. Cyanidin-3-glucoside concentration ratio vs. VRF for the different membranes for the concentrate ... 25
Figure 13. Retention coefficient of Ellagic acid vs. VRF for the different membranes.. ... 27
Figure 14. Retention coefficient of Cyanidin-3-glucoside vs. VRF for the different membranes. ... 28
Figure 15. Stability study results for acidity, pH and ºBrix. ... 29
Figure 16. Stability study results for total anthocyanins, total polyphenols and the estimate of ellagitannin content. ... 29
Figure 17. Process Diagram for the production of Blackberry concentrate ... 31
Figure 18. Gannt diagram of daily plant operation. ... 32
Figure 19. Distribution of the sales ... 36
IV
Index of Tables
Table 1. Description of the membranes used for the concentration of ellagitannins. ... 17
Table 2. Summary of operational parameters for each membrane for the concentration of ellagitannins in blackberries. ... 23
Table 3. Membrane area required for a permeate flux of 100 L/h, operating at a pressure of 6 bar and temperature of 30 ºC. ... 24
Table 4. Maximum polyphenol recovery in the concentrate for each membrane. ... 26
Table 5. Investment needed for the installation of a polyphenol-rich blackberry extract processing plant. ... 33
Table 6. Purchases needed for production line. ... 34
Table 7. Water and Electricity consumption ... 34
Table 8. Other costs ... 35
Table 9. Personnel: amount and salaries. ... 35
V
Abbreviations
ANOVA : Analysis of Variance ºC : Degrees Celsius
CITA : Centro Nacional de Ciencia y Tecnología de Alimentos (Universidad de Costa Rica) CIRAD : Centre de coopération internationale en recherche agronomique pour le développement CV : Coefficient of Variation
Da : Daltons DF : Diafiltration ED : Electrodialysis gal : US gallon GS : Gas Separation
h : Hours
ha : Hectare
HDPE : High-density polyethylene HHDP : Hexahydroxydiphenic acid
HPLC : High-performance liquid chromatography JP : Permeate flux
kDa : Kilo Daltons = 1000 Daltons L : Liters
m : Meters
MF : Microfiltration mg : Milligram µm : Micrometer
MWCO : Molecular weight cut-off NF : Nanofiltration
nm : Nanometer ppm : Parts per million PV : Pervaporation RO : Reverse Osmosis
s : Seconds
TMP : Transmembrane pressure UF : Ultrafiltration
VRF : Volume Reduction Factor
VI
Table of Contents
Acknowledgements ... I Abstract... II Index of Figures ... III Index of Tables ... IV Abbreviations ... V Table of Contents ... VI
1 Introduction ... 1
1.1 Background and Motivation ... 1
1.2 Objectives ... 2
2 Literature Review ... 4
2.1 Blackberries ... 4
2.2 Ellagitannins ... 4
2.3 Membrane Technology ... 8
2.3.1. Introduction ... 8
2.3.2. Membrane Materials and Types ... 9
2.3.3. Membrane Modules ... 11
2.3.4. Membrane Processes ... 13
2.3.4. Applications ... 14
2.4 Recovery of Ellagitannins with Membrane Technology ... 15
3 Materials and Methods ... 16
3.1 Raw Material ... 16
3.2 Production of the Clarified Blackberry Juice ... 16
3.3 Concentration of the Ellagitannins in Blackberry ... 17
3.4 Stability Study ... 18
3.5 Analysis ... 19
3.5.1. Polyphenol content (HPLC) ... 19
3.5.2. Total anthocyanin content ... 19
VII
3.5.4. Total polyphenol determination ... 20
3.5.5. pH determination ... 21
3.5.6. Titrable acidity determination ... 21
3.6 Calculations ... 21
3.7 Statistical Analysis ... 22
4 Results and Discussion ... 23
4.1 Evaluation of three different membranes for the concentration of the ellagitannins from tropical highland blackberries. ... 23
4.2 Stability evaluation of the concentrate. ... 28
4.3 Cost Evaluation of the process. ... 30
4.3.1. Generalities ... 30
4.3.2. Investment ... 32
4.3.3. Production Cost and Product Price ... 33
4.3.4. Payback time, Costs distribution and Margin. ... 35
5 Conclusions and Future Perspectives ... 38
1
1
Introduction
1.1 Background and Motivation
Health concerns and how to improve our daily nutrition has been rising in the past few years. Moreover, the issue of staying young and battle diseases by complementing medical care with nutritional care is gaining more power each year that passes by.
Modern chemistry has been keen on developing new miracle drugs to battle the growing demand of health quality while modern medicine has developed the treatments we are usually using when going to the doctor.
Nature has always been the first source of our knowledge, first by directly extracting the compounds of interest from fruits, trees, and so on. Further development of chemistry led to the mimicking of such compounds in the laboratories and developing new ones based on those first natural ones. However, the consumer’s interests have been leaning towards the return of natural compounds and extracts.
Among some of the natural entities that have been under scrutiny for their advantageous healthy properties, tropical fruits are the subjects of recent studies, especially due their antioxidant and disease preventing properties. Fruits can be consumed as the whole fruit or as preparations, like jams and juices. Extracts that are rich in one or more of the components that are the ones that provide the nutritional and health benefits of tropical fruits can be extracted from the fruit juices and commercialized as natural extracts.
Highland tropical blackberries (Rubus adenotrichus) are recognized for their antioxidant content. It is higher than the antioxidant content of temperate climate blackberries due to the higher exposure to the sun. The compounds that are largely causing the antioxidant activity are polyphenols, mainly ellagitannins and anthocyanins. In Costa Rica blackberries are produced in altitudes between 1400 to 2500 meters over sea level. Blackberries labeled as organic products are mainly exported but the ones that do not qualify for exportation are frozen and sold in the local market. Thus, the Centro Nacional de Ciencia y Tecnología de Alimentos (CITA) is working with these kinds of products in order to revalue them and to be able to be exported to markets such as United States and Europe.
2
nutritional properties of the product, because nutrients are concomitantly degraded with the reduction of microbial charge.
Membrane technology has been used for both microbial stabilization of juices and preparation of natural extracts. The main advantages of this process are the use of near-ambient temperatures and lower to no-need of foreign chemicals for the extraction part, leading to the production of extracts with potentially higher amount of target-components, no decomposition impurities and no risk of presence of extracting solvents. Products can therefore be labeled as “Natural” products.
Within the CITA-CIRAD working framework, a patent has been issued regarding the production of Ellagitannin-rich extracts from blackberries by using filtration technology. The Collaboration led to the development of an innovative process of manufacturing, hereafter, which presents relevant criteria for patenting. The Parties therefore decided to protect their invention in submitting a joint patent application entitled “Method for obtaining an extract rich in tanin of ellagic acid from fruits that contain these compounds, and extract obtained using this method”, hereafter “The Patent”.A patent application for this procedure has been filed to the Costa-Rican Patent Office, under n° 2011-251 on May 12, 2011. This includes the use of microfiltration (MF) as a first step and then a ultrafiltration (UF) to nearly nanofiltration (NF) step in order to concentrate the extract in ellagitannins. Although they have been working and optimized the MF step, the concentration operation needs still to be optimized in terms of which membranes are more suitable for the UF/NF step and to determine the operational costs of the whole process.
Therefore, the aim of this work is to study the concentration step on a pilot-scale ultrafiltration equipment to concentrate the ellagitannins from highland tropical blackberries.
1.2 Objectives
1.2.1. General Objective
The general objective of this master thesis is the preparation of an ellagitannin extract from tropical highland blackberries by using low UF-NF process.
1.2.2. Specific Objectives
The specific objectives include:
a) Evaluation of three different membranes for the concentration of the ellagitannins from tropical highland blackberries.
3 b) Cost Evaluation of the whole process.
The costs of the production will be calculated from the data obtained in previous tests.
4
2
Literature Review
2.1 Blackberries
Blackberries are edible fruits from the Rubus genus in the Rosaceae family. Blackberry plantings have a life of 5 to 20 years depending on the region, type of blackberry grown and productivity (Strik, Clark et al. 2007). The lifecycle of the crop is perennial, thus blackberry production is secured for most of the year. For the case of Costa Rica, the majority of the production lies in the months of March and April. While blackberries for the fresh market are usually hand harvested in the early morning, after the dew is off for quality reasons, most of the blackberry production for processing is harvested by machine, typically at night.
The worldwide production of blackberries for the year 2005 was of 20,035 ha planted with blackberries, which yielded 140,292 ton of these fruits. For the case of Central America, the total cultivated area was of 1640 ha of commercially cultivated blackberries, 1550 ha of which correspond to the cultivated area in Costa Rica. The main cultivation areas include the provinces of Cartago and San José. Only 15 % of the 2004 Costa Rican 1500 ton blackberry production was exported (Strik, Clark et al. 2007).
The importance of blackberries as a quality food lies in the fact that they are rich in polyphenols, with ellagitannins and anthocyanins being the major ones. Polyphenols are known for their antioxidant capacity (Benvenuti, Pellati et al. 2004) acting as radical scavengers and other possible benefits such as anticancer properties and protectors against cardiovascular diseases.
2.2 Ellagitannins
5
While Gallotannins are all those tannins in which galloyl units or their meta-depsidic derivatives are bound to diverse polyol-catechin or triterpenoid units, ellagitannins are those tannins in which at least two galloyl units are C-C coupled with each other and do not contain a glycosidically linked catechin unit (Khanbabaee and van Ree 2001).
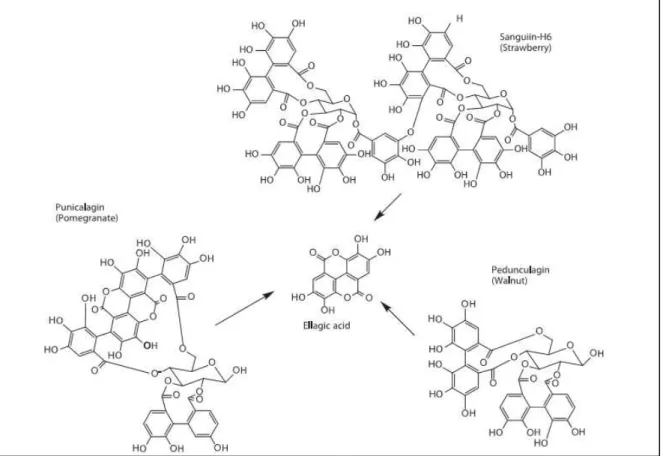
In other words, ellagitannins are polymers of hexahydroxydiphenic (HHDP) acid, which is a dimeric form of gallic acid that can spontaneously lactonize to form ellagic acid (Hager, Howard et al. 2008). There is a great variety of ellagitannin compounds due to the many possibilities for the linkage of HHDP residues with the glucose moiety (Bakkalbasi, Mentes et al. 2009). In Figure 2 some examples are shown. Ellagic acid is one of the products of the acidic hydrolysis of ellagitannins (Bakkalbasi, Mentes et al. 2009). Ellagitannins can be isolated as a comparatively stable compound, which makes them generally different from other types of tannins (Okuda, Yoshida et al. 1989). Ellagic acid should be considered as a compound derived from ellagitannins, since it is rarely found as such in living plants (Okuda, Yoshida et al. 1989).
Tannins
Gallotannins
Ellagitannins
Complex
Tannins
Condensed
Tannins
6
Figure 2. Some examples of Ellagitannins (Larrosa, Garcia-Conesa et al. 2010).
Ellagitannins are present in fruits and nuts including: pomegranates, strawberries, raspberries, blackberries, walnuts, pecan ((Larrosa, Garcia-Conesa et al. 2010), (Bakkalbasi, Mentes et al. 2009), (Mertz, Gancel et al. 2009)).
Tomás-7
Barberán et al. 2006), (Bialonska, Kasimsetty et al. 2009), (Hassimotto and Lajolo 2011), (Rouanet, Décordé et al. 2010), (Larrosa, González-Sarrías et al. 2010), (Aviram, Rosenblat et al. 2004), (Heber, Seeram et al. 2007).
The study of ellagitannin and polyphenol content in pomegranate has been extensively studied, including health-beneficial properties (Faria and Calhau 2010), (Hong, Seeram et al. 2008), (Madrigal-Carballo, Rodriguez et al. 2009), (Seeram, Adams et al. 2005), (Syed, Afaq et al. 2007). It also possible to find commercial extracts and pills from pomegranate that have high-content of polyphenols, being sold at prices ranging from 200 to 1000 U$S per kg of product.
8
Figure 3. Ellagitannins in Blackberry (Adapted from: Hager, Howard et al. 2008).
All of this evidence has made the recovery of ellagitannins from fruits and nuts a very interesting research topic. For the case of blackberries produced in Costa Rica, the creation of ellagitannin-concentrated products implies that blackberries that were initially not suitable to be exported to the United States and European markets can be reintroduced to these markets. Therefore, these kinds of products lead to the addition of value to the production chain of Costa Rican blackberries.
2.3 Membrane Technology
2.3.1. Introduction
9
Nevertheless, membranes have always been a part of nature and of us. Every cell is surrounded by one, from the simplest bacterial cell to the most complex animal cell. Organs act like membranes: our skin protects us from the outer environment by allowing certain compounds to pass and others to stay out; kidneys filter our blood and take toxins out of our bodies and lungs make the oxygenation of the blood possible. What is more, even without knowing it, humans have used membrane technology to produce cheese, clarify beer and wine.
The systematic study of membranes started in the eighteen century with the philosopher scientists (Baker 2004). Experiments were firstly carried out with natural membranes (bladders of pigs, cattle or fish), then in 1907 Bechhold developed a technique to prepare nitrocellulose membranes, but it was not until the 1930s with the efforts of several scientists that microporous colloidon membranes were commercially available. However, major applications for membranes were not possible until the 1960s, since membranes developed until that time were too unreliable, too slow, too unselective and too expensive. Membrane technology suffered a major breakthrough when anisotropic reverse osmosis membranes were developed by Loeb and Sourirajan. The production of defect-free, high-flux, anisotropic reverse osmosis membranes was possible with the called Loeb-Sourirajan process, which impacted both the laboratory and industrial process (Baker 2004). This led to the commercialization of reverse osmosis equipment and the further development of ultrafiltration and microfiltration technologies. Industrial membranes for gas separation were developed in the 1980’s, specially for hydrogen separation, nitrogen separation from air and carbon dioxide separation from natural gas (Baker 2004).
Membranes are structures that separate two phases and allow or slow down the passage of one or more compound from one side to the other. Today membranes are used for a wide variety of processes such as liquid-liquid, gas-liquid, vapor-liquid and gas-gas separations and desalinization among others. Membrane technology allows the separation of components at low temperatures – or lower than the equivalent chemical process-, with little or no use of foreign solvents. Therefore, energy costs can be lowered and high-quality products can be achieved. Some of the disadvantages of membranes are the membrane costs, fouling of the membrane, membrane handling and cleaning and membrane selectivity- to achieve higher selectivities there is a compromise in flux.
2.3.2. Membrane Materials and Types
10
compared with polymeric membranes are the price- they are usually more expensive than organic membranes-, their brittleness and the availability is generally limited for UF or MF applications (Cui and Muralidhara 2010).
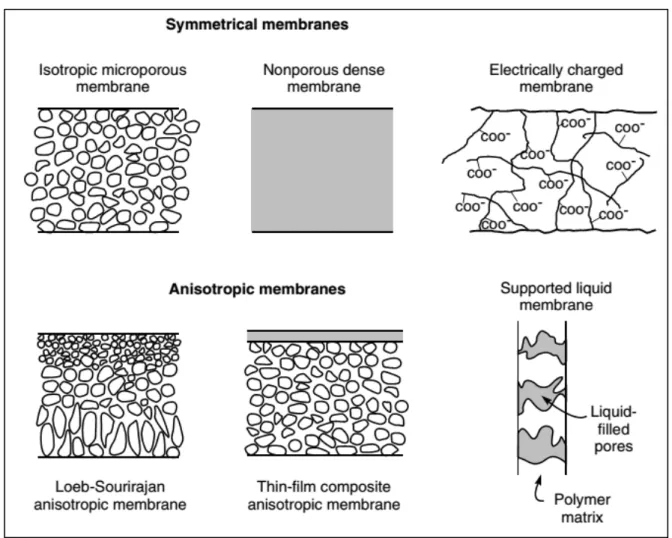
Depending on how these materials are arranged or produced to form the final membrane, different types of membranes can be achieved. Two general groups of membranes can be identified: Symmetrical (isotropic) and Anisotropic membranes (Figure 4).
Figure 4. Schematic diagrams of the principal types of membranes (From:
(Baker 2004)).
11
As stated before, membrane technology was not widely used until the development of anisotropic membranes, since flux is inversely proportional to the membrane thickness. Therefore, in anisotropic membranes different types of materials or particle sizes can be used to assemble the membrane. An isotropic material with a high pore size can be used as the supporting material for the dense active layer. For the case of polymeric anisotropic membranes, the casting method and conditions can create the asymmetry needed to improve the fluxes.
2.3.3. Membrane Modules
The need for higher filtration areas for the industrial applications derived in the arrangement and/or production of membranes in what is called modules. Modules are also designed in order to make scalability easier: they can be connected in series or parallel so membrane area is easily and quickly expanded.
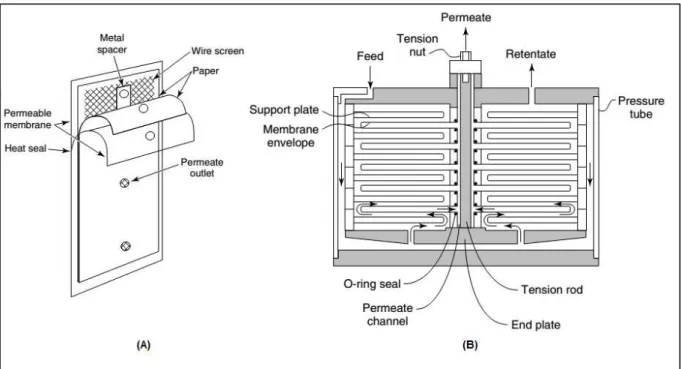
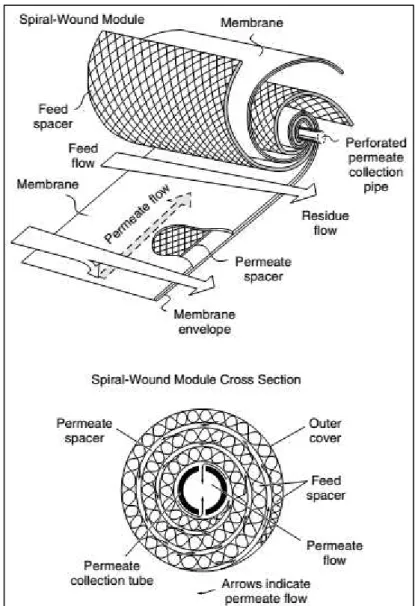
Plate-and-frame modules were the earliest modules developed. They consist of membrane, feed spacers and product spacers layered together between two end plates (Figure 5). Current applications of this kind of module have been decreasing along time because of their cost. However, they are still used in electrodialysis systems and in a limited number of reverse osmosis and ultrafiltration applications (Baker 2004).
Figure 5. Examples of an Plate-and-Frame design (A) and a schematic of a
plate-and-frame module (B). Adapted from: Baker 2004.
12
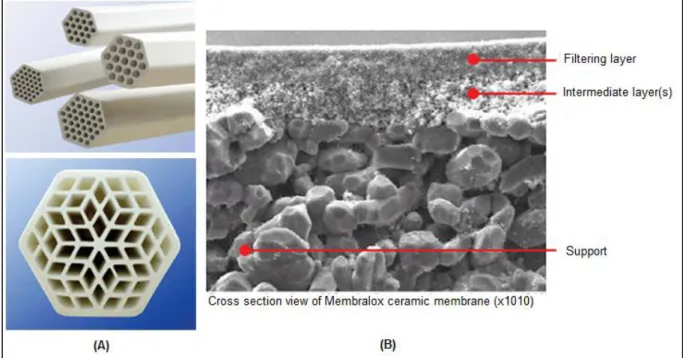
Figure 6. Tubular Ceramic membrane: Examples of Tubular Ceramic membrane
modules (A) and Cross section view of a Ceramic membrane (B). Images taken
from:www.pall.com.
13
Figure 7. Spiral wound module diagram. Taken from: Baker 2004.
Hollow fiber modules are divided into two types: Hollow fine fibers –shell-side feed design- and Capillary fibres –bore-type feed design. The first type cosists in a loop or closed bundle of fibers contained in a pressure vessel. The other type of hollow fibers consist of open fibers at both ends, and the feed is circulated through the bore of the fibers (Baker 2004).
2.3.4. Membrane Processes
Membranes are thin and selective barriers which allow the separation of compounds between to media. The separation is achieved by the application of a driving force. Driving forces can be pressure gradient, temperature gradient, electric field and concentration gradient.
14
widely used for separation or concentration of proteins, UF membranes are also characterized for their molecular weight cut off (MWCO). Diafiltration (DF) is a special process usually used as a complement of UF (or others) in which water or another solvent is added to the system in order to further purify the concentrate – small soluble compounds can be solubilized in the added solvent and pass through the membrane.
Nanofiltration (NF) is a type of pressure-driven membrane process preferably used for water purification. Usual pressure operation values are between 5 and 20 bars. With this kind of membranes it is possible to separate monovalent from divalent ions.
Reverse Osmosis (RO) is a membrane process mostly used for the desalinization of sea water. It is a pressure-driven process in which a pressure higher than the osmotic pressure of the solutions is applied and a selective membrane that rejects solutes (such as NaCl) is used. Pressures can range from 10 up to 100 bars.
In electrodialysis (ED) positively and negatively charged membranes are stacked together - leaving a space between them and an electric potential is used in order to separate charged components. It is generally used for desalination, demineralization and removal of metals. A special type of electrodialysis arrange, electrodeionization, is used for the production of ultra-pure deionized water. Other filtration processes are: Gas Separation (GS) and Pervaporation (PV).
2.3.4. Applications
Applications of membrane technology are varied. For instance, water treatment is one of the major applications for this technology. Wastewater can be treated in membrane reactors and filtered through membranes to meet governmental laws for its final deposition in rivers o other water courses. There are even some controversial plans of turning municipal wastewaters into drinking water in some arid countries by using mostly membrane technology. Moreover, seawater and brackish water can be desalinized with RO membranes, which is a paramount solution in middle-east countries for reaching their drinking water needs. The electronic industry is taking advantage of ultrapure water produced by electrodialysis and electrodeionization technologies that use charged membranes for the further purification of water.
15
In the food industry membranes are being used in the dairy industries – for the cheese manufacturing process, whey processing – and other industries, mostly for the concentration of solutions prior to another process step, such as spray drying. Membrane technology for concentration of thermal labile products is slowly replacing some evaporation processes, specially for small to medium scale plants, where energy consumption has to be lowered to make the process viable. What is more, MF technology is making possible the consumption of products with no or low pasteurization, for instance, microfiltered milk is being commercialized in some countries.
2.4 Recovery of Ellagitannins with Membrane Technology
As mentioned before, the production of ellagitannin-rich extracts from fruits has brought the attention of researchers in recent years. For the case of blackberries in a country such as Costa Rica, it is also a way to put more value to the blackberry-production chain.
A typical process for the production of blackberry products would include thermal operation steps such as blanching, pasteurization and hot-filling. In (Gancel, Feneuil et al. 2011) frozen blackberries are processed with these “traditional” technologies. They found that the reduction of total phenolics in this process can be up to 45 %, where anthocyanins can be reduced up to 46% only with the blanching process and ellagitannins losses were also high (around 80% of lambertianin C and 50% of sanguiin H-6 was lost for the whole process, mainly due to the thermal processes).
16
3
Materials and Methods
3.1 Raw Material
Frozen tropical highland blackberries (Rubus adenotrichus) – organically produced - were bought from Aprocam, Cartago, Costa Rica and stored under frozen conditions until their use. These fruits are harvested in southern San José and Cartago, near Cerro de la Muerte and Zona de Los Santos between 1700 and 2200 meters above sea level.
3.2 Production of the Clarified Blackberry Juice
Frozen tropical highland blackberries were processed according to Figure 8. First, blackberries were defrosted for 24 hours under room temperature. Then, the fruits were pressed with a hydropress, and the resulting juice was treated enzymatically with 250 ppm Ultrazym® AFP-L for 30 minutes at 35 ºC. Finally, the juice was microfiltered through a ceramic membrane Membralox 0.2 µm at a transmembrane pressure (TMP) of 3.0 bar at 35ºC. The microfiltered juice was properly packed in high-density polyethylene (HDPE) bags inside a bucket, labeled and stored at -18ºC until further use.
Frozen Blackberries
Pressing (Hydropress, P=50 psi,
t=20 min)
Enzymatic treatment (250 ppm Ultrazym®
AFP-L, t=30 min, T=35ºC)
Microfiltration (Membralox ceramic membrane, 0.22 m2, 0.2µm, u=6.1 m/s, TMP=3.0 bar, T=35ºC)
Packaging (HDPE bags)
Clarified Blackberry juice
Theoretical Yield
100 % Thawing
(t=24 h, T=25 ºC)
65 - 70 %
95 - 98 % Retentate
Pulp
17
3.3 Concentration of the Ellagitannins in Blackberry
The study of the concentration of the ellagitannins in blackberry was carried out as follows. Three different ceramic membranes were tested (Table 1) at 30ºC for the processing of the clarified blackberry juice until a VRF of 11, when possible. After the concentration mode was finished, a diafiltration operation was carried out with water until the VRF increased by one unit. Data of permeate mass against time was gathered. For every unit of VRF reached, a sample was taken from the retentate and the permeate for ellagitannin and anthocyanin analysis by HPLC.
Table 1. Description of the membranes used for the concentration of
ellagitannins. Membrane Pore size (nm) MWCO (kDa) Filtration area Nº of channels Channel diameter (mm) Material (active layer) Manufacturer
Membralox 10 5 0.2 19 4 TiO2
Pall Corporation
Membralox 5 1 0.2 19 4 TiO2
Pall Corporation
TAMI Inside Céram®
- 1 0.35 23 3.5 TiO2
TAMI Industries
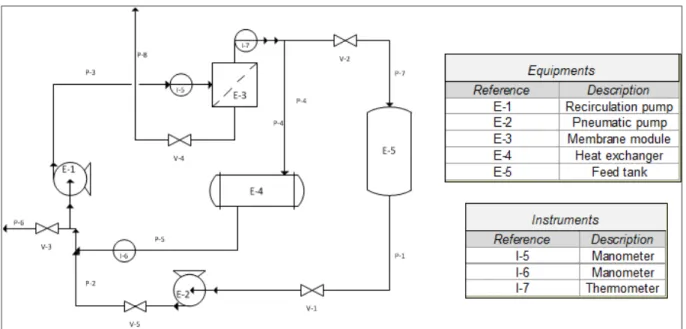
The equipment used was built by the researchers and personnel from CITA (Figure 9 and Figure 10).
Figure 9. Views of the filtration equipment: Membrane module (1), Heat exchanger (2), Recirculation pump (3), Recirculation valve (4), Retentate outlet
valve (5), Thermometer (6), Manometer- outlet pressure (7), Manometer- inlet pressure (8), Permeate outlet valve (9), Flowmeter (10), Feed tank (11), Feed inlet
18
Figure 10. Ultrafiltration equipment diagram.
The concentration mode was carried out as follows. The sample was placed inside the feed tank, only feed and recirculation valves were open, and the pneumatic pump (or feed pump) was turned on. When the system was filled with the blackberry juice, the recirculation pump was turned on and after that the recirculation pump was closed and the permeate outlet valve was opened. When all the clarified juice was put into the system, the diafiltration mode began. Softened water was fed into the system until an increase of the VRF of one unit was completed. When the process was over, the permeate outlet valve was closed, then the recirculation pump was turned off and afterwards the feed pump was turned off as well. The retentate was collected by opening the retentate outlet valve.
After each use, the membrane is cleaned according to the established methodology, rinsing with warm water, cleaning with 2 % NaOH, and 1% HNO3. After cleaning, the water permeability is measured to verify the proper cleaning of the membrane.
Note: After conducting the assays with the membranes, there was the suspicion that the Membralox membranes labeled as 5 kDa and 1 kDa were in fact of 1 kDa and 5 kDa respectively. Therefore, the assumption of a mistake will be made and from now on the membranes previously known as Membralox 1 kDa will be regarded as the Membralox 5 kDa and vice-versa.
3.4 Stability Study
19
was removed from storage and the following analysis were carried out: Total acidity, ºBrix, pH, Total polyphenols and Total anthocyanins.
3.5 Analysis
3.5.1. Polyphenol content (HPLC)
The content in polyphenols (mainly ellagitannins and anthocyanins) in blackberry was determined by HPLC method adapted from (Mertz, Cheynier et al. 2007). Briefly, the retentate or permeate solution was properly diluted and injected into the chromatographic system. The separation was performed at 30°C. The solvents were 2% aqueous formic acid (solvent A) and acetonitrile/formic acid (80:20, v/v; solvent B). Anthocyanins and ellagitannins were analyzed, with a flow of solvent A of 0.300 mL/min using the following gradient: from 5 to 25% of solvent B in 20 min and from 25 to 100% of solvent B in 5 min, from 100 to 10 % of solvent B in 5 min and from 10 to 5 % of solvent B in 5 minute – total run time of 35 minutes. After each run the column was washed during 5 min with HPLC grade water and equilibrated for 15 min. The column used was a C18 YMC 5µm. 150 x 4.6 mm, and the HPLC equipment includes a Shimadzu pump LC 20 AT, Shimadzu degasser DGU 20A5, Shimadzu Diode Array Detector SPD M20A and the Shimadzu Column oven CTO 6A. Anthocyanin content is expressed as equivalent Cyanidin-3-glucoside (mg/L) and Ellagitannin content is expressed as equivalent Ellagic acid content (mg/L).
3.5.2. Total anthocyanin content
The determination of anthocyanin content was carried out by the Chemical Laboratory of CITA according to their protocols (Giusti and Wrolstad 2001). This is a spectrophotometric method in which anthocyanins are detected at two different pH values: 1.0 and 4.5. Samples were homogenized, four 100 µL aliquots were taken and placed in four test tubes. 9.90 mL of buffer was placed in each tube, two samples with buffer pH=1.0 and two with buffer pH=4.5) so that the final volume is 10.00 mL. Each tube was agitated with a vortex for 1 minute. The adequate dilution was performed, so that the absorbance of the pH=1.0 solution lied between 0.2 to 0.8 UA at 510nm. The zero of the equipment was adjusted with the corresponding buffer. The lectures with the Shimadzu Pharmaspec UV – 1700 spectrophotometer were performed for each sample with the following two wavelengths: 510 nm and 700 nm without withdrawing the cell. Total anthocyanin content was calculated as follows:
[( ) ( ) ]
Where:
20
: dilution factor of the sample at pH=1.0 (volume of sample + volume of buffer added)/( volume of sample)
: dilution factor of the sample at pH=4.5 (volume of sample + volume of buffer added)/( volume of sample)
: Cyanidin-3-glucoside molecular weight (MW = 449.2 g/mol) : Density of the liquid sample
: Molar absorbance of the majoritarian anthocyanin ( = 26900 L/mol·cm)
3.5.3. Soluble solids determination (ºBrix)
The determination of soluble solids was made through a ºBrix measurement using an Abbé refractometer. The samples were agitated and filtered through paper filter. Then the ºBrix were measured with the Abbé refractometer.
3.5.4. Total polyphenol determination
The determination of total polyphenols in the sample was carried out by the Chemical Laboratory of CITA according to their protocols (Slinkard and Singleton 1977) modified by (George, Brat et al. 2005). Briefly, samples were centrifuged to eliminate suspended particles, then filtered through a 41 Whatman filter. Then the samples were treated with two different methods: Method A and Method B. Method A was carried out as follows: the ideal dilution was established so that the absorbance fitted inside the calibration curve of gallic acid. For each prepared dilution, a 500 µL aliquot was taken and placed inside each of the test tubes. 500 µL of HPLC-grade water was used as blank. 2.50 mL of Folin solution was added to the test tubes that contain the diluted extracts and the blank tubes and left stand for 2 minutes. 2.00 mL of sodium carbonate was added to each test tube and the tubes were agitated with the vortex. The tubes were placed inside a water bath at 50ºC for 15 minutes, then the test tubes were quickly cooled down in an ice bath. Room temperature was measured. The absorbances were measured at 760 nm. When the adequate dilution was determined, three aliquots of 500 µL were placed in three test tubes and the previous steps were followed to measure the absorbance (from the addition of Folin solution until the end).
21
temperature was measured. The absorbances were measured at 760 nm and the concentrations were interpolated in the gallic acid interpolation curves.
From the interpolation curves the polyphenol concentration from method A and from method B can be calculated. In order to reach the final total polyphenol content is the one resulting from doing the following calculation.
( )
3.5.5. pH determination
pH was determined according to AOAC International methods (2005). Samples were left at room temperature until the temperature was stabilized. Then pH was measured by immersing the electrodes into the solution.
3.5.6. Titrable acidity determination
The determination of titrable acidity was carried out by the Chemical Laboratory of CITA according to their protocols (AOAC 2005). The samples were titrated with NaOH and the pH change was detected with a pH electrode, since the samples are colored. Acidity was expressed as a %Malic acid.
3.6 Calculations
Volume Reduction Factor (VRF)
VRF was determined as follows.
Where:
: Volume of the permeate (L) : Volume of the retentate (L)
The volume of the retentate was determined with each membrane placed in the equipment with water.
Concentration Ratio
The concentration ratio was calculated as the concentration of the anthocyanins or ellagitannins in the concentrate or permeate stream at a certain VRF divided by the initial concentration of those components in the feed blackberry clarified juice.
Recovery Yield of the Polyphenols in the Retentate
22
Where:
: Concentration of the species i in the retentate, in mg/L : Volume of the retentate (L)
: Concentration of the species i in the feed, in mg/L : Volume of the feed (L)
: in %
Retention coefficient
The retention coefficient of the anthocyanins and ellagitannins was calculated as follows.
( ) Where:
: Component i concentration in the feed, in mg/L : Component i concentration in the permeate, in mg/L
: in %
Estimation of the Ellagitannin content from the Results of Total Anthocyanin content and Total
Polyphenol determination (Stability Study)
In the preliminary stability study the spectrophotometric determination of Total Anthocyanin and Total Polyphenols content was carried out. In order to estimate the approximately value of the ellagitannin content in the samples the following calculation was made.
(
) (
) (
)
This calculated ellagitannin value is an estimative one, and since blackberries’ polyphenols are manly anthocyanins and ellagitannins, it was calculated for each week of the study to see the tendency of the ellagitannin contents in the concentrate.
3.7 Statistical Analysis
23
4
Results and Discussion
4.1 Evaluation of three different membranes for the concentration of the
ellagitannins from tropical highland blackberries.
The concentration process was evaluated for three different ceramic membranes. On Table 2 the operational parameters are shown for each membrane. All the runs were conducted with the same general equipment- only the membrane and sometimes the membrane module varied- at 30ºC. It is possible to see that the lower permeability was reached with the Membralox 1 kDa (1.73±0.08 L/hm2bar) while the membranes that presented the highest permeabilities were Membralox 5 kDa and Tami 1 kDa (12±4 and 6±4 L/hm2bar respectively).
Table 2. Summary of operational parameters for each membrane for the
concentration of ellagitannins in blackberries.
Membrane Run Permeate flux (L/hm2)
TMP (bar)
Permeability (L/hm2bar)
Mean Permeability
(L/hm2bar)
CV (%)
Membralox 5 nm
(1 kDa) 1 10.44 5.95 1.75 1.73±0.08 2.26
2 11.42 6.72 1.70
Membralox 10 nm
(5 kDa) 1 69.41 5.00 13.88 12±4 17.94
2 53.78 5.00 10.75
Tami 1 kDa 1 24.39 5.00 4.88
6±4 31.99
2 38.65 5.00 7.73
Although low-UF or NF procedures are carried out at TMP ranging from 20 to 30 bar, the low TMP pressures chosen were due to several reasons. First, ceramic membranes are usually not resistant to pressures above 10 bar and until now most of the filtration assays were performed on organic membranes that can endure higher pressures. What is more, ceramic membranes are not compressible, therefore an increase in TMP will not improve the retention of the components, which happens with organic membranes.
The election of ceramic membranes for the concentration of ellagitannins in blackberries was made because the flux can be kept constant, the membranes are easier to clean, they endure tougher pH conditions and their lifespan can be higher than for organic membranes.
24
Membralox 5 kDa membrane. Meanwhile, the TAMI membrane area would be almost double than for the Membralox 5 kDa.
Table 3. Membrane area required for a permeate flux of 100 L/h, operating at a
pressure of 6 bar and temperature of 30 ºC.
Membrane Membrane area (m2)
Membralox 5 nm (1 kDa) 9.65
Membralox 10 nm (5 kDa) 1.35
Tami 1 kDa 2.64
The ellagitannin and anthocyanin concentration ratio evolution during the different runs with the different membranes are shown in the figures below (Figure 11 and Figure 12 respectively). In order to normalize initial polyphenol contents a concentration ratio was calculated as explained in Materials and Methods: Calculations. The membrane that concentrated the most polyphenols was in fact the Membralox 1 kDa, followed by the Tami 1kDa and the Membralox 5 kDa. The ANOVA analysis at α=0.05 showed that the differences in polyphenol concentrations obtained for each membrane were significant.
VRF
0 2 4 6 8 10 12 14 16
E lla g ic a ci d c o nc e nt ra ti o n ra ti o 0 1 2 3 4 5 6 7 M1kDa (2) M1kDa (1) TM1kDa (1) TM1kDa (2) M5kDa (1) M5kDa (2)
Figure 11. Ellagic acid concentration ratio vs. VRF for the different membranes for the concentrate. Last point of each plot corresponds to the contents after diafiltration. Where: Membralox 5kDa run 1: M5kDa (1), Membralox 5kDa run 2:
25 VRF
0 2 4 6 8 10 12 14 16
C ya n id in -3 -g lu co si d e co n ce n tr a ti o n r a ti o 0 1 2 3 4 5 6 M1kDa (2) M1kDa (1) TM1kDa (1) TM1kDa (2) M5kDa (1) M5kDa (2)
Figure 12. Cyanidin-3-glucoside concentration ratio vs. VRF for the different membranes for the concentrate. Last point of each plot corresponds to the
contents after diafiltration. Where: Membralox 5kDa run 1: M5kDa (1), Membralox 5kDa run 2: M5kDa (2), TAMI 1kDa run 1: TM1kDa (1), TAMI 1kDa run 2: TM1kDa (2), Membralox 1kDa run 1: M1kDa (1), Membralox 1kDa run 2: M1kDa
(2).
For the Membralox 1kDa and TAMI 1kDa membranes, the diafiltration step did not significantly affect the concentration of the polyphenols; whereas for the Membralox 5kDa membrane this step caused the reduction of the polyphenol content in the retentate. The diafiltration water could have solubilized the ellagitannins, which could have passed through the membrane in the permeate stream, since ellagitannins are water-soluble solutes (Ascacio-Valdés, Buenrostro-Figueroa et al. 2011).
For the Membralox 1kDa membrane, the first run was carried out until VRF = 6 approximately, while the second run was carried out until VRF = 11. It is possible to appreciate that for the first run, the ellagitannin and anthocyanin concentration at VRF = 6 is almost equal or higher than for the second run at VRF = 7. This could be explained due to the difference in pressures used for both runs. The pressure used for the first run was of 5.95 bar while for the second one was higher: 6.72 bar. This difference could have produced differences in the polyphenol structures, compressing the compounds so that they would pass through the membrane more easily. Further studies of the influence of TMP on the concentration of ellagitannins should be carried out in order to confirm these assumptions.
26
up to three times the original concentration at VRF = 7 and then the concentration decreased down to two-times the concentration of the feed stream at VRF = 11. The problems with repeatability are probably due to temperature fluctuations, since the regulation was manual. On the other hand, the anthocyanin concentration ratio evolution against VRF was more comparable within runs.
For the TAMI 1kDa membrane, the ellagitannin concentration evolution was different for the different runs, although the final value was similar (VRF = 10, Concentration ratio ≈ 3). On the first run the ellagitannin concentration ratio did not vary greatly until VRF = 7. On the second run the ellagitannin concentration ratio varied more lineraly against VRF. For the anthocyanin concentration ratio evolution against VRF, values were more comparable within runs except for VRF = 7, but reaching a similar final value at VRF = 10 of approximately three-times the initial anthocyanin concentration.
An anthocyanin and ellagitannin recovery yield was also calculated as the total amount that was recovered- final mass in the concentrate obtained- divided by the total amount found in the initial clarified juice. The maximum anthocyanin and ellagitannin yields obtained for each membrane are shown in Table 4. For instance, for the Membralox 1kDa membrane, it was possible to recover approximately 50 % of the ellagitannins fed into the system, while for the Membralox 5kDa there was a loss of approximately 75 % of the ellagitannins. Recovery was found to be quite low.
Table 4. Maximum polyphenol recovery in the concentrate for each membrane.
Membrane Maximum Recovery Yield (%)
Cyanidin-3-glucoside Ellagic acid
Membralox 1kDa 42±3 54±3
Membralox 5kDa 20±1 26±2
TAMI 1kDa 29±3 32±4
The retention coefficient values were calculated and they are shown in the figures below (Figure 13 and Figure 14). The membrane that showed the higher retention coefficient was the Membralox 1kDa, while the lower values were obtained for the Membralox 5kDa. Retention coefficients values varied within a specific run for each one of the TAMI 1kDa and Membralox 5kDa membranes. These values had also poor repeatability between different runs. Temperature fluctuations due to the manual control could be the cause for the observed differences.
27
(Cissé, Vaillant et al. 2011). Similar results were obtained by other authors working on the retention of anthocyanins with organic membranes (Conidi, Cassano et al. 2012) and (Cissé, Vaillant et al. 2011). For Conidi, Cassano et al. (2012), different polymeric spiral-wound nanofiltration membranes were used for the recovery of phenolic compounds from orange press liquor, testing membranes with nominal MWCO between 250 and 1000 Da at 20ºC. Retention of anthocyanins in this work ranged between 89 % and 95.9 %. The assays made in Cissé, Vaillant et al. (2011) involved the selection of different polymeric NF and UF membrane for the concentration of anthocyanins from roselle extract at 35ºC. For UF membranes they obtained retentions of anthocyanins up to 97 % with a 5 kDa MWCO membrane at 30 bar, while the retention for NF membranes, with nominal MWCO ranging from 0.2 to 0.4 kDa, was between 93 % to 100 %.
The TAMI 1kDa membrane did not perform as well as the Membralox 1 kDa membrane for the retention of ellagitannins or anthocyanins, with retentions ranging from 40 % to 85 % and 40 % to 60 % respectively. This could be due to the pore size distribution of this membrane; it is probably higher than for the Membralox 1 kDa.
VRF
0 2 4 6 8 10 12
R e te n tio n co e fficie n t E llag ic a cid ( %) 0 20 40 60 80 100 120 M1kDa(2) M1kDa(1) TM1kDa(1) TM1kDa (2) M5kDa(1) M5kDa(2)
Figure 13.Retention coefficient of Ellagic acid vs. VRF for the different membranes. Where: Membralox 5kDa run 1: M5kDa (1), Membralox 5kDa run 2:
28
VRF
0 2 4 6 8 10 12
Re
te
n
tion
coe
ffici
e
n
t Cya
n
idin
-3
-g
lc (%)
0 20 40 60 80 100 120
M1kDa(2) M1kDa(1) TM1kDa(1) TM1kDa(2)
M5kDa(1) M5kDa(2)
Figure 14. Retention coefficient of Cyanidin-3-glucoside vs. VRF for the different membranes. Where: Membralox 5kDa run 1: M5kDa (1), Membralox 5kDa run 2:
M5kDa (2), TAMI 1kDa run 1: TM1kDa (1), TAMI 1kDa run 2: TM1kDa (2), Membralox 1kDa run 1: M1kDa (1), Membralox 1kDa run 2: M1kDa (2).
Finally, it was decided to follow the rest of the experiments and evaluations with the Membralox 1 kDa membrane. Although the membrane area needed in order to achieve similar permeate fluxes is higher than for the other two, the concentration of ellagitannins and anthocyanins reached was higher. Besides the operation was more stable, being able to reach similar operational parameters for different runs.
4.2 Stability evaluation of the concentrate.
29 Week
0 1 2 3 4 5 6
p H , A ci d it y (% M a lli c a ci d ) 2,0 2,2 2,4 2,6 2,8 3,0 ºB rix 10 11 12 13 14 15 16 17 Acidity pH ºBrix
Figure 15. Stability study results for acidity, pH and ºBrix.
Figure 16. Stability study results for total anthocyanins, total polyphenols and
the estimate of ellagitannin content.
30
refractometer readings could also explain the strange behavior. Total acidity varies from 2.51% to 2.27% of Malic acid over the weeks, resulting in a variation of 10%, indicating that the total acids content did not vary much and that the ellagic acid did not increase the acidity due to its low solubility. For the case of pH, it varied from a value of 2.14 to a final value of 2.89, with a high variation on week 2, which represents a 35% of increase. The explanation of this behavior could be due to the precipitation of polyphenols and other compounds, from week 4 it was possible to see precipitation of compounds inside the flasks. Ellagitannins could be hydrolyzed under the pH conditions into ellagic acid, which is a water-insoluble molecule (Clifford and Scalbert 2000).
Since the spectrophotometric methods available to determine polyphenols are only for total polyphenol and total anthocyanin content, an estimative value of ellagitannin content was calculated from these values as the total polyphenol content minus total anthocyanin content. Week zero values for total anthocyanin, ellagitannin and total polyphenol content was 5,786.16 mg of cyanidin-3-glucoside/L, 24,115.84 mg/L and 29,902.00 mg of gallic acid/L respectively. Total anthocyanin and total polyphenol content decreased over the weeks, thus ellagitannin content decreased as well. However, the decrease in the first one was higher than for total polyphenols. Total anthocyanin content decreased in approximately 52% while the decrease of total polyphenol content was of 28%. Consequently, the decrease in ellagitannin content was of 22%. This means that anthocyanins were more unstable than other polyphenols present in the blackberry concentrate, mainly ellagitannins.
From this preliminary study it was possible to determine that in order to increase polyphenol stability some further measures should be taken since they proved to be unstable in the concentrate solution conditions. Therefore, more studies should be conducted in order to stabilize the concentrate: optimal pH study, addition of stabilizers or spray-drying of the concentrate. The spray-drying of the concentrate could also be an interesting method for other reasons than the stabilization of the polyphenols, since transportation costs are lowered, shelf-life is improved and they can also be commercialized at higher prices.
4.3 Cost Evaluation of the process.
4.3.1. Generalities
31
Figure 17. Process Diagram for the production of Blackberry concentrate
Reception of
fresh blackberries
Cleaning of
blackberries
Pressing
Enzymatic
treatment
Microfiltration
low
Ultrafiltration
Packaging
Storage
100 kg of Blackberries
70 kg of Pressed juice 30 kg of Blackberry residue
69 kg of Clarified juice 1 kg of MF concentrate
32
4.3.2. Investment
The investment necessary for the project is calculated on the basis of the requirements to install the processing plant to produce the polyphenol-rich blackberry extract. It does not include terrain or building costs, only equipment needed for the operation of the plant. On Table 5 a summary of the investment needed is shown.
06:00 08:00 10:00 12:00 14:00 16:00 18:00
Reception of fresh Blackberries
Pressing
Enzymatic treatment
Microfiltration
Ultrafiltration (Concentration mode)
Ultrafiltration (Feed & Bleed)
Packaging
33
Table 5. Investment needed for the installation of a polyphenol-rich blackberry
extract processing plant.
Investment Quantity
Unitary Price (U$S) Total Price (U$S) Amortization period (years) Costs per year (U$S/year) Blackberry containers: raw material reception 1.2x1.4x1.05m
50 80 4,000 8 500
Conveyor belt 1 5,000 5,000 8 625
Cleaning tank 1 5,000 5,000 8 625
Hydropress 1 10,000 10,000 8 1,250
Tank for enzymatic treatment 2 2,500 5,000 8 625
Microfiltration equipment* 1 56,000 56,000 8 7,000
Ultrafiltration equipment* 1 62,000 62,000 8 7,750
Metallic storage containers (55 gal)
with cover 50 20 1,000 8 125
Wood pallets 1.2*1 m 20 3 60 8 8
Electric boiler 1 5,000 5,000 8 625
100 kW Wilson electric plant 1 5,000 5,000 8 625
Air compressor 1 2,000 2,000 8 250
Water filter 1 5,000 5,000 8 625
Total 165,060 20,633
*It includes: modules, substitution modules, equipment frame, pneumatic pump, centrifugal pump
The total investment needed for the installation of a small polyphenol-rich blackberry extract processing plant that uses membrane technology is U$S 165,060. The investment cost per year assuming an amortization of 8 years for the equipment is U$S 20,633.
4.3.3. Production Cost and Product Price
Production
For the production of the polyphenol-rich extract the following calculations were made. The MF equipment will operate during three hours, giving 1300 L/h of clarified juice. The UF permeate flux was taken as 11 L/hm2, approximately 14 m2 of membrane will be used, the VRF to be reached will be 10 and the total duration of the UF equipment operation is 8 hours (concentration mode plus Feed-and-Bleed). That will yield approximately 17 L/h of blackberry concentrate out of the UF step. Therefore, every two days approximately one bag of 55 gal of final product is produced. For a 200-day production campaign 131 bags of final product are produced.
Sales
34
concentrate that is commercialized at 200 U$S/kg of product with a concentration of 170 g/L of polyphenols.
Costs
Costs can be divided into Variable costs and Fixed costs. The first type of costs include the costs that will significantly vary due to production: raw material, enzymes, cleaning products, packaging material, seasonal personnel wages and water and energy consumption during the production period. The other type of costs include water and electricity charges not due to production, office material, other office/company-related expenses, permanent personnel wages and amortization of equipment.
Purchases
The following table illustrates the purchases needed to produce the extract (Table 6).
Table 6. Purchases needed for production line.
Unitary Prices Consumption
Total cost/campaign
(U$S)
Fresh blackberries 2 U$S/kg 2000 kg/day 800,000
Ultrazym AFP L Enzyme 31.8 U$S/kg 0.36 kg/day 2,290
Granulated Caustic soda 2.28 U$S/kg 50 kg/day 22,800
Nitric acid 8.86 U$S/gal 10 gal/day 17,720
55 gal aseptic bags 4 U$S/bag 1 bags/day 523
Total 843,332
As it can be appreciated from the table, the main production cost is the acquisition of blackberries. The price is the one that is offered by producers in Costa Rica.
External charges
Water and electricity consumption are explained in Table 7. Two different scenarios are shown: water and electricity consumption for the production line and the consumption of the rest of the company (offices, sanitary installations, etc.).
Table 7. Water and Electricity consumption
Production
period Unitary Prices
Consumption per production day
Total cost per year (U$S)
Water 0.18 U$S/m3 10 m3/day 306
Electricity 0.13 U$S/kWh 204 kWh/day 5,304
Total 5,664
Out-of-Production period
Unitary Prices Consumption per day Total cost per year (U$S)
Water 0.18 U$S/m3 0.0048 m3/day 0.31
Electricity 0.13 U$S/kWh 48 kWh/day 2,246
35 Other company costs are shown in Table 8.
Table 8. Other costs
Cost (U$S/year)
Office material 500
Maintenance and repairs 2,000
Marketing 1,000
Transportation 768
Shipping costs 120
Telecommunications costs 780
Banking costs 60
Others 300
Total 5,528
Personnel
The personnel needed for a small plant is shown in Table 9. The manager and the security guards will work during the whole year, while the production-associated workers will work as long as production line is operative.
Table 9. Personnel: amount and salaries.
Quantity Gross salary (U$S/month)
Amount worked (days)
Total cost (U$S/year)
Manager 1 2,399 360 28,786
Supervisor 1 769 200 5,125
Operator 4 369 200 9,841
Security guard 2 184 360 4,427
Total 48,180
Production cost of the blackberry extract per kilogram of product
Gathering all the information above, the production cost of the polyphenol-rich blackberry extract can be calculated. If the production per campaign is 27,200 kg of concentrate, the resulting production cost is of 34 U$S per kilogram of product. The concentration of ellagitannins in this product would be around 24 g/L plus a concentration of anthocyanins of 6 g/L (total polyphenol composition of around 30 g/L. This number includes both variable and fixed costs.
4.3.4. Payback time, Costs distribution and Margin.
36
Table 10. Summary of investment, costs and income.
A. Investment 165,060 U$S
B. Turnover 1,763,901 U$S/year
C. Total variable costs 863,963 U$S/year
D. Total fixed costs 61,620 U$S/year
E. Profit 838,317 U$S/year F. Payback 0,20 years
The total potential profit would be of 838,317 U$S/year while the Payback time of the investment would be 0.20 years (two and a half months approximately). It is important to stress that for the investment item terrain and building costs were not included.
In the following figures (Figure 19 and Figure 20) it is possible to appreciate the breakdown of the costs and profit margins.
Figure 19. Distribution of the sales
49%
3% 48%
37
Figure 20. Main costs and margin.
Figure 19 shows that the main costs are due to variable costs, fixed costs only represent 3 % of the sales. When a closer look is taken (Figure 20) it can be appreciated that the purchase of fresh blackberries causes almost half of the production costs. In other words, half of the concentrate sales’ price is due to the price and amount of raw material used.
45%
0%
1% 1%
0% 0% 1%
1% 1% 0% 2%
48%
Fresh Blackberries
Enzyme Ultrazym AFP L
Caustic soda granule
Nitric acid
Aseptic bags 55 gal.
Water
Electricity
Seasonal personal
Investment
Indirect costs
Permanent personal
38
5
Conclusions and Future Perspectives
It was possible to select among the three membranes used. The criteria for such selection were made on the basis of operational parameters and ellagitannin concentration reached. Therefore, the Membralox 1 kDa was selected as the best membrane for such operation, since ellagitannins were able to be concentrated up to 5-times the original concentration in the blackberry clarified juice and its operational parameters were reproducible.
The stability study showed that the polyphenols in the concentrate decreased along the 5-week period, while pH values increased from a value of 2.00 to 2.80 approximately. Acidity did not vary much while the ºBrix increased from a value of 11.0 to almost 16.0 in the first weeks and then it stabilized at 14.5. All of this data indicated that there is a need for further stabilization steps of the ellagitannin-rich concentrate.
Due to time concerns, it was not possible to assess the selected membrane for long-term studies. Therefore, the maximum VRF that could be reached is not known. The Feed-and-Bleed process was also not done.
The economic evaluation of the process was performed. The production costs were estimated in U$S 34 per kilogram of final product, for a daily consumption of blackberries of 2000 kg/day. Considering a product sales price of 72 U$S/kg of product, the payback time for an investment of U$S 165,000 would be less than a year.
Further studies in the subject should include a more complete stability study, comparing different treatments (pH change, addition of stabilizers) compared at different temperatures. The assessment of spray-drying of the concentrate could be an interesting field to study since polyphenols will probably be more stable and product transportation costs can be decreased. It is also important to establish the maximum VRF that is possible to reach in such system.