WORKING PAPER SERIES
CEEAplA WP No. 14/2011
The Underlying Database of an Instrument for
Economic and Social Policy Analysis for the
Azores: Application and Extension to 2005
Susana Santos
The Underlying Database of an Instrument for
Economic and Social Policy Analysis for the Azores:
Application and Extension to 2005
Susana Santos
Technical University of Lisbon (ISEG and UECE)
CEEAplA Working Paper n.º 14/2011 Abril de 2011
RESUMO/ABSTRACT
The Underlying Database of an Instrument for Economic and Social Policy Analysis for the Azores: Application and Extension to 2005
In this paper a conceptual reflection is carried out and a practical and methodological guide is provided to the work undertaken with the aim of updating for 2005 a Social Accounting Matrix (SAM) constructed for 2001 as a database for a Computable General Equilibrium (CGE) model for the Azores. The construction of a similar SAM to support an application of the same model for Portugal is also part of that same work.
A top-down approach is adopted, and the study adheres to the principle that databases for national and regional models (namely SAMs) should be consistent with national and regional accounts.
.
Key words: Social Accounting Matrix; CGE models’ databases; National
Accounts; Regional Accounts
Susana Santos
Universidade Técnica de Lisboa
ISEG – Instituto Superior de Economia e Gestão Departamento de Economia
The Underlying Database of an Instrument for Economic and Social
Policy Analysis for the Azores. Application and Extension to 2005.
Susana Santos
ISEG (School of Economics and Management)/TULisboa – Technical University of Lisbon; UECE
– Research Unit on Complexity and Economics and DE – Department of Economics
Rua Miguel Lupi, 20, 1249-078 Lisboa, Portugal
Tel.: +351 21 392 59 53
Fax: +351 21 397 11 96
E-mail: ssantos@iseg.utl.pt.
The Underlying Database of an Instrument for Economic and Social Policy Analysis for the
Azores. Application and Extension to 2005. SSantos (April, 2011)
Abstract
In this paper a conceptual reflection is carried out and a practical and methodological guide is
provided to the work undertaken with the aim of updating for 2005 a Social Accounting Matrix
(SAM) constructed for 2001 as a database for a Computable General Equilibrium (CGE) model for
the Azores. The construction of a similar SAM to support an application of the same model for
Portugal is also part of that same work.
A top-down approach is adopted, and the study adheres to the principle that databases for national
and regional models (namely SAMs) should be consistent with national and regional accounts.
.
Key words: Social Accounting Matrix; CGE models’ databases; National Accounts; Regional
The Underlying Database of an Instrument for Economic and Social Policy Analysis for the
Azores. Application and Extension to 2005. SSantos (April, 2011)
Abbreviations1
Az - Azores
CGE - Computable General Equilibrium
cif - cost-insurance-freight included
CPA - Classification of Products by Activity
ESA - European System of National and Regional Accounts in the European
Community
ESA 95 - European System of National and Regional Accounts in the European
Community of 1995
fob - free on board
GAV - Gross Added Value
GDP - Gross Domestic Product
INE - Statistics Portugal (Instituto Nacional de Estatística)
ISEG - School of Economics and Management (Instituto Superior de Economia e Gestão)
NACE - General Industrial Classification of Economic Activities within the European
Union
Pgal - Portugal
SAM - Social Accounting Matrix
SNA - System of National Accounts
SREA - Statistics Azores (Serviço Regional de Estatística dos Açores)
1
The Underlying Database of an Instrument for Economic and Social Policy Analysis for the
Azores. Application and Extension to 2005. SSantos (April, 2011)
Contents
1.Introduction ... 1
2. The SAM as database for models ... 2
2.1. The Basic CGE database for Portugal and Azores in 2005 ... 3
2.2. A Basic SAM for Portugal in 2005 ... 12
2.3. Differences between the Basic CGE database and the Basic SAM ... 21
3. Sources of information and methodological details of the CGE database for Portugal and Azores in 2005 ... 26
4.Concluding Remarks ... 37
References ... 39
Appendixes A.1. Basic CGE Database/SAM for Azores in 2001 (in millions of euros) ... 41
A.2. SAM for Portugal in 2005 (in millions of euros) ... 43
A.3. Integrated Economic Accounts for Portugal in 2005 (in millions of euros) ... 45
A.4. Nomenclatures and correspondences ... 47
The Underlying Database of an Instrument for Economic and Social Policy Analysis for the
Azores. Application and Extension to 2005. SSantos (April, 2011)
List of Tables
1. Basic CGE Database/SAM for Azores and Portugal - description ... 4
2. Basic CGE Database/SAM for Azores in 2005 (in millions of euros) ... 8
3. Basic CGE Database/SAM for Portugal in 2005 (in millions of euros) ... 10
4. Portuguese Macro SAM for 2005 (in millions of euros) ... 13
5. The National Accounts transactions in the cells of the Macro SAM ... 14
6. Basic SAM for Portugal – description ... 18
7. The Basic SAM for Portugal in 2005 (in millions of euros) ... 20
8. Cells of the Basic CGE database directly related with the cells of the Basic SAM ... 21
9. Cells of the Basic CGE database indirectly related with the cells of the Basic SAM ... 23
A.1. Basic CGE Database/SAM for Azores in 2001 (in millions of euros) ... 41
A.2. SAM for Portugal in 2005 (in millions of euros) ... 43
A.3. Integrated Economic Accounts for Portugal in 2005 (in millions of euros) ... 45
A.4.1. Nomenclatures and correspondences - Production Sectors/Sectors of Activity/Industries 47 A.4.2. Nomenclatures and correspondences - Commodities/Products ... 49
The Underlying Database of an Instrument for Economic and Social Policy Analysis for the
Azores. Application and Extension to 2005. SSantos (April, 2011)
1. Introduction
This paper is part of the work relating to two research projects that have been in progress since
January 2009 at two research units: the project entitled (at the outset) “CGE Model for the analysis
of economic, social and environmental policies”, which is being conducted at the Research Centre
for Applied Economics in the Atlantic (CEEAplA) of the Universities of the Azores and Madeira,
and the project entitled “Measuring and modelling the activity of society”, at the Research Unit on
Complexity and Economics (UECE) of ISEG, of the Technical University of Lisbon.
The main purpose of this work is to update for 2005 a so-called Social Accounting Matrix (SAM),
constructed for 2001 in order to serve as a database for a CGE model for the Azores and, at the
same time, to construct a similar one to support an application of the same model for Portugal in
2005.
Unlike the SAM constructed for the Azores in 2001, all the work for 2005 was undertaken using the
published statistical information and carried out by one single person – the author of this paper.
This paper will document and justify all the work that was undertaken. At the same time, it provides
a practical and methodological guide to that same work, which can be used in similar experiments.
The principle adopted by the author is that databases, namely SAMs, for national and regional
models, should be consistent with national and regional accounts. A top-down approach is also
adopted.
Thus, after some conceptual remarks about the use of the SAM as a database for models, section 2
begins with a description of the basic forms of the above-mentioned CGE database. Next, taking
into account the conceptual framework within which the author usually works, an application for
Portugal is formalized and quantified (at an aggregate level). The section ends by identifying the
differences between the basic CGE database and the basic SAM for Portugal in 2005.
The final matrices (CGE Databases/SAM) for the Azores and Portugal will not be included in this
paper due to their extremely large size: 160 rows by 160 columns. However, in section 2.1, with the
presentation of the basic structure, the disaggregation that was carried out is mentioned for each
account, with the specification being shown in Appendix A.4.
Section 3 provides a detailed and systematic description of the way in which the CGE databases
were constructed for Portugal and the Azores in 2005. These used as their main source of
information the Portuguese National Accounts and the National Accounts by Regions, both of
which are produced by Statistics Portugal (INE). It should be stressed that, in those cases where no
data were available from the Regional Accounts, other data were used from Statistics Portugal
The Underlying Database of an Instrument for Economic and Social Policy Analysis for the
Azores. Application and Extension to 2005. SSantos (April, 2011)
Regional Accounts, even when notable differences were detected between those available for 2001
and those used in the SAM constructed for the Azores in 2001. On the other hand, unpublished
items were estimated from the data available for 2001. In keeping with the purpose outlined above,
the SAM for Portugal will have almost exactly the same characteristics as the SAM for the Azores.
The basic structure of these SAMs is presented in section 2.1.
The paper ends with some concluding remarks of a conceptual and methodological nature.
2.The SAM as a database for models.
“A SAM is a framework both for models of how the economy works as well as for data which
monitor its workings. Recognition of this duality is of basic importance for quantitative analysis. It
implies, inter alia, that the accounting identities which are captured by a SAM are not to be regarded simply as consistency requirements which must be imposed on a model, but rather they
should be seen as a logical consequence of the paradigms which economists have adopted for
analyzing society.” (Pyatt, 1991: 316).
Thus, each SAM (which is always square) can be expressed in two versions: numerical or algebraic.
In the numerical version, each cell assumes a specific numerical value, with the sums of the rows
being equal to the sums of the columns. It is conventionally agreed that the entries made in rows
represent resources, incomes, receipts or changes in liabilities and net worth, whilst the entries
made in columns represent uses, outlays, expenditures or changes in assets. In the algebraic version,
each cell is represented by algebraic expressions that, together with those of all the other cells,
represent a SAM-based model, the calibration of which involves a replication of the numerical
version (Santos, 2007: 1; 2009: 3).
On the other hand, “the relationship between SAMs and models has several aspects […] for each
model there is a corresponding SAM. The converse does not hold, however. For any given SAM
there is a variety of possible models. The choice of the SAM restricts the choice of the models, but
it does not determine it uniquely” (Pyatt, 1988: 345). Section 2.1. describes a SAM that corresponds
to a specific model and, due to this fact, it will be referred to as the “CGE database”; Section 2.2.
describes a SAM that obeys a specific conceptual framework and for which the author is
researching a model (see Santos, 2010 and 2009). Section 2.3. systematises the differences between
The Underlying Database of an Instrument for Economic and Social Policy Analysis for the
Azores. Application and Extension to 2005. SSantos (April, 2011)
2.1. The Basic CGE database for the Azores and Portugal in 2005.
The basic structure of the CGE database for the Azores and Portugal in 2005 is the same as that
used for the Azores in 2001, which was constructed to calibrate a CGE model developed under the
scope of a project whose main objective was “to develop a multi-sectoral, multi-regional dynamic
modeling platform of the Azores economy integrated within the European and global context”
(Bayar et. al., 2006: 3). Developments of that model and its applications were published – see, for
instance, CEEPplA Working Papers 2-6/ 2009. However, the only information available about the
underlying database is a preliminary version entitled “Construction of the Social Accounting Matrix
for the Azores” (18 pages), whose author is not named and which is dated August 2007. It was this
information and some available Excel files that formed the basis for all the work undertaken for
2005. For this reason, no information source is mentioned in Tables 1 and A.1.
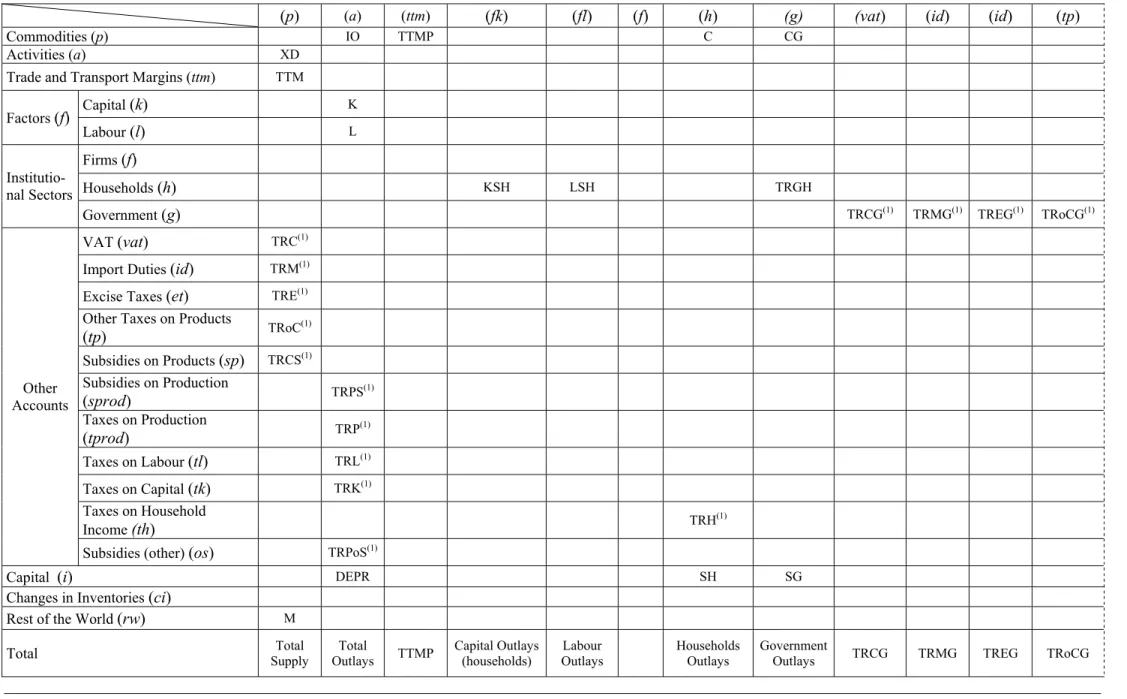
Table 1 describes the basic structure of the CGE database. Almost all of this description is adapted
to fit the corresponding model. This structure was adopted in its entirety for the Azores and almost
totally for Portugal. In the latter case, some adaptations had to be introduced at the disaggregated
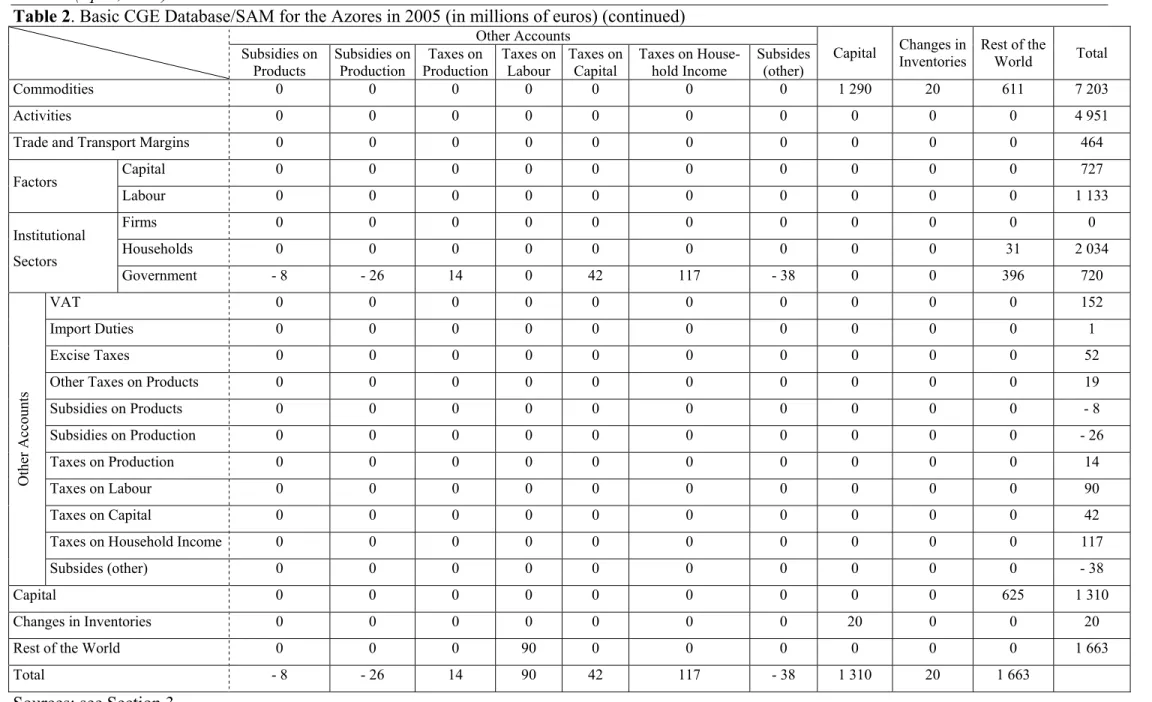
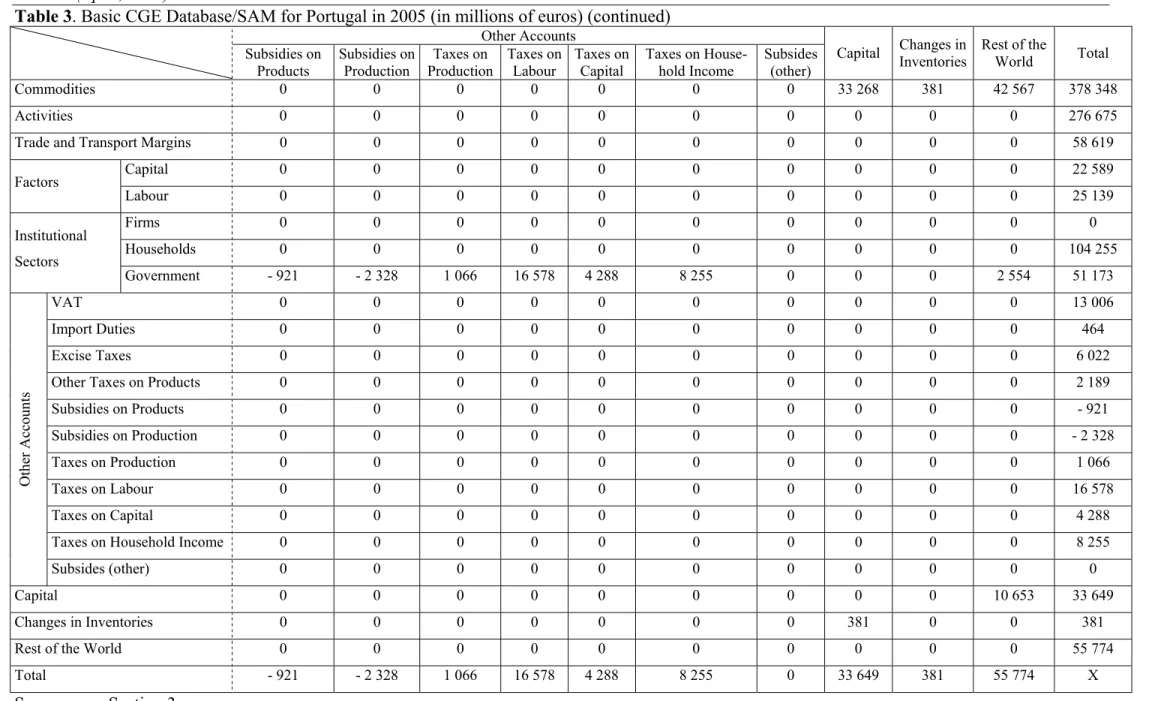
level. Tables 2 and 3 are the corresponding numerical versions. In the appendix, Table A.1 is the
corresponding matrix for the Azores in 2001. In these numerical versions, the totals may not
completely add up, due to the rounding off of some figures.
As stated in the introduction, the final matrices are not included in this paper because of their size:
160 rows by 160 columns. Appendix A.4 specifies the disaggregations of the accounts and the
corresponding nomenclatures and correspondences. Section 3 describes all the sources of
The Underlying Database of an Instrument for Economic and Social Policy Analysis for the Azores. Application and Extension to 2005.
SSantos (April, 2011)
Table 1. Basic CGE Database/SAM for the Azores and Portugal - description
(p) (a) (ttm) (fk) (fl) (f) (h) (g) (vat) (id) (id) (tp)
Commodities (p) IO TTMP C CG
Activities (a) XD
Trade and Transport Margins (ttm) TTM
Capital (k) K
Factors (f)
Labour (l) L
Firms (f)
Households (h) KSH LSH TRGH
Institutio-nal Sectors
Government (g) TRCG(1) TRMG(1) TREG(1) TRoCG(1)
VAT (vat) TRC(1)
Import Duties (id) TRM(1)
Excise Taxes (et) TRE(1)
Other Taxes on Products
(tp) TRoC
(1)
Subsidies on Products (sp) TRCS(1)
Subsidies on Production
(sprod) TRPS (1)
Taxes on Production
(tprod) TRP (1)
Taxes on Labour (tl) TRL(1)
Taxes on Capital (tk) TRK(1)
Taxes on Household
Income (th) TRH
(1) Other
Accounts
Subsidies (other) (os) TRPoS(1)
Capital (i) DEPR SH SG
Changes in Inventories (ci)
Rest of the World (rw) M
Total Supply Total Outlays Total TTMP Capital Outlays
(households)
Labour Outlays
Households Outlays
Government
The Underlying Database of an Instrument for Economic and Social Policy Analysis for the Azores. Application and Extension to 2005.
SSantos (April, 2011)
Table 1. Basic CGE Database/SAM for the Azores and Portugal - description (continued)
(sp) (sprod) (tprod) (tl) (tk) (th) (os) (i) (ci) (rw) Total
Commodities (p) I SV E Total Demand
(&TTMP)
Activities (a) Gross Output
Trade and Transport Margins (ttm) TTM
Capital (k) Capital Income
Factors
(f) Labour (l) Labour Income
Firms (f)
Households (h) TRRoWH Households
Income
Institutio-nal Sectors
Government (g) TRCSG(1)) TRPSG(1) TRPG(1) TRLG(1;2) TRKG(1) TRHG(1) TRPoSG(1) TRRoWG Government
Income
VAT (vat) TRC
Import Duties (id) TRM
Excise Taxes (et) TRE
Other Taxes on Products (tp) TRoC
Subsidies on Products (sp) TRCS
Subsidies on Production (sprod) TRPS
Taxes on Production (tprod) TRP
Taxes on Labour (tl) TRL
Taxes on Capital (tk) TRK
Taxes on Household Income (th) TRH
Other Accounts
Subsidies (other) (os) TRPoS
Capital (i) SRoW Savings
Changes in Inventories (ci) SC Changes in
Inventories
Rest of the World (rw) TRLRoW(1;2) Foreign Exchange
Outflows
Total TRC TRPS TRP TRL TRK TRH TRPoS Investment
(GCF)
Changes in Inventories
Foreign Exchange
Inflows (1)Transactions considered twice in the matrix.
The Underlying Database of an Instrument for Economic and Social Policy Analysis for the
Azores. Application and Extension to 2005. SSantos (April, 2011)
Key to Table 1 (in alphabetical order):
CG final consumption of the government
C final consumption of the households
DEPR depreciation
E exports
GCF gross capital formation
I investments (gross fixed capital formation and acquisitions less disposals of valuables)
IO intermediate consumption
K capital use of the sector
KSH income from capital received by the households
L labour use of the sector
LSH income from labour received by the households
M imports
SC total changes in inventories
SH households’ savings
SG government savings
SRoW foreign savings
SV changes in inventories by commodity
TRC taxes on commodities
TRCG taxes on products received by the government
TRCS subsidies on products
TRCSG subsidies on products paid by the government
TRE excise taxes
TREG excise taxes received by the government
TRGH transfers from the government to the households
TRH taxes on the households’ income
TRHG taxes on the households’ income received by the government
TRK taxes on capital
TRKG taxes on capital received by the government
TRL taxes on wages
TRLG taxes on labour received by the government (in the case of Portugal)
TRLRoW taxes on labour received by the Mainland (in the case of the Azores)
TRM taxes on imports
The Underlying Database of an Instrument for Economic and Social Policy Analysis for the
Azores. Application and Extension to 2005. SSantos (April, 2011)
TRoC other taxes on products
TRoCG other taxes on products received by the government
TRP taxes on production
TRPG taxes on production received by the government
TRPS subsidies on production
TRPSG subsidies on production paid by the government
TRPoS other subsidies (in the case of the Azores)
TRPoSG other subsidies paid by the government (in the case of the Azores)
TRRoWH transfers from the rest of the world to the households
TRRoWG transfers from the rest of the world to the government
TTM trade and transport margins
TTMP trade and transport margins (part of production)
The Underlying Database of an Instrument for Economic and Social Policy Analysis for the Azores. Application and Extension to 2005.
SSantos (April, 2011)
Table 2. Basic CGE Database/SAM for the Azores in 2005 (in millions of euros)
Factors Institutional Sectors Other Accounts
Commo-dities Activities
Trade and Transport
Margins Capital Labour Firms Households Government VAT
Import
Duties Excise Taxes
Other Taxes on Products
Commodities 0 2 354 464 0 0 0 1 737 728 0 0 0 0
Activities 4 951 0 0 0 0 0 0 0 0 0 0 0
Trade and Transport Margins 464 0 0 0 0 0 0 0 0 0 0 0
Capital 0 727 0 0 0 0 0 0 0 0 0 0
Factors
Labour 0 1 133 0 0 0 0 0 0 0 0 0 0
Firms 0 0 0 0 0 0 0 0 0 0 0 0
Households 0 0 0 727 1 133 0 0 142 0 0 0 0
Institutional
Sectors
Government 0 0 0 0 0 0 0 0 152 1 52 19
VAT 152 0 0 0 0 0 0 0 0 0 0 0
Import Duties 1 0 0 0 0 0 0 0 0 0 0 0
Excise Taxes 52 0 0 0 0 0 0 0 0 0 0 0
Other Taxes on Products 19 0 0 0 0 0 0 0 0 0 0 0
Subsidies on Products - 8 0 0 0 0 0 0 0 0 0 0 0
Subsidies on Production 0 - 26 0 0 0 0 0 0 0 0 0 0
Taxes on Production 0 14 0 0 0 0 0 0 0 0 0 0
Taxes on Labour 0 90 0 0 0 0 0 0 0 0 0 0
Taxes on Capital 0 42 0 0 0 0 0 0 0 0 0 0
Taxes on Household Income 0 0 0 0 0 0 117 0 0 0 0 0
Othe
r Acco
u
n
ts
Subsides (other) 0 - 38 0 0 0 0 0 0 0 0 0 0
Capital 0 655 0 0 0 0 180 - 150 0 0 0 0
Changes in Inventories 0 0 0 0 0 0 0 0 0 0 0 0
Rest of the World 1 572 0 0 0 0 0 0 0 0 0 0 0
Total 7 203 4 951 464 727 1 133 0 2 034 720 152 1 52 19
The Underlying Database of an Instrument for Economic and Social Policy Analysis for the Azores. Application and Extension to 2005.
SSantos (April, 2011)
Table 2. Basic CGE Database/SAM for the Azores in 2005 (in millions of euros) (continued)
Other Accounts
Subsidies on Products
Subsidies on Production
Taxes on Production
Taxes on Labour
Taxes on Capital
Taxes on House-hold Income
Subsides (other)
Capital Changes in
Inventories
Rest of the
World Total
Commodities 0 0 0 0 0 0 0 1 290 20 611 7 203
Activities 0 0 0 0 0 0 0 0 0 0 4 951
Trade and Transport Margins 0 0 0 0 0 0 0 0 0 0 464
Capital 0 0 0 0 0 0 0 0 0 0 727
Factors
Labour 0 0 0 0 0 0 0 0 0 0 1 133
Firms 0 0 0 0 0 0 0 0 0 0 0
Households 0 0 0 0 0 0 0 0 0 31 2 034
Institutional
Sectors
Government - 8 - 26 14 0 42 117 - 38 0 0 396 720
VAT 0 0 0 0 0 0 0 0 0 0 152
Import Duties 0 0 0 0 0 0 0 0 0 0 1
Excise Taxes 0 0 0 0 0 0 0 0 0 0 52
Other Taxes on Products 0 0 0 0 0 0 0 0 0 0 19
Subsidies on Products 0 0 0 0 0 0 0 0 0 0 - 8
Subsidies on Production 0 0 0 0 0 0 0 0 0 0 - 26
Taxes on Production 0 0 0 0 0 0 0 0 0 0 14
Taxes on Labour 0 0 0 0 0 0 0 0 0 0 90
Taxes on Capital 0 0 0 0 0 0 0 0 0 0 42
Taxes on Household Income 0 0 0 0 0 0 0 0 0 0 117
Othe
r Acco
u
n
ts
Subsides (other) 0 0 0 0 0 0 0 0 0 0 - 38
Capital 0 0 0 0 0 0 0 0 0 625 1 310
Changes in Inventories 0 0 0 0 0 0 0 20 0 0 20
Rest of the World 0 0 0 90 0 0 0 0 0 0 1 663
Total - 8 - 26 14 90 42 117 - 38 1 310 20 1 663
The Underlying Database of an Instrument for Economic and Social Policy Analysis for the Azores. Application and Extension to 2005.
SSantos (April, 2011)
Table 3. Basic CGE Database/SAM for Portugal in 2005 (in millions of euros)
Factors Institutional Sectors Other Accounts
Commo-dities Activities
Trade and Transport
Margins Capital Labour Firms Households Government VAT
Import
Duties Excise Taxes
Other Taxes on Products
Commodities 0 148 312 25 139 0 0 0 93 695 34 986 0 0 0 0
Activities 276 675 0 0 0 0 0 0 0 0 0 0 0
Trade and Transport Margins 25 139 0 0 0 0 0 0 0 0 0 0 0
Capital 0 22 589 0 0 0 0 0 0 0 0 0 0
Factors
Labour 0 58 619 0 0 0 0 0 0 0 0 0 0
Firms 0 0 0 0 0 0 0 0 0 0 0 0
Households 0 0 0 22 589 58 619 0 0 23 046 0 0 0 0
Institutional
Sectors
Government 0 0 0 0 0 0 0 0 13 006 464 6 022 2 189
VAT 13 006 0 0 0 0 0 0 0 0 0 0 0
Import Duties 464 0 0 0 0 0 0 0 0 0 0 0
Excise Taxes 6 022 0 0 0 0 0 0 0 0 0 0 0
Other Taxes on Products 2 189 0 0 0 0 0 0 0 0 0 0 0
Subsidies on Products - 921 0 0 0 0 0 0 0 0 0 0 0
Subsidies on Production 0 - 2 328 0 0 0 0 0 0 0 0 0 0
Taxes on Production 0 1 066 0 0 0 0 0 0 0 0 0 0
Taxes on Labour 0 16 578 0 0 0 0 0 0 0 0 0 0
Taxes on Capital 0 4 288 0 0 0 0 0 0 0 0 0 0
Taxes on Household Income 0 0 0 0 0 0 8 255 0 0 0 0 0
Othe
r Acco
u
n
ts
Subsides (other) 0 0 0 0 0 0 0 0 0 0 0 0
Capital 0 27 551 0 0 0 0 2 306 - 6 860 0 0 0 0
Changes in Inventories 0 0 0 0 0 0 0 0 0 0 0 0
Rest of the World 55 774 0 0 0 0 0 0 0 0 0 0 0
Total 378 348 276 675 25 139 22 589 58 619 0 104 255 51 173 13 006 464 6 022 2 189
The Underlying Database of an Instrument for Economic and Social Policy Analysis for the Azores. Application and Extension to 2005.
SSantos (April, 2011)
Table 3. Basic CGE Database/SAM for Portugal in 2005 (in millions of euros) (continued)
Other Accounts
Subsidies on Products
Subsidies on Production
Taxes on Production
Taxes on Labour
Taxes on Capital
Taxes on House-hold Income
Subsides (other)
Capital Changes in
Inventories
Rest of the
World Total
Commodities 0 0 0 0 0 0 0 33 268 381 42 567 378 348
Activities 0 0 0 0 0 0 0 0 0 0 276 675
Trade and Transport Margins 0 0 0 0 0 0 0 0 0 0 58 619
Capital 0 0 0 0 0 0 0 0 0 0 22 589
Factors
Labour 0 0 0 0 0 0 0 0 0 0 25 139
Firms 0 0 0 0 0 0 0 0 0 0 0
Households 0 0 0 0 0 0 0 0 0 0 104 255
Institutional
Sectors
Government - 921 - 2 328 1 066 16 578 4 288 8 255 0 0 0 2 554 51 173
VAT 0 0 0 0 0 0 0 0 0 0 13 006
Import Duties 0 0 0 0 0 0 0 0 0 0 464
Excise Taxes 0 0 0 0 0 0 0 0 0 0 6 022
Other Taxes on Products 0 0 0 0 0 0 0 0 0 0 2 189
Subsidies on Products 0 0 0 0 0 0 0 0 0 0 - 921
Subsidies on Production 0 0 0 0 0 0 0 0 0 0 - 2 328
Taxes on Production 0 0 0 0 0 0 0 0 0 0 1 066
Taxes on Labour 0 0 0 0 0 0 0 0 0 0 16 578
Taxes on Capital 0 0 0 0 0 0 0 0 0 0 4 288
Taxes on Household Income 0 0 0 0 0 0 0 0 0 0 8 255
Othe
r Acco
u
n
ts
Subsides (other) 0 0 0 0 0 0 0 0 0 0 0
Capital 0 0 0 0 0 0 0 0 0 10 653 33 649
Changes in Inventories 0 0 0 0 0 0 0 381 0 0 381
Rest of the World 0 0 0 0 0 0 0 0 0 0 55 774
Total - 921 - 2 328 1 066 16 578 4 288 8 255 0 33 649 381 55 774 X
The Underlying Database of an Instrument for Economic and Social Policy Analysis for the
Azores. Application and Extension to 2005. SSantos (April, 2011)
2.2. A Basic SAM for Portugal in 2005.
All the work that the author has undertaken with SAMs has a conceptual framework based on the
works of Graham Pyatt and his associates (Pyatt, 1988 and 1991; Pyatt and Roe, 1977; Pyatt and
Round, 1985), which, in turn, was inspired by Sir Richard Stone’s works, beginning with his
pioneering 1954 article “Input-Output and the Social Accounts”. At the same time, an effort has
been made to reconcile that framework with what is defined by the Systems of National Accounts
(both the one used by the United Nations and the European one), since, in the author’s view , it
makes perfect sense for SAMs to be perfectly consonant with those systems, especially in the case
of macroeconomic approaches.
Thus, having adopted the characteristics specified at the beginning of this section, some other
aspects will now be considered here, namely the following points: each transaction is recorded only
once in a cell of its own; rows/columns are organised in the form of production (and trade),
institutions and rest of the world accounts, which can be subdivided into yet further accounts; all the
transactions taking place between the actors in the economic system and measured by the system of
national accounts are included in the SAM, which can therefore be considered to provide a
complete account of the circular flow in the economy (see, Santos, 2009: 3-8).
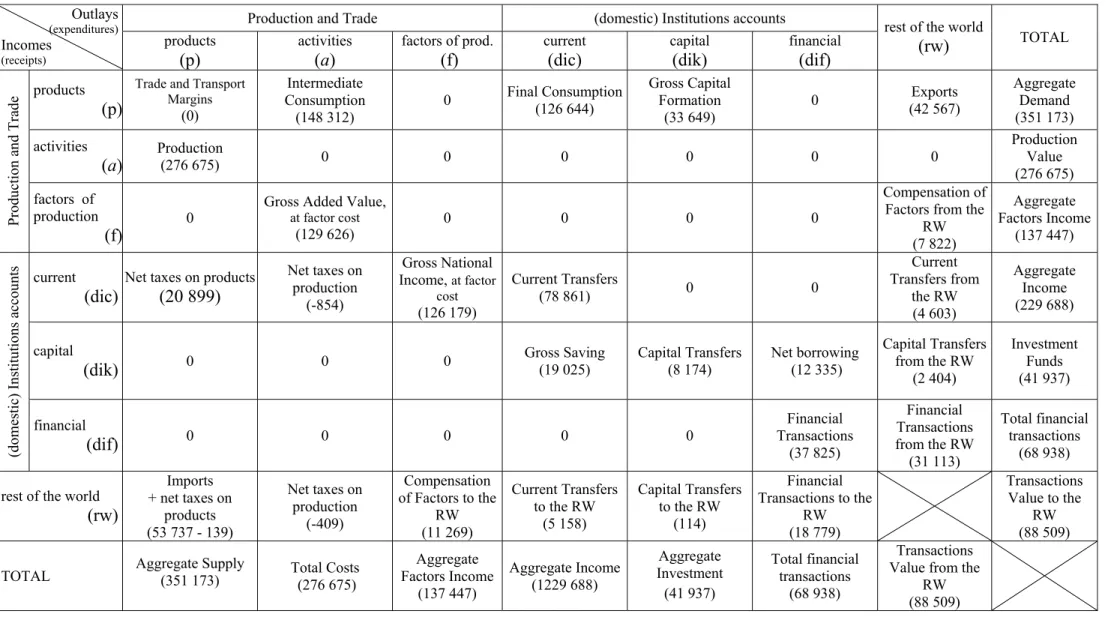
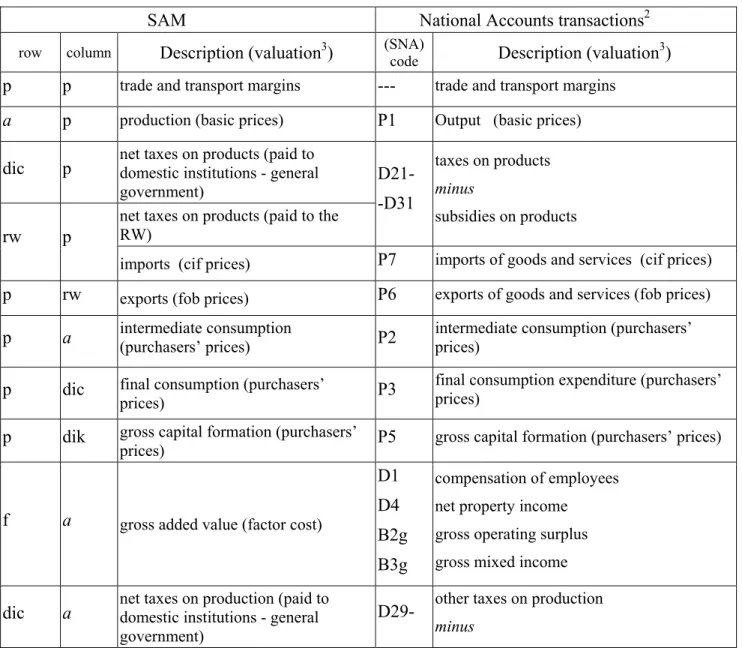
Santos (2010) works with a SAM with those characteristics for the year of this study – 2005. Table
4 is a fully aggregated version of the SAM presented in that study, while the description of the cells
of that same SAM was also adopted. This can be seen in Table 5.
The Underlying Database of an Instrument for Economic and Social Policy Analysis for the Azores. Application and Extension to 2005.
SSantos (April, 2011)
Table 4. Portuguese Macro SAM for 2005 (in millions of euros)
Production and Trade (domestic) Institutions accounts
Outlays (expenditures) Incomes (receipts) products (p) activities (a)
factors of prod. (f) current (dic) capital (dik) financial (dif)
rest of the world
(rw) TOTAL
products (p)
Trade and Transport Margins
(0)
Intermediate Consumption
(148 312)
0 Final Consumption
(126 644)
Gross Capital Formation
(33 649)
0 Exports
(42 567)
Aggregate Demand (351 173)
activities (a)
Production
(276 675) 0 0 0 0 0 0
Production Value (276 675) Pr odu ction an d Tr ad e
factors of production
(f)
0
Gross Added Value,
at factor cost
(129 626)
0 0 0 0
Compensation of Factors from the
RW (7 822) Aggregate Factors Income (137 447) current (dic)
Net taxes on products (20 899)
Net taxes on production
(-854)
Gross National Income, at factor
cost
(126 179)
Current Transfers
(78 861) 0 0
Current Transfers from the RW (4 603) Aggregate Income (229 688) capital
(dik) 0 0 0
Gross Saving (19 025) Capital Transfers (8 174) Net borrowing (12 335) Capital Transfers from the RW
(2 404) Investment Funds (41 937) (do m estic) In st itu tio n s accou nts financial
(dif) 0 0 0 0 0
Financial Transactions
(37 825)
Financial Transactions from the RW
(31 113)
Total financial transactions
(68 938)
rest of the world (rw)
Imports + net taxes on
products (53 737 - 139)
Net taxes on production
(-409)
Compensation of Factors to the
RW (11 269)
Current Transfers to the RW
(5 158)
Capital Transfers to the RW
(114)
Financial Transactions to the
RW (18 779)
Transactions Value to the
RW (88 509)
TOTAL Aggregate Supply (351 173) Total Costs
(276 675) Aggregate Factors Income (137 447) Aggregate Income (1229 688) Aggregate Investment (41 937) Total financial transactions (68 938) Transactions Value from the
RW (88 509)
The Underlying Database of an Instrument for Economic and Social Policy Analysis for the
Azores. Application and Extension to 2005. SSantos (April, 2011)
Table 5. National Accounts transactions in the cells of the Macro SAM
SAM National Accounts transactions2
row column Description (valuation3) (SNA) code Description (valuation3)
p p trade and transport margins --- trade and transport margins
a p production (basic prices) P1 Output (basic prices)
dic p net taxes on products (paid to domestic institutions - general government)
net taxes on products (paid to the RW)
D21-
-D31
taxes on products
minus
subsidies on products rw p
imports (cif prices) P7 imports of goods and services (cif prices)
p rw exports (fob prices) P6 exports of goods and services (fob prices)
p a intermediate consumption
(purchasers’ prices) P2
intermediate consumption (purchasers’ prices)
p dic final consumption (purchasers’
prices) P3
final consumption expenditure (purchasers’ prices)
p dik gross capital formation (purchasers’
prices) P5 gross capital formation (purchasers’ prices)
f a gross added value (factor cost)
D1
D4
B2g
B3g
compensation of employees
net property income
gross operating surplus
gross mixed income
dic a net taxes on production (paid to domestic institutions - general
government)
D29- other taxes on production
minus
2
Transactions at the first level of disaggregation, in accordance with the European System of National and Regional Accounts in the European Community of 1995 – ESA 95 (Eurostat, 1996) – which is itself based on the 1993 version of the International United Nations System of National Accounts – SNA 93 – prepared by the Inter-Secretariat Working Group on National Accounts and published by the United Nations Statistical Office (ISWGNA, 1993).
3
In the transactions represented by the cells whose row and/or column denotes production accounts, the following types of valuation are identified: factor cost; basic, cif and fob prices; purchasers’ or market prices.
Factor cost represents the compensation of the factors, or the primary incomes arising from the labour and capital used in the production process of the domestic economy, excluding taxes on production and imports (taxes on products and other production taxes) and subsidies (subsidies on products and other subsidies on production).
At the second level of disaggregation, one can distinguish between the production of the domestic economy and imports. In the first case, this is measured by the factor cost from the previous level, plus (other) taxes on production) net of subsidies on production, as well as by intermediate consumption. This represents the basic price level of the (domestic) production that will be transacted in the domestic market and the fob (free on board) price level of the production that will be exported. Imports, valued at cif (cost-insurance-freight included) prices, are added, at this level, to the above-mentioned unexported part of domestic production that will be transacted in the domestic market.
The Underlying Database of an Instrument for Economic and Social Policy Analysis for the
Azores. Application and Extension to 2005. SSantos (April, 2011)
SAM National Accounts transactions2
row column Description (valuation3) (SNA)
code Description (valuation
3
)
rw a net taxes on production (paid to the
RW)
-D39 other subsidies on production
dic f gross national income B5g gross national income
rw f compensation of factors to the RW
f rw compensation of factors from the RW D1
D4
primary income paid to/received from the rest of the world
compensation of employees
net property income
dic dic current transfers within domestic institutions
rw dic current transfers to the RW
dic rw current transfers from the RW
D5
D6
D7
D8
current taxes on income, wealth, etc.
social contributions and benefits
other current transfers
adjustment for the change in the net equity of households in pension funds reserves
dik dic gross saving B8g gross saving
dik dik capital transfers
dik rw capital transfers from the RW
rw dik capital transfers to the RW
D9 capital transfers
dik dif - net borrowing4 B9 net borrowing
dif dif financial transactions
rw dif financial transactions to the RW
dif rw financial transactions from the RW F1
F2
F3
F4
F5
F6
F7
monetary gold and special drawing rights (SDRs)
currency and deposits
securities other than shares
loans
shares and other equity
insurance technical reserves
other accounts receivable/payable
4
In the National Accounts, the net lending (+) or borrowing (-) of the total economy is the sum of the net lending or borrowing of the institutional sectors. It represents the net resources that the total economy makes available to the rest of the world (if positive) or receives from the rest of the world (if negative). The net lending (+) or borrowing (-) of the total economy is equal, but with an opposite mathematical sign, to the net borrowing (-) or lending (+) of the rest of the world (Eurostat, 1996: paragraph 8.98).
The Underlying Database of an Instrument for Economic and Social Policy Analysis for the
Azores. Application and Extension to 2005. SSantos (April, 2011)
SAM National Accounts transactions2
row column Description (valuation3) (SNA)
code Description (valuation
3
)
p total aggregate demand row sum of the p account’s cells (see above)
total p aggregate supply column sum of the p account’s cells (see above)
a total production value P1 output (basic prices)
total a total costs column sum of the a account’s cells (see above)
f total row sum of the f account’s cells (see above)
total f
aggregate factors income
column sum of the f account’s cells (see above)
dic total row sum of the dic account’s cells (see above)
total dic
aggregate income
column sum of the dic account’s cells (see above)
dik total investment funds row sum of the dik account’s cells (see above)
total dik aggregate investment column sum of the dik account’s cells (see above)
dif total row sum of the dif account’s cells (see above)
total dif
total financial transactions
column sum of the dif account’s cells (see above)
rw total transactions value to the rest of the
world row sum of the rw account’s cells (see above)
total rw transactions value from the rest of the
world column sum of the rw account’s cells (see above)
Source: Santos (2010: 6-7).
Note: See the correspondence identified between this Table and the values (in brackets) of the Portuguese Macro SAM for 2005 – Table 4, in the Integrated Economic Accounts for Portugal in 2005 – Appendix A.3.
We, therefore, have a SAM that is completely consonant with the National Accounts, displaying all
the characteristics that were referred to at the beginning of this section.
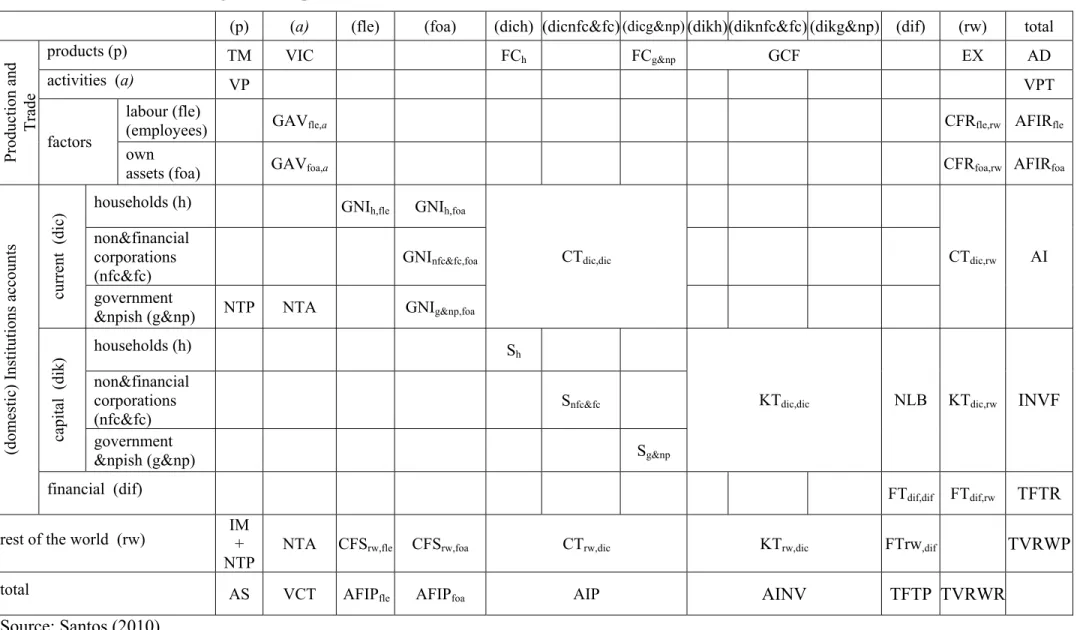
This SAM was also worked upon at some level of disaggregation. Thus, in the case of the domestic
economy, “Production and Trade” was divided into six groups of products and activities5 and two
factors of production – labour (employees) and own assets (employers and/or own account workers
and capital). In turn, “Institutions” were divided into current, capital and financial accounts, with
the last of these being a totally aggregate figure (due to a lack of information about the “from whom
to whom” transactions) while the others were divided into: households, enterprises (or non-financial
corporations), financial corporations, general government and non-profit institutions serving
households (NPISH). Besides these accounts, we also have an aggregate account for the “rest of the
5
The Underlying Database of an Instrument for Economic and Social Policy Analysis for the
Azores. Application and Extension to 2005. SSantos (April, 2011)
world” (Santos, 2010: 2-3). From this SAM, and for the purpose of comparing it with the so-called
“Basic CGE database”, presented in sub-section 2.1, the so-called “Basic SAM” was constructed
with the cells described in Table 6 and quantified in Table 7. In the case of Table 6, the description
is adapted to the model which, as has already been mentioned, the author is currently researching
The Underlying Database of an Instrument for Economic and Social Policy Analysis for the Azores. Application and Extension to 2005.
SSantos (April, 2011)
Table 6. Basic SAM for Portugal – description
(p) (a) (fle) (foa) (dich) (dicnfc&fc)(dicg&np)(dikh)(diknfc&fc) (dikg&np) (dif) (rw) total
products (p) TM VIC FC
h FCg&np GCF EX AD
activities (a) VP VPT
labour (fle)
(employees) GAVfle,a CFRfle,rw AFIRfle
Production
an
d
Trade
factors
own
assets (foa) GAVfoa,a CFRfoa,rw AFIRfoa
households (h) GNI
h,fle GNIh,foa
non&financial corporations (nfc&fc)
GNInfc&fc,foa
current (dic) government
&npish (g&np) NTP NTA GNIg&np,foa
CTdic,dic CTdic,rw AI
households (h) S
h
non&financial corporations (nfc&fc)
Snfc&fc
capital (dik) government
&npish (g&np) Sg&np
KTdic,dic NLB KTdic,rw INVF
(domestic) In
stitutions accounts
financial (dif) FT
dif,dif FTdif,rw TFTR
rest of the world (rw) IM+
NTP
NTA CFSrw,fle CFSrw,foa CTrw,dic KTrw,dic FTrw,dif TVRWP
total AS VCT AFIP
fle AFIPfoa AIP AINV TFTP TVRWR
The Underlying Database of an Instrument for Economic and Social Policy Analysis for the
Azores. Application and Extension to 2005. SSantos (April, 2011)
Key to Table 6 (in alphabetical order):
AD value of aggregate demand
AFIP aggregate factors income (paid)
AFIR aggregate factors income (received)
AI aggregate income (received)
AINV aggregate investment
AIP aggregate income (paid)
AS aggregate supply
CFR compensation of the factors of production received from the rest of the world
CFS compensation of the factors of production sent to the rest of the world
CT current transfers
EX value of exports
FC value of final consumption
FT financial transactions
GAV gross added value
GCF value of gross capital formation
GNI gross national income
IM value of imports
INVF investment funds
KT capital transfers
NLB net lending / borrowing
NTA net taxes on production
NTP net taxes on products
S gross saving
TFTP total financial transactions (paid)
TFTR total financial transactions (received)
TM trade and transport margins
TVRWP value of transactions to the rest of the world
TVRWR value of transactions from the rest of the world
VCT value of total costs
VIC value of intermediate consumption
VP value of production
The Underlying Database of an Instrument for Economic and Social Policy Analysis for the Azores. Application and Extension to 2005.
SSantos (April, 2011)
Table 7. The Basic SAM for Portugal in 2005 (in millions of euros)
(p) (a) (fle) (foa) (dich) (dicnfc&fc
) (dicg&np)(dikh)(diknfc&fc) (dikg&np) (dif) (rw) total
Products (p) 0 148 312 93 695 34 986 33 648 42 576 353 210
Activities (a) 276 675 276 675
labour (fle)
(employees) 75 358 189 75 547
Production
an
d Trade
factors own
assets (foa) 54 267 7 633 61 900
households (h) 75 198 31 058
non&financial
corporations (nfc&fc) 20 899 - 854 19 646
current (dic)
government &npish
(g&np) 277
78 861 4 603 229 688
households (h) 9 544
non&financial
corporations (nfc&fc) 13 956
capital (dik)
government &npish
(g&np) - 4 475
8 174 12 335 2 404 41 937
(domestic) In
stitutions accounts
Financial (dif) 37 825 31 113 68 938
rest of the world (rw) 55 774
6 -
139 - 409 350 10 919 5 158 114 18 779 88 509
Total 353 209 276 675 75 547 61 900 229 688 41 937 68 938 88 509
Source: Table A.2.
6
The Underlying Database of an Instrument for Economic and Social Policy Analysis for the Azores. Application and Extension to 2005.
SSantos (April, 2011)
2.3. Differences between the Basic CGE database and the Basic SAM.
Table 8. Cells of the Basic CGE database directly related with the cells of the Basic SAM
(A) CGE Database/SAM (B) SAM National Accounts Transactions (A)-(B)
Cell (row, column) Value (106 Euros)
Description (row, column) Cell (10Value 6 Euros) Description
(SNA)
code Description (valuation)
Value
(106 Euros) Description
(p, ttm) 25 139
TTMP: Trade and Transport Margins (part
of Production)
25 139
(ttm,p) 25 139 TTM: Trade and
Transport Margins
(p,p) 0 TM: Trade and
Transport Margins ---
trade and transport margins
25 139
TM = TTMP - TTM
(a,p) 276 675 XD: Domestic
production (a,p) 276 675
VP: Value of
Production P1 output (basic prices) 0 ---
(p,a) 148 312 IO: intermediate
consumption (p,a) 148 312
VIC: Value of
Inter-mediate Consumption P2
intermediate consumption (purchasers’ prices)
0 ---
(p,h) 93 695 C: final Consumption of
the households (p,dich) 93 695
FCh: value of Final Consumption of the
households
0 ---
(p,g) 34 986 CG: final Consumption
of the Government
(p,
dicg&np) 34 986
FCg&np: value of Final Consumption of the
government&npish P3 final consumption expenditure (purchasers’ prices) 0 ---
(p,i) 33 268
I: Investments (gross fixed capital formation
and acquisitions less disposals of valuables)
(p,ci) 381 SV: changeS in inVent-tories by commodity
(ci,i) 381 SC: total ChangeS in inventories
(p,dik) 33 648 GCF: value of Gross
Capital Formation P5
gross capital formation
(purchasers’ prices) 0
GCF = I+SV; GCF = I+SC
(p,rw) 42 576 E: Exports (p,rw) 42 576 EX: value of EXports P6 exports of goods and
services (fob prices) 0 ---
(rw,p) 55 774 M: iMports (rw,p)
(part) 55 774 IM: value of IMports P7
imports of goods and
services (cif prices) 0 ---
(i,h) 2 306 SH: Households Savings (dikh,dich) 9544 Sh: gross Saving of
the households B8g gross saving - 7 238
The Underlying Database of an Instrument for Economic and Social Policy Analysis for the Azores. Application and Extension to 2005.
SSantos (April, 2011)
(A) CGE Database/SAM (B) SAM National Accounts Transactions (A)-(B)
Cell (row, column) Value (106 Euros)
Description (row, column) Cell (10Value 6 Euros) Description
(SNA)
code Description (valuation)
Value
(106 Euros) Description
(i,a) 27 551 DEPR (diknfc&fc,
dicnfc&fc) 13 956
Snfc&fc: gross Saving of non&financial
corporations
- 13 594
(i,g) - 6 860 SG: Government
Savings
(dikg&np,
dicg&np) - 4 475
Sg&np: gross Saving
of the
government&npish
- 2 385
(i,rw) 10 653 SRoW: Foreign Savings (dik,dif) 12 335 NLB: net lending /
borrowing B9
net lending (+)
/borrowing (-) - 1 682
and capital transfers, which are, respecti-vely, a component of the disposable income of domestic institutions and of investment funds. However, this gap is filled by DEPR. (vat, p) TRC: Taxes on products
(g, vat) 13 006
TRCG: Taxes on products received by the
government (id, p) TRM: Taxes on imports
(g, id) 464
TRMG: Taxes on imports received by the
government (et, p) TRE: Excise taxes
(g, et) 6 022
TREG: Excise taxes received by the
government
(tp, p) TRoC: Other taxes on products
(g, tp)
2 189 TRoCG: Other taxes on
products received by the government
(sp, p) TRCS: Subsidies on products
(dicg&np,
p) 20 899
(g,sp)
- 921 TRCSG: Subsidies on
products paid by the government
(rw,p)
(part) - 139
NTP: net taxes on products (paid to the
Portuguese government and to the
European Union Institutions, or the
rest of the world)
D21- - D31
taxes on products
minus
subsidies on products
0
NTP =
= TRC+TRM+ TRE +TRoC + TRCS = TRCG+TRMG +TREG+ TRoCG + TRCSG
(A) does not distinguish between who really receives the taxes and who pays the subsidies on products.
(sprod, a) TRPS: Subsidies on production
(g, sprod)
- 2 328 TRPSG: Subsidies on
production paid by the government
(dicg&np,
a) - 854
NTA: net taxes on production (paid to
the Portuguese government and to the
European Union
D29-
-D39
other taxes on production
minus
other subsidies on
0 NTA =
= TRPS + TRP = TRPSG+TRPG
The Underlying Database of an Instrument for Economic and Social Policy Analysis for the Azores. Application and Extension to 2005.
SSantos (April, 2011)
(A) CGE Database/SAM (B) SAM National Accounts Transactions (A)-(B)
Cell (row, column) Value (106 Euros)
Description (row, column) Cell (10Value 6 Euros) Description
(SNA)
code Description (valuation)
Value
(106 Euros) Description
(tprod, a) TRP: Taxes on production
(g, tprod)
1 066 TRPG: Taxes on
production received by the government
(rw,a) - 409
Institutions, or the rest of the world)
production distinguish between
who really receives the taxes and who pays the subsidies on production.
Sources: Tables 1, 3, 6 and 7
Table 9. Cells of the Basic CGE database indirectly related with the cells of the Basic SAM
(A) CGE Database/SAM (B) SAM (A)-(B)
National Accounts
Transactions National Accounts Transactions
Cell (row, column) Value (106 Euros) Description (SNA) code Description (valuation) Cell (row, column) Value
(106 Euros) Description
(SNA) code Description
(valuation)
Value
(106 Euros) Description
(tl, a) TRL: Taxes on
wages (fle, a) 75 358
GAVfle,a: gross
added value (factor cost), part of compensation of employees paid by
the activities
(g, tl)
16 578
TRLG: Taxes on labour received by
the government D12 (D61) employers’ social contributions (social contributions)
(dich, fle) 75 198
GNIh,fle: gross national income, part
of compensation of employees received
by households
0
GNIh,fle = TRL + L = TRLG + LSH
(l, a) L: Labour use of
the sector (rw,fle) 350
CFSrw,fle: compensation of employees paid to
the rest of the world
(h, fl)
58 619
LSH: Income from labour received by
the households
D11 wages and
salaries
(fle, rw) 189
CFRfle,rw: compensation of employees received from the rest of the
world D1 (=D11+D12) compensation of employees - 161 CFRfle,rw - CFSrw,fle
GAVfle,a +
The Underlying Database of an Instrument for Economic and Social Policy Analysis for the Azores. Application and Extension to 2005.
SSantos (April, 2011)
(A) CGE Database/SAM (B) SAM (A)-(B)
National Accounts
Transactions National Accounts Transactions
Cell (row, column) Value (106 Euros) Description (SNA) code Description (valuation) Cell (row, column) Value
(106 Euros) Description
(SNA) code Description
(valuation)
Value
(106 Euros) Description
(k, a) K: Capital use of
the sector (foa, a) 54 267
GAVfoa,a: gross
added value (factor cost), part compensation of own account workers
and capital paid by the activities
- 31 678
(h, fk)
22 589
KSH: Income from capital received by
the households
B3g gross mixed
income
(dich, foa) 31 058 - 19 646
B3g+D4(net)
-- -- -- -- -- (dicnfc&fc,
foa) 19 646 - 19 646
-- -- -- -- -- (dicg&np,
foa) 277
GNI: gross national income, received by households and other
institutions B3g B2g D4 gross mixed income gross operating surplus net property income - 277
-- -- -- -- -- (foa, rw) 7 633
CFRfoa,rw:
compensation capital paid to the
rest of the world
- 7 633
-- -- -- -- -- (rw, foa) 10 919
CFSrw,foa:
compensation capital received from the rest of the
world
D4 property
income
- 10 919
(A) does not consider this item
(th, h)
TRH: Taxes on the households’
income
D5
current taxes on income, wealth,
etc.
(g, th)
8 255 TRHG: Taxes on
the households’ income received by
the government
D5 current taxes on income, wealth, etc.
(dic, dic) 78 861 CT: current transfers
D6 = D61 + D62 + D63
social contributions and benefits =
The Underlying Database of an Instrument for Economic and Social Policy Analysis for the Azores. Application and Extension to 2005.
SSantos (April, 2011)
(A) CGE Database/SAM (B) SAM (A)-(B)
National Accounts
Transactions National Accounts Transactions
Cell (row, column) Value (106 Euros) Description (SNA) code Description (valuation) Cell (row, column) Value
(106 Euros) Description
(SNA) code Description
(valuation)
Value
(106 Euros) Description
(tk, a) TRK: Taxes on capital
social
contributions + social benefits other than social transfers in kind + social transfers in kind
(g, tk)
4 288
TRKG: Taxes on capital received by
the government
D7 other current
transfers
D62
social benefits other than social transfers in kind
(rw, dic) 5 158
(h, g) 23 046
TRGH: Transfers from the government to the
households D7 other current
transfers (dic, rw) 4 603
D8
adjustment for the change in the net equity of households in pension funds reserves
D92 investment
grants (dik, dik) 8 174
(rw, dik) 114
(g, rw) 2 554
TRRoWG: Transfers from the rest of the
world to the
government D99
other capital transfers
(dik, rw) 2 404
KT: capital transfers D9 = D91 +
D92 + D99
capital transfers = capital taxes + investment grants + other capital transfers
b)in the current and capital transfers with the rest of the world , (A) only considers a part of the transfers recorded from the rest of the world to the government
c)a part of the current transfers between government and households is not considered in (A)
(dif, dif) 37 825
(dif, rw) 31 113
(rw, dif) 18 779
FT: financial
transactions F1-7
financial transactions
(A) does not consider financial transactions.
The Underlying Database of an Instrument for Economic and Social Policy Analysis for the
Azores. Application and Extension to 2005. SSantos (April, 2011)
3.Sources of information and methodological details of the CGE database for Portugal and
the Azores in 2005.
This section is designed to be a practical and methodological guide to the work undertaken. It is
intended for those who are going to use models supported by the constructed databases, since the
analysis of the corresponding results should bear in mind the underlying data. On the other hand, it
also intended to serve as a working hypothesis for those seeking to undertake a similar task.
The following description is organised into sub-sections related with the respective National
Accounts transactions, taking into account the submatrices described in Table 1.
For the submatrices to which the adoption of the RAS procedure relates, the methodology described
in Santos (2009: 16-31) was followed, with appropriate adaptations.
Appendix A.5 shows the links for the sources of information available on the Internet.
a) XD – Domestic Production (National Accounts transaction P1 – output of goods and services, at
basic prices); IO – Intermediate Consumption (National Accounts transaction P2, at purchasers’
prices)
Sources:
1. Statistics Portugal (INE): National Accounts (in: GDP INCREASED 1.4% in volume and 4.2%
in nominal terms – 2006, Excel file – Tables 9.11 and 8.6).
2. Statistics Portugal (INE): National Accounts by Regions - Valor Acrescentado Bruto por região NUTS I e II segundo a classificação de actividades A17 (in: Regional accounts (Base 2000) – 1995-2005, XLS – NUTS 2002, Tables 4);
3. SAM for the Azores in 2001.
Data for Portugal were collected directly from source 1.
In the case of the Azores, for each of the 17 industries (see Table A.4.1, in the Appendix), given by
source 2:
- the amount of XD (P1) was calculated by considering the gross added value (GAV) for the
Azores given by the source for 2005 (INE) and the share of domestic production (P1) in GAV
in the SAM for the Azores 2001, in accordance with the equation:
- the amount of IO (P2) was estimated by deducting GAV for the Azores from the (estimated) XD
(IO(SAM)Az05= XD(SAM)Az05-GAV(INE)Az05).
=
01 Az ) SAM (
01 Az ) SAM ( 05
Az ) INE ( (SAM)Az05
GAV XD * GAV
The Underlying Database of an Instrument for Economic and Social Policy Analysis for the
Azores. Application and Extension to 2005. SSantos (April, 2011)
For the industries within each of the 17 activity sectors the same structure was adopted as in the
SAM for the Azores 2001 (source 3).
As was the case in 2001 for the Azores, in both SAMs, it was assumed that the domestic production
matrix (XD) is a diagonal matrix.
b) C - Final Consumption of the households and CG - Final Consumption of the government
(National Accounts transaction P3 – final consumption expenditure, at purchasers’ prices).
Sources:
1. Statistics Portugal (INE): National Accounts (in: GDP INCREASED 1.4% in volume and 4.2%
in nominal terms – 2006, Excel file - Tables 3.7, 3.11 and 8.6);
2. Statistics Portugal (INE): Household Budget Survey - Inquérito às despesas das famílias - 2005 /2006, Excel file – Tables A.5 and A.8;
3. SAM for the Azores in 2001.
The data for Portugal were directly collected from source 1 (Tables 3.11 and 8.6), except in the case
of the distribution of final household consumption by group of households, which was estimated
from the structure of expenditure (by group) given by source 2.
Since the amounts for the Azores in 2005 were not available, it was assumed that the shares of the
Azorean C and CG in the Portuguese C and CG were the same in 2001 and 2005. The following
estimations were therefore made:
where: C(INE)Pgal = final consumption expenditure of households
CG(INE)Pgal = final consumption expenditure of the general government and of the
non-profit institutions serving households
The same distribution of total final consumption (C and CG(SAM)Az05) by commodity as in 2001
(source 3) was adopted. On the other hand, the distribution of final household consumption
(C(SAM)Az05) by group of households was calculated in the same way as described for Portugal.
The final consumption of the government includes that of the NPISH.
=
01 Pgal ) INE (
01 Az ) SAM ( 05
Pgal ) INE ( (SAM)Az05
CG and C
CG and C * CG
and C CG
The Underlying Database of an Instrument for Economic and Social Policy Analysis for the
Azores. Application and Extension to 2005. SSantos (April, 2011)
c) I – Investments (National Accounts transactions P51- gross fixed capital formation, and P53 -
acquisitions less disposals of valuables, at purchasers’ prices) and SV – Changes in Inventories by
commodity and SC – Total Changes in Inventories (National Accounts transaction P52 - changes in
inventories, at purchasers’ prices)
Sources:
1. Statistics Portugal (INE): National Accounts (in: GDP INCREASED 1.4% in volume and 4.2%
in nominal terms – 2006, Excel file – Tables 3.7, 3.11 and 8.6).
2. Statistics Portugal (INE): National Accounts by Regions - Formação Bruta de Capital Fixo por região NUTS I e II (in: Regional accounts (Base 2000) - 1995-2005, XLS – NUTS 2002, Table 3);
3. SAM for the Azores in 2001.
Source 1 (Table 8.6) provided all the data for Portugal.
The total investment (I) for the Azores in 2005 is the gross fixed capital formation, given by source
2, adopting the same structure of investment by commodities as in the SAM for the Azores in 2001
(source 3), since the former source only contains information by sector of activity (or industry).
Source 2 does not contain any information on changes in inventories, so that the total amount for
the Azores (SC(SAM)Az05) was calculated from the total amount for Portugal (SC(INE)Pgal05),
assuming that the share of the former in the latter was the same as in 2001:
The changes in inventories by commodity (SV) were also calculated by adopting the same structure
of investment by commodities given by source 3.
d) SH – Households Savings, SG – Government Savings (part of the National Accounts Balance
B8g – gross saving) and SRoW – Foreign Savings (part of the National Accounts Balance B9 – net
lending (+)/borrowing (-))
Sources:
1. Statistics Portugal (INE): National Accounts (in: GDP INCREASED 1.4% in volume and
4.2% in nominal terms – 2006, Excel file – Table 3.7 and 3.11);
2. Statistics Portugal (INE): Household Budget Survey - Inquérito às despesas das famílias - 2005 / 2006, Excel file – Tables A.5 and A.8;
=
01 Pgal ) INE (
01 Az ) SAM ( 05
Pgal ) INE ( (SAM)Az05
SC SC * C
The Underlying Database of an Instrument for Economic and Social Policy Analysis for the
Azores. Application and Extension to 2005. SSantos (April, 2011)
3. SAM for the Azores in 2001.
Here, SH is the part of the households’ income that was not expended in final consumption and
taxes on income. SG is the part of the government’s income that was not expended in final
consumption and transfers to the households. SRoW corresponds to the part of investment that is not
covered by domestic funds.
The totals were therefore calculated from the difference between the items referred to above, which
explains their non-consonance with those of source 1 (Table 3.11), in the case of Portugal.
The distribution of the Portuguese households’ savings by group was estimated from the structure
of expenditure (by group), given by source 2. In turn, in the disaggregation of foreign savings by
world zones, the same structure was adopted as for the disaggregated Rest of the World account for
2002, produced by Statistics Portugal (INE).
In the case of the Azores, the distribution of the households’ savings by group and of foreign
savings by world zones was calculated by adopting the structures of source 3.
e) DEPR
This item is like a residual that can be defined in accordance with the following two perspectives.
The column perspective, in which totals represent the total outlays of activities; equal in turn to the
corresponding gross output delivered to the domestic market and exported (represented in the row).
That is: XD = IO + K + L + TRPS + TRP + TRL + TRK + DEPR, where L+TRL = Compensation
of employees (National Accounts transaction D1) and K is the part of the compensation of capital
received by households (National Accounts transaction B3g – gross mixed income), TRK+DEPR
will correspond to the amount of the compensation of capital received by the institutional sectors,
other than households (B2g – gross operating surplus), although TRK is a tax on income paid by
firms7.
The row perspective, in which totals represent savings or investment funds; equal in turn to the
corresponding investment. That is: DEPR + SH + SRoW = I + SC. DEPR will therefore correspond
to the part of investment funds not covered by the households’ savings (SH) and foreign savings
(SRoW), described in d).
7