M
ASTER IN
FINANCE
M
ASTER
´
S
F
INAL
W
ORK
D
ISSERTATION
I
NDUSTRY
S
PECIFICITIES AND
D
EBT AFTER
P
RIVATIZATION
:
E
VIDENCE FROM
E
UROPEAN
F
IRMS
D
ÉCIO
A
RLINDO DA
C
UNHA
C
HILUMBO
M
ASTER IN
FINANCE
M
ASTER
´
S
F
INAL
W
ORK
D
ISSERTATION
I
NDUSTRY
S
PECIFICITIES AND
D
EBT AFTER
P
RIVATIZATION
:
E
VIDENCE FROM
E
UROPEAN
F
IRMS
D
ÉCIO
A
RLINDO DA
C
UNHA
C
HILUMBO
SUPERVISION:
PROFESSOR VICTOR MAURÍLIO SILVA BARROS
i
Abstract
This paper aims to study the effect of privatization on capital structure decisions,
taking into account industry characteristics and capital structure variations across industries.
A differences-in-differences model was applied to capture the effects of capital structure
derived from the privatization. The results suggest that there is no evidence that leverage
ratios are affected by the process of privatization. We then conduct a deeper analysis for
Poland, a country engaged in a large scale privatization program in a short time period, and
find different results. For Polish privatized firms, there is a significant evidence of increases
in the debt ratios after privatization. Regarding the industry component of this paper, results
suggest that firms in capital intensive industries have higher levels of leverage derived from
the privatization.
JEL Classification: G32; L33
ii
Resumo
O objetivo desta dissertação é analisar o efeito das privatizações nas decisões de
estrutura de capital das empresas, tendo em consideração as diferentes características que
cada indústria apresenta e variações na estrutura de capital entre indústrias. Para capturar os
efeitos da estrutura de capital ao longo do tempo, foi aplicado um modelo de
diferenças-das-diferenças. Os resultados mostram que não há evidência de que os rácios de dívida são
afetados pelo processo de privatização. Posteriormente, foi feita uma análise mais profunda
para Polónia, um país alvo de um programa de privatização em larga escala num curto espaço
de tempo e foram encontrados resultados diferentes. Para empresas polacas, existe evidência
de um aumento do rácio de dívida, após a privatização. Relativamente à componente
indústria, abordada neste estudo, os resultados sugerem que empresas baseadas em indústrias
intensivas em capital terão níveis mais altos de dívida, após a privatização.
Classificação JEL: G32; L33
iii
Acknowledgements
Firstly, I would like to express my sincere gratitude to my supervisor Victor Barros,
for the help and guidance provided and the availability showed during these past months. His
knowledge and patience were crucial to me during this process.
I would also like to thank my friends for their encouragement showed along the way.
Last but not least, I would like to thank my family, specially my parents and my
brother for their continuous support and encouragement, not only during this journey but also
iv
Table of Contents
ABSTRACT ... i
RESUMO ... ii
ACKNOWLEDGEMENTS ... iii
LIST OF TABLES ... v
LIST OF FIGURES ... v
1 INTRODUCTION ... 1
2 LITERATURE REVIEW... 4
2.1 PRIVATIZATION ... 4
2.2 CAPITAL STRUCTURE ... 6
3 RESEARCH HYPOTHESES, DATA AND SAMPLE SELECTION ... 11
3.1 RESEARCH HYPOTHESES ... 11
3.2 DATA AND SAMPLE SELECTION... 13
4 METHODOLOGY ... 14
4.1 MEASURING LEVERAGE ... 14
4.2 ECONOMETRIC APPROACH ... 15
4.3 DESCRIPTIVE STATISTICS ... 18
5 EMPIRICAL RESULTS ... 19
5.1 LEVERAGE RATIO AFTER PRIVATIZATION ... 20
5.2 LEVERAGE RATIO AND THE TYPE OF PRIVATIZATION ... 21
5.3 LEVERAGE AND OWNERSHIP STRUCTURE ... 21
5.4 LEVERAGE AND INDUSTRY INFLUENCE ... 22
5.5 LEVERAGE AND CAPITAL INTENSIVE INDUSTRIES ... 23
5.6 CASE STUDY - POLAND ... 23
5.7 ROBUSTNESS CHECK ... 25
6 CONCLUSION ... 25
7 REFERENCES ... 28
v
List of Tables
Table 1 – Countries and Industries present in the sample ... 333
Table 2 - Variable Definition ... 344
Table 3 – Descriptive Statistics ... 366
Panel A: Regression Variables ... 36
Panel B: Debt Ratios before and after Privatization ... 37
Table 4 – Pearson Correlation Matrix ... 38
Table 5 – Effect of Privatization on Capital Structure ... 39
Table 6 – Effect of the Privatization Type and the Ownership Stucture on Capital Structure, after Privatization ... 40
Table 7 – Industry Influence on Capital Structure after Privatization ... 41
Table 8 – Capital Intensive Industries and Capital Structure, after Privatization ... 43
Table 9 – Polish Case Study ... 45
Table 10 – Time Span Analysis (H1) – Robustness Check ... 46
List of Figures
Figure 1 - Debt ratio evolution on the sample firms, over time ... 3221
1
Introduction
This study aims to relate the concept of capital structure with the subject of
privatization, with the intent of analyzing the specificities of different industries and how
firms’ capital structure decisions are affected, post-privatization. We also take advantage of
an additional analysis on Polish privatizations to assess our findings in a context of a massive
program of privatizations in a short-time period.
Over the last decades, privatizations gained predominance in terms of the common
policies carried out by countries worldwide, because of three main reasons (Vickers and
Yarrow, 1988): i) contribution to reduction of public deficit, given by the income generated
by the sale of the privatized firms; ii) increased efficiency of the privatized firms; iii)
increased opportunities for redistribution of income and wealth, as privatization allows the
easier access to capital markets. Governments are increasingly resorting to privatization
programs because of the three reasons above and also because, over the years, there is proof
of successful privatization policies that boosted countries’ economies (Gilroy and Moore,
2013).
Previous literature studies the relationship between privatization and capital structure
and in general, it documents that following the process of privatization leverage ratios
decrease (Boubakri and Cosset, 1998; Arcas and Bachiller, 2008; Chahyadi, 2008).
Traditionally, state-owned firms have higher levels of leverage because their only access to
equity is through retained earnings and capital injections from the government (Ferreira,
2012).
Despite the contributions to the literature, few studies have investigated the influence
2
privatization. Hall et al. (2000) studied the relationship between the determinants of capital
structure for small and medium firms from the UK and industry effects and how these
determinants’ effect on long and short-term debt would differ across industries. Nevertheless,
this paper does not cover the topic of privatizations and their impact on capital structure.
To perform this study, we gathered a list of privatized firms from the Privatization
Barometer and accounting data from the Amadeus Bureau Van Dijk database for private
firms and from Bloomberg for publicly traded firms. The sample runs from 2006 through to
2015 and contains 574 firm-year observations from 67 privatized firms based in 18 countries
and classified in 10 different industries.
Our results suggest that there is no evidence for the process of privatization to be
relevant to explain capital structure decisions, except when firms are inserted in a large-scale
privatization plan. Poland is an example of a privatization program launched by the
government during our period of study and therefore, a separate test was performed on Polish
firms. When tested alone, we found evidence of an increase of leverage, after privatization.
We did not find statistical difference on levels of debt when comparing the type of ownership
and the type of privatization. Industry specificities are relevant to explain capital structure
variations across industries (Myers, 1984) and the findings in this study support this
conclusion. Firms in industries that are capital intensive tend to have higher levels of
leverage, following privatization.
These outcomes make a contribution to the literature in a sense that they suggest that,
when governments interfere on privatizations, through the implementation of privatization
programs at a country level, this approach may be relevant to explain firms’ capital structure
3
The remainder of this study is structured as follows. Section 2 contains previous
literature on the topic of capital structure and privatization. Section 3 presents the research
hypotheses and the data. Section 4 covers the methodology approached in this paper. Section
4
2
Literature Review
2.1 Privatization
Privatization is a term that has two different meanings. Firstly, it corresponds to the
process of transferring full or partial firm ownership from a government organization to a
privately owned entity. Secondly, a definition that is widely accepted is that privatization
occurs when a publicly traded company is bought by a private group of investors, making it
no longer listed on the stock exchange. Savas (2000) describes privatization as the “act of
reducing the role of government or increasing the role of the private institutions of society in
satisfying people’s needs”. The focus on this paper is on the first definition described above.
There are various types of privatization strategies, as suggested by Eaton (1989), but
Megginson et al. (2004) state that most frequently, governments choose between three forms:
i) the asset sales method, where the government sells company assets (typically through an
auction) to a small group of investors; ii) through share issue (SIPs), in which equity shares
are sold in the public stock markets; iii) through vouchers, that represent part ownership in
formerly state-owned firms and that are distributed to all citizens for free or at a very low
price. The authors added that SIPs are the largest and most economically important
privatizations, although governments that have less state control over the economy tend to
go through asset sales.
As indicated before, privatization can be full or partial, in the sense that the
government can transfer the entirety of the ownership to the private sector or not. This
ownership transfer to the private sector is complete, different from a public-private
partnership, where a concession contract is agreed upon between the public and the private
5
Renneboog, 2016). Gupta (2005) claims that the majority of privatization programs of
significant size start with partial privatization, in which only non-controlling shares of firms
are sold in the stock market. Under the same conditions, Sheshinski and López-Calva (1998)
show evidence that fully privatized firms should perform better than partially privatized
firms.
Empirical studies, such as D’ Souza and Megginson (1999), Boubakri and Cosset
(1998), found that privatized firms had significant increases in profitability, sales, operating
efficiency and dividend payments combined with a substantial decrease in leverage ratios.
Harper (2002) suggests that in more stable and developed economic and financial markets,
the benefits that come with privatization are amplified.
Chahyadi (2008) and Arcas and Bachiller (2008) investigated the capital structure
determinants for privatized firms. The authors found that, similarly to other studies, firms are
less leveraged following privatization. Chahyadi (2008) added that privatized firms have a
target capital structure and it does not change randomly over time. According to Borisova
and Megginson (2011), privatizing firms face a higher cost of debt as state ownership
diminishes because bond investors could demand higher spreads, especially if the process of
privatization occurs through several phases. This may explain why firms’ leverage ratios
suffer a decline after privatization.
Ownership in firms that were privatized has a major role on their performance
post-privatization (D’ Souza et al., 2005). According to Boubakri and Cosset (1998), private
owners that are more focused on profits and carry out new investments that increase output
and employment are more common in privatized firms, and as a result, efficiency improves
6
efficiency gains from the change in ownership structure in competitive sectors, given that
those sectors have less government controls on prices and quantities. From previous studies
there is evidence that, in part, the effect of privatization is caused by new human capital.
Boycko et al. (1996) developed a model that could explain the increased efficiency of
privatized firms. The authors concluded that privatization is more effective when combined
with a tight monetary policy and the presence of outside investors rather than managers also
increases efficiency. Frydman et al. (1999) observed that, in the context of Central Europe,
privatization has no effect on any performance measure when firms are controlled by
managers, as opposed to outside investors. This result can be explained by the influence that
communism had on the market economy of the region.
D’Souza et al. (2005) show that employment after privatization and foreign
ownership are negatively correlated. Azmat et al. (2011) studied the relationship between the
process of privatization and the labour’s share. They came to the conclusion that privatization
is the reason for a decline, on average, of the labour’s share in 20%, in OECD countries,
mainly due to the lower number of jobs.
Carter (2013) proposed that, the more important industries are to a country’s economy
and social welfare, the less likely firms from these industries will be privatized. Harper
(2002) brings evidence that, after privatization, firms and industries that have lower fixed
cost structures tend to have better performance results than other industries.
2.2 Capital Structure
Capital structure can be defined as the way a company finances its operations. There are
7
In the words of Myers (2001), “capital structure attempts to explain the mix of securities and
financing sources used by corporations to finance real investment”.
When it comes to capital structure, one cannot neglect the importance that Modigliani
and Miller (1958) had by being pioneers in deepening the research on this matter. In their
seminal article, they introduced two propositions that lead to the conclusion that there is no
such thing as an optimal capital structure. Assuming perfect capital markets (non-existence
of taxes, no transaction or bankruptcy costs), choosing the amount of debt and equity is
irrelevant for the value of the firm, hence the “irrelevance theory”. Years later, Modigliani
and Miller (1963) made a correction on the previous article and introduced taxes. The authors
reached the conclusion that, taking advantage of the tax benefits when there is debt, firms’
value would increase if they financed themselves through debt rather than equity and
therefore, firms can have an optimal capital structure.
Modigliani and Miller (1958) set the foundation for many other research articles and
also to one of the two main theories regarding capital structure: the “trade-off theory”. The
theory is based on the idea that there is an optimal capital structure that maximizes the value
of a company, by balancing the benefits of debt (interest tax shields) and its costs (costs of
financial distress and agency costs of debt). Bradley et al. (1984) show that leverage is
inversely related with costs of financial distress. Under the assumptions of imperfect capital
markets and the possibility that a firm can go bankrupt, Scott (1976) proved that there is only
one optimal capital structure. Other main component that is dealt with in this theory is the
concept of agency theory. Firstly investigated by Jensen and Meckling (1976), this topic
concerns the relationship between principals and agents in a business, in which there are
8
Barbosa et al. (2012) claim that leverage and privatization are positively correlated,
with this result being in line with the agency theory, as firms usually choose to increase the
levels of leverage to discipline managers. Errunza and Mazumdar (2001) argue that if
bankruptcy costs after privatization are high, firms may have to reduce their leverage levels,
so that privatization has a positive effect on the firm.
According to previous studies on this topic (e.g. Hovakimian et al., 2001; de Jong et
al., 2011), the “trade-off theory” suggests that the leverage has a positive relationship with
the size and profitability of the firm, the tangibility of assets, the use of taxes and also that
high industry median leverage should bring more debt. When it comes to growth the
prediction is that, due to increasing costs of financial distress, the relationship between this
variable and leverage should be negative (Frank and Goyal, 2009).
The second main theory is known as the “pecking order theory”. It was based on a
study by Donaldson (1961) and then developed by Myers and Majluf (1984). This theory
states that the cost of financing increases with asymmetric information between managers
and outside investors and thus, firms will prefer internal financing to external financing,
through retained earnings. When firms resort to external funds, the preferred source is debt
over equity because of lower adverse selection costs. In addition to that, there is no target
capital structure as the firms adapt their debt-to-equity ratio to their financing needs.
Arcas and Bachiller (2008) mention that, according to the pecking order theory, the
process of privatization has a negative effect on leverage because firms will prefer to use
their own funds.
Concerning the relationship between leverage and other variables that can exert some
9
between leverage and size; leverage and profitability and leverage and tangibility of assets
(Frank and Goyal, 2009). Opposing the “trade-off theory”, growth and leverage are positively
related. Myers (2001) claims that the “pecking order theory” may explain why larger and
more profitable firms use less debt; due to the fact that these firms have more internal
financing available to apply in other investments.
Harris and Raviv’s article (1991) comprises several theories, addressed in previous
years, about capital structure and, consequently, various results that are summarized. From
the compilation of articles, the results lead to believe that the “pecking order theory” is a
strong predictor on firms’ capital structure decisions. Myers and Shyam-Sunder (1999) argue
that the “pecking order theory” explains well the financing decisions, based on their global
sample of mature firms. According to Graham and Harvey (2001), CFO’s tend to rely on
both trade-off and pecking order theories for the capital structure decisions. Hovakimian et
al. (2001) and Abe de Jong et al. (2010) both suggest that, while the “pecking order theory”
describes well the firms’ issue decisions, the “static tradeoff theory” is better in what regards
repurchase decisions.
Regarding the influence that industries have on capital structure, Talberg et al (2008)
demonstrate that there is a major difference on the capital structure, depending on the industry
a company is inserted. Myers (1984) argues that because the asset type, asset risk and
requirements for external funds are different from industry to industry, this will lead to
different average debt ratios across industries, if the theory is correct. Across industries,
Degryse et al. (2012) claim that the effects of firm characteristics on leverage for each
industry are mostly in line with the “pecking order theory”. Bradley et al. (1984) infer about
10
similarities on those ratios intra-industry. Regarding the degree of industry competition, Fosu
(2013) found evidence that industries inserted in more competitive environments have more
benefits when they increase leverage. The author relies on the Herfindahl-Hirschman Index
to define industry competition. On the other hand, MacKay and Phillips (2005) affirm that
the leverage ratio is higher and less dispersed in concentrated industries. The authors also use
the Herfindahl-Hirschman Index to capture industry concentration. Higher values on this
index indicate less competitive environments and more concentrated industries.
Leverage decisions are largely influenced by the type of investments a firm
undertakes (Long and Malitz, 1985). Gupta (1969) found a positive relation between the
leverage ratio and fixed assets turnover, meaning that industries with a high level of fixed
asset turnover tend to have more debt.
Capital markets can also affect capital structure. Grinblatt and Titman (1998) suggest that
the globalization of capital markets has contributed to a decrease of the cost of borrowing,
encouraging the use of more debt. Faulkender and Petersen (2004) came to the conclusion
that firms that have access to public debt markets tend to have higher leverage ratios than
those that don’t have access. The authors also state that capital structure decisions are limited
by the capital markets. Berger et al. (1997) examined the connection between capital structure
decisions and managerial entrenchment. The authors find that entrenched managers can have
an impact on firms’ capital structure decisions, with most of the results suggesting that
leverage ratios decrease when the degree of managerial entrenchment rises. Regarding the
managers’ characteristics, Antonczyk and Salzmann (2014) and Fauver and McDonald
(2015) claim that firms in countries whose managers are more individual - i.e., that believe
11
Fauver and McDonald (2015) added that risk aversion brings a significant and negative effect
on firms’ debt ratio.
3
Research Hypotheses, Data and Sample Selection
3.1 Research Hypotheses
This research aims to test the effect of the process of privatization on firms’ capital
structure decisions, with the intent of analyzing the specificities of different industries, as the
academic literature provides little information regarding these three main concepts.
Research Question: How do different industry characteristics affect capital structure
decisions, after privatization?
Chahyadi (2008) documents that, when state-owned firms initiate a privatization
process, their leverage ratios should decrease because there is an additional source of external
capital, through equity. In addition to the reasons stated above in the literature review
(Boubakri and Cosset, 1998; D’Souza and Megginson, 1999), this gives the motivation to
test the first research hypothesis:
H1: The level of leverage decreases after privatizations, for all privatized firms
According to the academic literature (e.g. Megginson et al., 2004 D’Souza et al.,
2005), share issue privatizations (SIPs) are the largest so it is predictable that the largest firms
go through this method of privatization, although the asset sale method is more frequent. If
12
suggesting that their debt-to-equity ratio would be smaller. Therefore, the second research
hypothesis is as follows:
H2: The decrease in the level of leverage after privatizations is lower for privatizations
through asset sale
Regarding ownership structure, Borisova and Megginson (2011) found evidence for
a decrease in the cost of debt for fully privatized firms, when compared to firms that are
partially privatized, suggesting that there is easier access for fully privatized firms to finance
their investments through debt. This outcome suggests our third hypothesis:
H3: The decrease in the level of leverage after privatizations is higher for partially privatized
firms
Talberg et al. (2008) claim that each industry has its own reaction to changes in
market conditions. Berman and Pfleeger (1997) added that some industries may be relatively
immune to business cycles while others are very sensitive. The authors found evidence that
industries such as consumer-related services, construction and manufacturing are mostly
correlated with business cycles. According to Opler and Titman (1994), highly leveraged
firms in industries experiencing economic declines tend to experience losses on profits, when
compared to firms with lower leverage. Given that leverage variations are highly dependent
13
inverse relationship between leverage and profitability (Titman and Wessels, 1988), the
fourth research hypothesis is the following:
H4: The decrease in the level of leverage after privatizations is less significant for firms
inserted in industries mostly correlated with business cycles - Construction and Trade (retail)
Arsov and Navmoski (2016) stated that firms investing more heavily in fixed assets
have shown higher levels of leverage, even though their sample selection consisted in only 4
countries. Nevertheless, previous studies, such as Talberg et al. (2008), corroborate with this
conclusion, which gives us reason to test the following hypothesis:
H5: The decrease in the level of leverage after privatizations is lower for firms inserted in
capital intensive industries
3.2 Data and Sample Selection
The sample comprises 574 firm-year observations from 67 European privatized firms,
24 of which currently listed on a public stock exchange. The list of privatized firms was taken
from the Privatization Barometer database1 and the accounting data was obtained from the
database Amadeus Bureau Van Dijk for private firms and from Bloomberg for publicly
traded firms. The privatization of these firms occurred from 2009 through to 2013 and the
period for the financial statements data ranges from 2006 to 2015. Firms were excluded from
the sample because: i) the accounting data did not provide observations from at least two
years before and after the privatization; ii) some privatization deals that are registered on the
Privatization Barometer database ended up not happening; iii) other firms listed on this
14
database were already fully private, before the period of study. For this research, the goal
was to have a uniform and diverse sample, without the presence of privatization programs.
For this reason, Polish firms were excluded from this sample, since the country underwent a
massive privatization plan from 2008 until 2012 and therefore, could have a big influence in
our results. This case will be treated separately and analyzed on Section 5. Regarding the
countries that are included in the sample, it is important to note that Italy accounts for the
most observations. When it comes to the industries present in the sample, the one with the
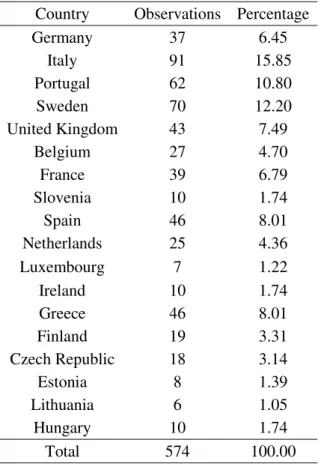
most observations is the Utilities industry. Table 1 describes the countries and the industries
that are included in this study.
4
Methodology
4.1 Measuring Leverage
Leverage can be defined as a ratio of debt to total assets. Across the literature, the
definition of this variable can have slight differences. Boubakri and Cosset (2013) and Frank
and Goyal (2009) consider that leverage ratios should take into account both short-term and
long-term debt. Other authors such as Talberg et al (2008) and Chahyadi (2008) argue that
only long-term debt should be considered for the measure of leverage, because trade credit
is associated with short-term debt and can influence the operations of the firm. Keeping in
mind that the industry component is also present and different industries display different
characteristics, also when it comes to debt usage, in this research the focus will be on the
following ratio:
15
4.2 Econometric Approach
Most empirical studies present in the literature regarding privatized firms’
performance carry out the Wilcoxon signed-rank test in order to analyze the impact of
privatization on the variables in study (e.g., D’ Souza and Megginson, 1999; Arcas and
Bachiller, 2008; Harper,2002) . In this research, as the main objective is to test the effect of
privatization on capital structure over time, we considered that it was adequate to apply
differences-in-differences models. This method allows to examine the influence of an event
on the dependent variable by comparing the estimated averages of two groups, one before
the event and one after the event. In this case, the event is the process of privatization.
In order to evaluate these effects, a dummy variable was created, Privatization, which
is equal to 1 from the year when a firm is privatized onwards, and 0 otherwise.
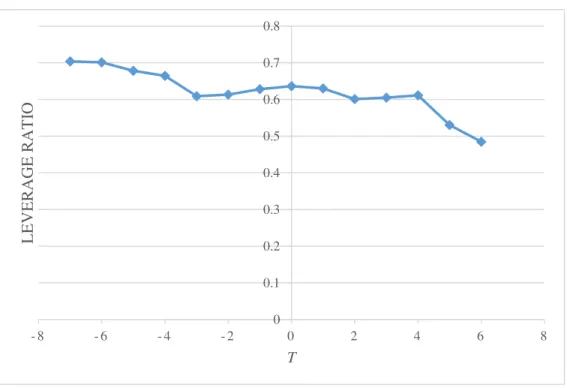
As a starting point for the empirical study of the research question in the paper, we
have included, in the Appendix, a graph (see Figure 1) that illustrates the effect that time has
on the sample firms’ leverage ratio, in which a relationship was established between the mean
of the ratio of debt to assets and t, which corresponds to the year of privatization of any firm
in the sample. In this graph we can see the evolution of the ratio over time, starting from t-7
until t+6. The graph begins with the debt ratio on the highest point (0.703) and it decreases
until t-3 (0.609). The average debt ratio goes up until t (0.636), where it starts decreasing
again until t+2 (0.601), rising until t+4 (0.611) and finally decreasing, reaching its lowest
point in t+6 (0.485). The main conclusion to take from this analysis is that, after privatization,
the average debt ratio values tend to decrease over time, which is consistent with the
16
To test the first research hypothesis, the following equation was estimated:
𝐿𝐸𝑉𝐸𝑅𝐴𝐺𝐸𝑖𝑡 = 𝛽0+ 𝛽1𝑃𝑟𝑖𝑣𝑎𝑡𝑖𝑧𝑎𝑡𝑖𝑜𝑛𝑖𝑡 + 𝛽2𝐸𝐵𝐼𝑇𝑚𝑖𝑡+ 𝛽3𝐿𝑛𝐴𝑠𝑠𝑒𝑡𝑠𝑖𝑡+
𝛽4𝐹𝑖𝑥𝑒𝑑𝐴𝑠𝑠𝑒𝑡𝑠𝑖𝑡 + 𝛽5𝐸𝑓𝑓𝑖𝑐𝑖𝑒𝑛𝑐𝑦𝑖𝑡+ 𝛽6𝐺𝐷𝑃𝑖𝑡 + 𝛽7𝑀𝑜𝑛𝑒𝑦𝑆𝑢𝑝𝑝𝑙𝑦𝑖𝑡+ 𝛽8𝑀𝑘𝑡𝐶𝑎𝑝𝑖𝑡+
∑10𝑡=1𝛿𝑡+ ∑12𝑧=1𝜑𝑧+ ∑18𝑐=1𝛾𝑐+𝜀𝑖𝑡𝑧𝑐 (eq.1)
where 𝛿𝑡 is the time fixed-effect variable for year t; 𝜑𝑧 is the industry fixed-effect
specification for industry z and 𝛾𝑐 is the country fixed-effect variable for country c.
LEVERAGE represents the measure of leverage explained above. To control for firms’
characteristics, common capital structure determinants present in the literature were used as
variables. EBITm is equal to the ratio of EBIT to sales and, according to Hall et al. (2000),
can be used as a proxy for profitability. LN ASSETS is the logarithm of the total assets of the
firm and is used as an approximation for the firm’s size. FIXED ASSETS is equal to the ratio
between fixed assets and total assets of the firm. EFFICIENCY is denoted as the ratio of sales
to assets and is used as a proxy for efficiency. Also, some country level variables were
included. GDP is equal to the logarithm of the yearly GDP. MONEY SUPPLY is defined as
the ratio of a country’s money supply to the GDP2. MARKET CAPITALIZATION is defined
as the total value of all listed shares in a country’s stock market divided by the GDP. These
three country level variables were included to verify if the growth of a country’s economy,
the improvement of the access of the financial system and the development of the financial
markets are indeed important factors on capital structure ratios. All firm-specific and
17
specific control variables will be applied in every equation. The standard errors were
computed using White’s robust procedure. Table 2 shows the definitions of all variables.
To test the second research hypothesis, we added the interaction
𝑃𝑟𝑖𝑣𝑎𝑡𝑖𝑧𝑎𝑡𝑖𝑜𝑛 × 𝑇𝑦𝑝𝑒 in which Type is a dummy variable that is equal to 1 if a firm is
privatized through asset sale and 0 if it is privatized through share issue. The equation is
presented below:
𝐿𝐸𝑉𝐸𝑅𝐴𝐺𝐸𝑖𝑡 = 𝛽0+ 𝛽1𝑃𝑟𝑖𝑣𝑎𝑡𝑖𝑧𝑎𝑡𝑖𝑜𝑛_𝑇𝑦𝑝𝑒𝑖𝑡+ 𝛽2𝑃𝑟𝑖𝑣𝑎𝑡𝑖𝑧𝑎𝑡𝑖𝑜𝑛𝑖𝑡+ 𝛽3𝐶𝑜𝑛𝑡𝑟𝑜𝑙𝑠𝑖𝑡+
∑10𝑡=1𝛿𝑡+ ∑12𝑧=1𝜑𝑧+ ∑18𝑐=1𝛾𝑐+𝜀𝑖𝑡𝑧𝑐
(eq.2)
To test the third research hypothesis, we added the interaction
𝑣𝑎𝑡𝑖𝑧𝑎𝑡𝑖𝑜𝑛 × 𝑃𝑎𝑟𝑡𝑖𝑎𝑙 , which is an interaction term between Privatization and the dummy
Partial, which is equal to 1 if the privatization is partial and is equal to 0 if the firm is fully
privatized and also the interaction term 𝑃𝑟𝑖𝑣𝑎𝑡𝑖𝑧𝑎𝑡𝑖𝑜𝑛 × 𝑃𝑎𝑟𝑡𝑖𝑎𝑙 × 𝑃𝑒𝑟𝑐𝑒𝑛𝑡𝑎𝑔𝑒, which is
a variable that describes the percentage of privatization for each firm. This is a similar
approach to Borisova and Megginson (2011).The equation is the following:
𝐿𝐸𝑉𝐸𝑅𝐴𝐺𝐸𝑖𝑡 = 𝛽0+ 𝛽1𝑃𝑟𝑖𝑣𝑎𝑡𝑖𝑧𝑎𝑡𝑖𝑜𝑛_𝑃𝑎𝑟𝑡𝑖𝑎𝑙𝑖𝑡+
𝛽2𝑃𝑟𝑖𝑣𝑎𝑡𝑖𝑧𝑎𝑡𝑖𝑜𝑛_𝑃𝑎𝑟𝑡𝑖𝑎𝑙_𝑃𝑒𝑟𝑐𝑒𝑛𝑡𝑎𝑔𝑒𝑖𝑡+ 𝛽3𝑃𝑟𝑖𝑣𝑎𝑡𝑖𝑧𝑎𝑡𝑖𝑜𝑛𝑖𝑡 + 𝛽4𝐶𝑜𝑛𝑡𝑟𝑜𝑙𝑠𝑖𝑡+
∑10𝑡=1𝛿𝑡+ ∑12𝑧=1𝜑𝑧+ ∑18𝑐=1𝛾𝑐+𝜀𝑖𝑡𝑧𝑐
18
To evaluate the impact of an industry on leverage after privatization, a new variable
was included, 𝑃𝑟𝑖𝑣𝑎𝑡𝑖𝑧𝑎𝑡𝑖𝑜𝑛 × 𝐼𝑛𝑑𝑢𝑠𝑡𝑟𝑦.This variable consists on an interaction between
Privatization and each industry present in the sample. The equation is presented below:
𝐿𝐸𝑉𝐸𝑅𝐴𝐺𝐸𝑖𝑡 = 𝛽0+ 𝛽1𝑃𝑟𝑖𝑣𝑎𝑡𝑖𝑧𝑎𝑡𝑖𝑜𝑛𝑖𝑡 + 𝛽2𝑃𝑟𝑖𝑣𝑎𝑡𝑖𝑧𝑎𝑡𝑖𝑜𝑛_𝐼𝑛𝑑𝑢𝑠𝑡𝑟𝑦𝑖𝑡𝑧+
𝛽3𝐶𝑜𝑛𝑡𝑟𝑜𝑙𝑠𝑖𝑡+ ∑10𝑡=1𝛿𝑡+ ∑12𝑧=1𝜑𝑧+ ∑18𝑐=1𝛾𝑐 +𝜀𝑖𝑡𝑧𝑐
(eq.4)
Finally, to test the relationship between capital structure and capital intensive
industries, an interaction variable was created, 𝑃𝑟𝑖𝑣𝑎𝑡𝑖𝑧𝑎𝑡𝑖𝑜𝑛 × 𝐼𝑛𝑑𝑢𝑠𝑡𝑟𝑦 ×
𝐹𝑖𝑥𝑒𝑑 𝐴𝑠𝑠𝑒𝑡𝑠, and it consists on the interaction between the dummy Privatization, the
different industries and the ratio of fixed assets to total assets. The equation is presented
below:
𝐿𝐸𝑉𝐸𝑅𝐴𝐺𝐸𝑖𝑡 = 𝛽0+ 𝛽1𝑃𝑟𝑖𝑣𝑎𝑡𝑖𝑧𝑎𝑡𝑖𝑜𝑛𝑖𝑡 +
𝛽2𝑃𝑟𝑖𝑣𝑎𝑡𝑖𝑧𝑎𝑡𝑖𝑜𝑛_𝐼𝑛𝑑𝑢𝑠𝑡𝑟𝑦_𝐹𝑖𝑥𝑒𝑑𝐴𝑠𝑠𝑒𝑡𝑠𝑖𝑡𝑧+ 𝛽3𝐶𝑜𝑛𝑡𝑟𝑜𝑙𝑠𝑖𝑡+ ∑10𝑡=1𝛿𝑡+ ∑12𝑧=1𝜑𝑧+
∑18𝑐=1𝛾𝑐+ 𝜀𝑖𝑡𝑧𝑐
(eq.5)
4.3 Descriptive Statistics
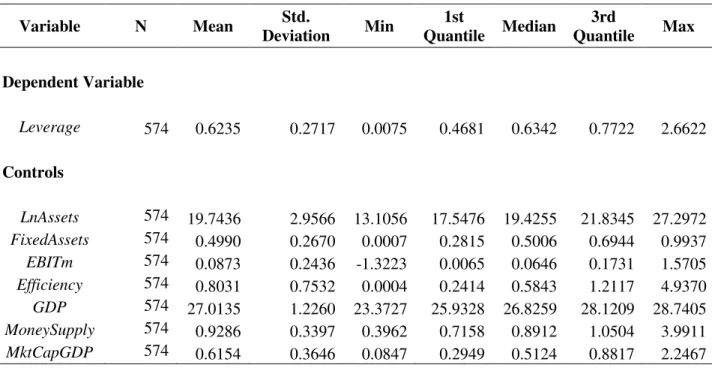
Panel A of Table 3 presents descriptive statistics for variables used in the equations
depicted above. In this sample, the mean (median) firm presents a leverage ratio of 62.4%
(63.4 %) and a standard deviation of 0.272. In addition to that, Panel A provides data for
sub-samples regarding privatization. In this sample, the average (median) firm that is privatized
19
through share issue has a mean (median) leverage ratio of 63.81% (68.92%). A fully
privatized firm shows an average (median) debt ratio of 61.28% (61.09%) and a firm that is
partially privatized presents a mean (median) leverage ratio of 63.4% (65.03%). Regarding
the proportion of fixed assets of the firms in the full sample, we find that the average firm,
out of the total assets, allocates 50% to fixed assets. Table 3 – Panel B presents the t-test for
the comparison of the debt levels before and after privatization. In this table, we can see that
the levels of debt before privatization are higher, suggesting that privatization has a negative
effect on leverage. Panel B also presents the debt ratio means before and after privatization,
for each of the countries included in this study. We can notice that, based on this sample, 10
countries registered, on average, a decrease in the leverage ratios following privatization and
the remaining countries, on average, increased their leverage levels, after privatization. If we
examine closely, we can infer that the most developed economies exhibit lower leverage
ratios after privatization, consistent with Harper (2002).
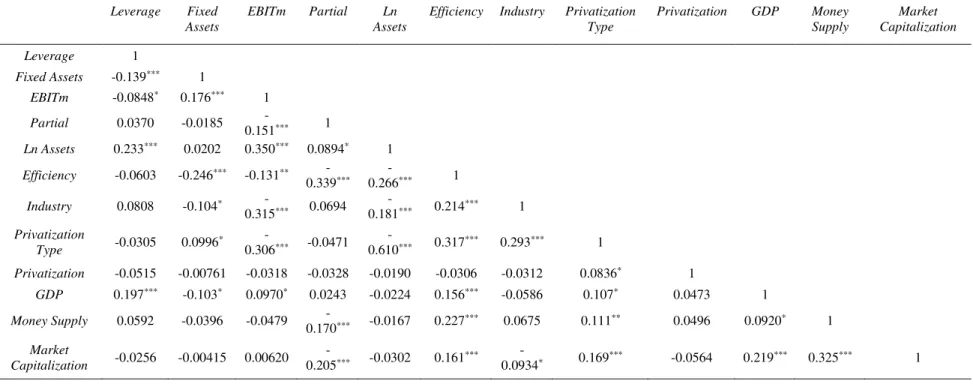
Table 4 presents the Pearson correlation matrix for the variables used in the empirical
models. Most of the variables are not significantly correlated with the dependent variable
except for FIXED ASSETS, EBITm, LN ASSETS and GDP. Comparing to the academic
literature, most of the measures have a consistent relationship but there is one variable whose
coefficient of correlation is the inverse of what would be expected. With this sample, the
correlation between LEVERAGE and FIXED ASSETS is negative (-0.139), meaning that a
firm that is more dependent on fixed assets is expected to have less leverage.
20
5.1 Leverage Ratio after Privatization
The first research hypothesis aims to test whether the capital structure of a firm
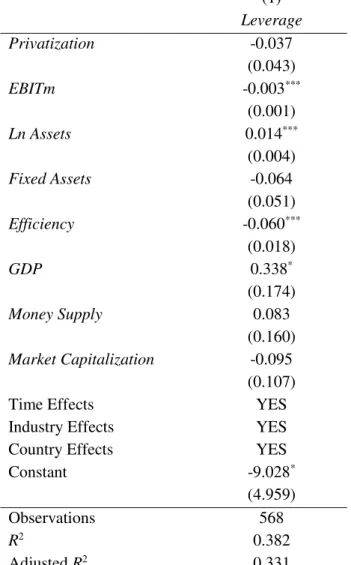
contain less debt following the process of privatization. The results observed in Table 5 are
as expected, given that the coefficient Privatization is negative, which is consistent with the
existent literature (e.g Boubakri and Cosset, 1998; Arcas and Bachiller, 2008). However, this
result is inconclusive, given that there is no statistical significance. This means that there is
no evidence to support the argument that the process of privatization can explain variations
in firms’ leverage ratios. When it comes to the control variables, we can observe that
EBITM’s coefficient is negative, suggesting that more profitable firms exhibit lower levels
of leverage, which is consistent with Hall et al. (2000) and Boubakri and Cosset (2013). For
LN ASSETS, there is evidence for a positive association between size and leverage. This was
expected according to Faulkender and Petersen (2006), given that bigger firms are more
diversified and face less risk, and therefore, the expected costs of bankruptcy and the
probability of distress are lower. In addition to that, larger firms may have a stronger position
to negotiate their financing needs (Degryse et al., 2012). The variable FIXED ASSETS
exhibits a negative although not significant coefficient, which is in contrast with existent
literature. Regarding efficiency, we observe a negative coefficient, as in Berger and
Bonaccorsi di Patti (2006). The authors claim that more efficient firms may use more equity
to protect future income derived from higher efficiency from the possibility of liquidation.
Moving on to the country-specific variables, in line with Hanousek and Shamshur (2011),
GDP presents a statistically positive coefficient. Having a higher GDP usually reflects a more
developed economy and, therefore, more business investment and more possibilities for a
21
though it is not statistically significant, we can observe a positive relationship with leverage.
This is consistent with Mokhova and Zinecker (2014). According to the authors, increasing
the supply of money is associated to lower interest rates and, consequently, to a lower cost
of debt. This factor provides firms with opportunities to access debt markets, and thus
increase leverage ratios. The coefficient for MARKET CAPITALIZATION is negative but it
is not statistically significant, which is consistent with Bokpin (2009). This variable is a proxy
for equity markets’ development and, as the equity market gets more developed, the easier a
firm will access such markets and, therefore, one can suggest that the public access to debt
markets would be reduced, leading to lower debt ratios.
5.2 Leverage Ratio and the Type of Privatization
In the second research hypothesis we examine the effect on leverage for privatizations
through asset sale, as opposed to a firm privatized through share issue. The findings present
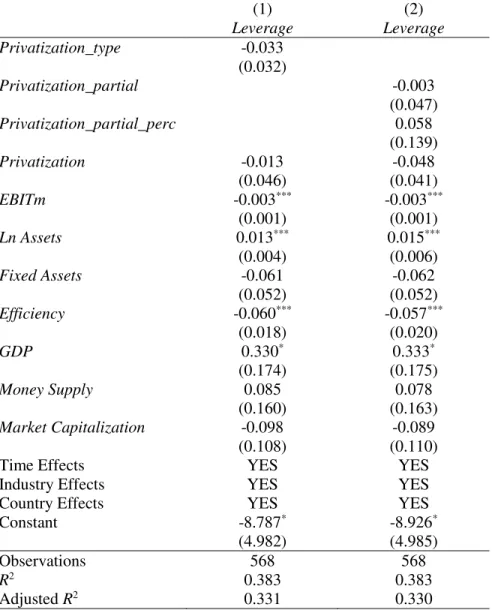
in Table 6 are inconclusive for Privatization_type. Even though this is not the predicted
result, this result brings no conclusion as to whether the type of privatization is relevant to
explain debt ratio variations.
5.3 Leverage and Ownership Structure
The third research hypothesis assesses whether a partially privatized firm exhibit
higher leverage ratios than those that are fully privatized. The findings in Table 6 show that
the results are inconclusive, as both variables that were added for this hypothesis are not
statistically significant. The output shows a negative sign on the coefficient for the variable
22
Privatization_partial_perc. The signs are consistent with the hypothesis but again, we can’t
conclude as to whether the ownership structure, after privatization, can impact firms’
leverage ratios.
5.4 Leverage and Industry Influence
The fourth research hypothesis tests the influence of the industry in which a firm is
inserted on its capital structure, through a series of regressions containing an interaction term
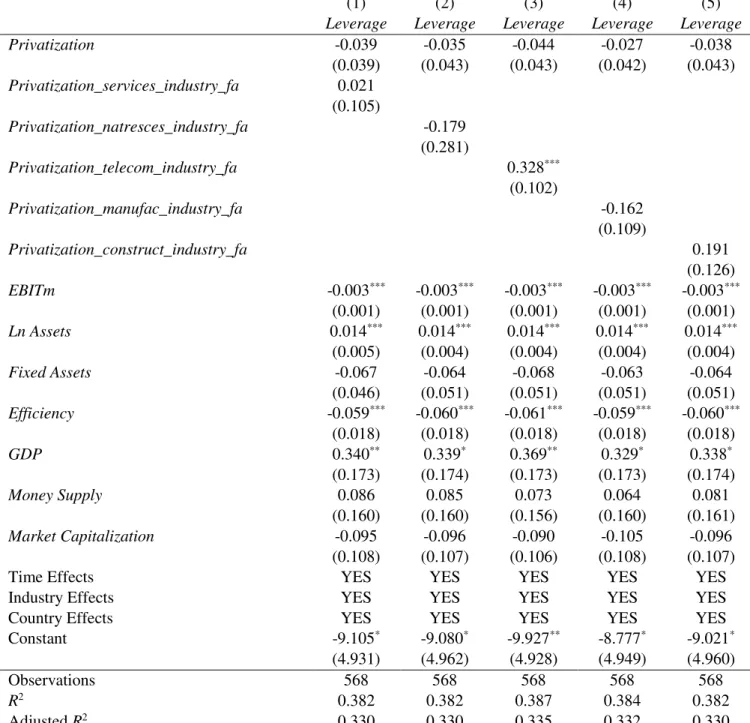
between Privatization and each of the industries present in the sample. The output is
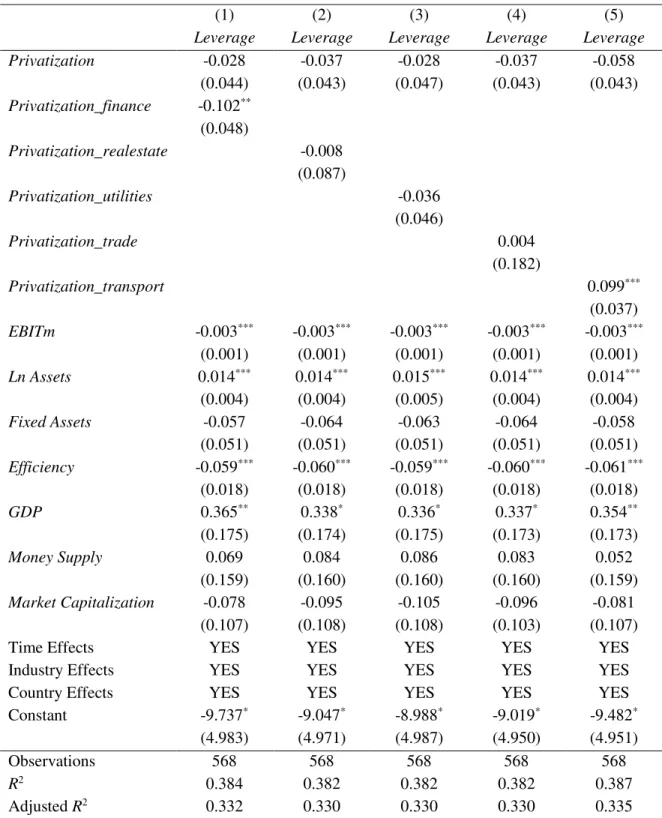
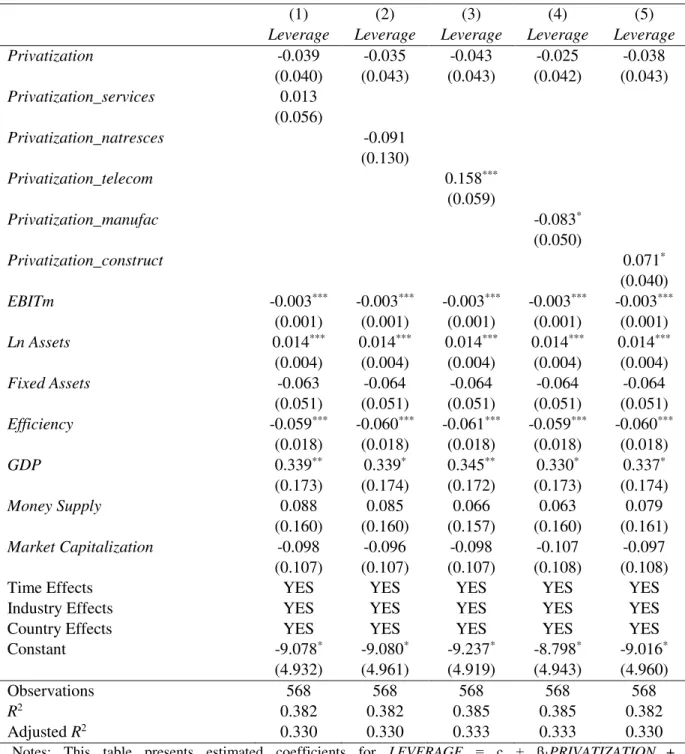
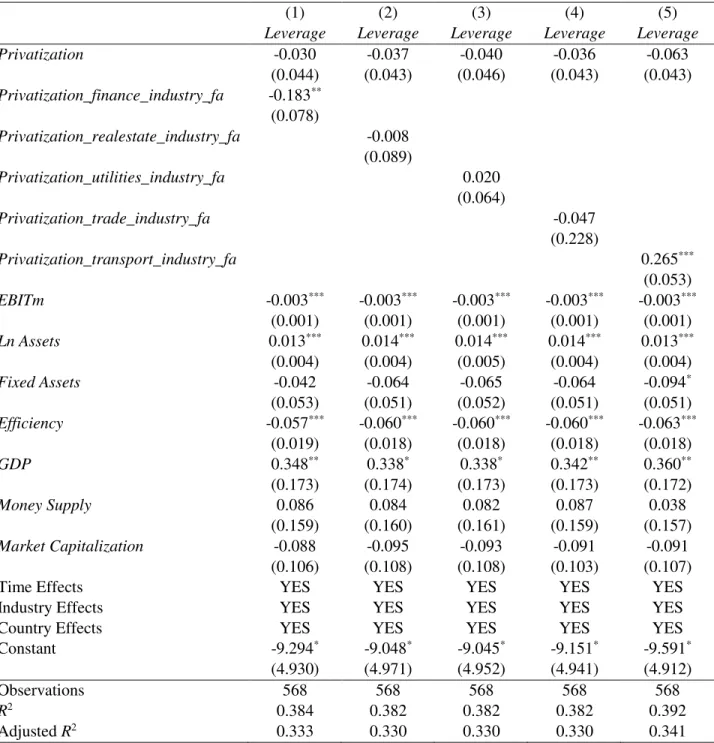
presented in Table 7 and the results show positive coefficients for half of the industries in the
sample (Trade, Transport, Services, Telecommunications and Construction) and negative
coefficients for the other half (Finance, Real Estate, Utilities, Natural Resources,
Manufacturing) . The outcomes suggest that the Telecommunications industry is the most
affected after privatization, with an expected increase on the leverage ratio of 15.8%, after
privatization. This result is not consistent with Berman and Pfleeger (1997), as they found
evidence for the Telecommunications industry to be among the least correlated with business
cycles. Looking at the negative coefficients, we can observe that the industry whose effect
of privatization is stronger is the Finance industry, with an expected reduction on the debt
ratio of 10.2%, after privatization. When it comes to the industries referred in the hypothesis,
there was evidence for the Construction industry to have a positive relationship with leverage,
with an expected increase of 7%. We found no statistical evidence for the Trade industry to
23
5.5 Leverage and Capital Intensive Industries
The final hypothesis in Table 8 assesses whether industries that are more intensive in
fixed assets exhibit a different variation in the level of leverage following privatizations.
Given that capital intensive firms are characterized for higher depreciation and more fixed
assets, in this study the industries that are marked as capital intensive are: Real Estate;
Utilities; Telecommunications and Transportation. To define capital intensive industries was
to divide the fixed assets totals per industry by the number of firms present in each industry,
in order to find the average proportion of fixed assets per firm in each industry. The industries
selected have on average, at least two billion euros in fixed assets per firm. The results show
that half of the industries have positive coefficients on the interaction variable between each
industry, FIXED ASSETS and Privatization. Out of the four industries that are identified as
capital intensive, only Real Estate has a negative coefficient. Nevertheless, we observe that
the interaction terms with the Transportation and Telecommunications industries are
statistically significant. These results are the expected results and they suggest that firms
more dependent on fixed assets have more leverage, after privatization. Rampini and
Viswanathan (2013) add that firms with low leverage are essentially firms with few tangible
assets, due to the strong and positive relationship between leased capital and asset tangibility.
5.6 Case Study - Poland
Given that with the main sample only the main research hypothesis was validated, we
opted for an additional analysis specific for massive programs of privatization. Therefore, we
focus on the Polish case to understand and how the firms’ debt ratios are affected by a large
24
launched in 2008 a plan whose main objective was to reduce the ownership role of the
government in all industries. (Patena and Błaszczyk, 2016).
In this privatization program, 802 state-owned firms were included in the plan and,
until 2011, 458 were fully privatized. Firms from industries in several sectors, ranging from
Utilities, Transportation, Pharmaceuticals, etc. were covered by this program.
The sample for the analysis comprises 634 firms from 12 industries. Figure 2
describes the evolution of the sample firms’ leverage ratios over time. It shows that before
privatization, the mean debt ratios never surpassed 50% and after privatization, the average
debt levels increase, suggesting that debt ratios tend to increase over time, contrary to what
was concluded in Section 3.
Table 9 shows the output for the main hypothesis and for the hypotheses concerning
the privatization type and the ownership structure. The results show a positive and
statistically significant coefficient on the variable Privatization, for Polish privatizations.
This suggests that, after privatization, a firm will have an expected increase on the debt levels
of 12.5%. Patena and Błaszczyk (2016) claim that managers of Polish state-owned
enterprises were very conservative regarding the use of debt. Analyzing the effect on leverage
from privatizations through asset sale versus equity market, we found evidence for higher
debt ratios for firms privatized through asset sale, in 26.9%, when compared to a firm
privatized through share issue. This result is consistent with Megginson et al (2004). The
authors found evidence that firms are more likely to be privatized through SIPs when
profitability is higher. Regarding ownership structure, evidence is inconclusive as to whether
the type of ownership has an influence on debt ratios, as both coefficients are not statistically
25
found evidence that after privatization, industries more dependent on fixed assets tend to
have more leverage, when compared to firms that are less capital-intensive.
From this analysis, we can document that the Polish large-scale privatization program
launched by the government can explain the changes on leverage ratios by the firms, which
gives us reason to suggest that political approaches to privatization may be important to
explain firms’ capital structure decisions, as we could not reach any conclusions regarding
the main sample in the study. Moreover, risk aversion characteristics of managers before
privatizations may well be a driver for changes in leverage from privatizations, as suggested
by Patena and Błaszczyk (2016).
5.7 Robustness Check
To assess the robustness of our findings, the sample was encompassed into an equally
distant period of time, before and after privatization, to see if the model is well-structured
and can be used for a shorter period of time. This was tested on the main model and the time
span selected was 3 years before and after privatization. The output is presented in Table 10
and, when compared to the results presented in Table 5, we can see that the initial conclusions
are not altered. Table 10 also presents the results for the Polish sample and, comparing to
table 9, we notice that the coefficients are robust and the conclusions are the same, suggesting
that the model is well structured.
26
The aim of this study is to analyze the impact of the process of privatization on capital
structure decisions, while also analyzing the different industry characteristics and how capital
structure varies from industry to industry. To do so, we tested five hypotheses on a sample
with 574 observations from 10 industries and 18 European countries, for a period between
2006 and 2015. In order to catch the effects of privatization on capital structure over time, a
differences-in-differences model was applied.
The findings in this study suggest that overall, there is no evidence for the effect of
privatization to be significant on leverage ratios, unless there is a planned privatization
program for several firms, as shown in the case of Poland. The result is not consistent with
the hypothesis, as the literature suggests that there is a decrease of the leverage ratio.
Furthermore, we did find evidence for an increase of leverage for Polish firms, after
privatization. Additionally, no evidence was found to say that ownership structure is relevant
to explain capital structure decisions after the process of privatization.
Regarding the influence of industry characteristics on capital structure, the results
suggest that, following privatization, firms inserted in capital intensive industries tend to have
more leverage against firms less dependent on fixed assets, after privatization. This outcome
supports the literature (Talberg et al., 2008; Rampini and Viswanathan, 2013), based on the
fact that firms more dependent on fixed assets have more leverage overall.
This paper makes a contribution to the literature, in the sense that our findings suggest
that the political context in which a country is inserted regarding privatizations may be
important to explain capital structure decisions on firms. Despite the contribution, further
research can be made. One suggestion is to include the concept of market leverage and verify
27
that Patena and Błaszczyk (2016) suggested that managers’ characteristics could explain
leverage variations, after privatization, a behavioral variable such as the managers’ influence
on capital structure decisions could be interesting to include. The economic cycles were
briefly approached in this paper. It could be interesting to study the effects of privatization
on capital structure before and after the financial crisis.
28
7
References
Antonczyk, R. C., & Salzmann, A. J. (2014). Overconfidence and optimism: The effect of national culture on capital structure. Research in International Business and Finance,
31(May), 132–151.
Arcas, M. J., & Bachiller, P. (2008). Performance and Capital Structure of Privatized Firms in Europe. Global Economic Review, 37(1), 107–123.
Arsov, S., & Naumoski, A. (2016). Determinants of Capital Structure: an Empirical Study of Companies from Selected Post-Transition Economies. Zbornik Radova
Ekonomskog Fakulteta U Rijeci: Časopis Za Ekonomsku Teoriju I Praksu /
Proceedings of Rijeka Faculty of Economics: Journal of Economics and Business,
34(1), 119–146.
Barbosa, C., Costa, C. M., & Funchal, B. (2012). The effects of privatization on the capital structure of Brazilian firms. Applied Economics Letters, 19(12), 1189–1192.
Berger, A. N., & Bonaccorsi di Patti, E. (2006). Capital structure and firm performance: A new approach to testing agency theory and an application to the banking industry.
Journal of Banking and Finance, 30(4), 1065–1102.
Berger, P. G., Ofek, E., & Yermack, D. (1997). Managerial Entrenchment and Capital Structure. The Journal of Finance, 52(4), 1411–1438.
Berman, J., & Pfleeger, J. (1997). Which industries are sensitive to business cycles?
Monthly Labor Review / U.S. Department of Labor, Bureau of Labor Statistics,
120(2), 19–25.
Boubakri, N., & Cosset, J.-C. (1998). The financial and operating performance of newly privatized firms: Evidence from developing countries. Journal of Finance, 53(3), 1081–1110.
Boycko, M., Shleifer, A., & Vishny, R. W. (1996). A Theory of Privatisation. The Economic Journal, 106(March), 309-319
Bradley, M., Jarrell, G. A., & Kim, E. H. (1983). On the Existence of an Optimal Capital Structure: Theory and Evidence. The Journal of Finance, 39(3), 857–878.
29
Chahyadi, C. S. (2008). What do we know about capital structure of privatized firms? A study of evolution and determinants of capital structure of privatized firms. PhD diss., University of Oklahoma.
de Jong, A., Verbeek, M., & Verwijmeren, P. (2011). Firms’ debt-equity decisions when the static tradeoff theory and the pecking order theory disagree. Journal of Banking and Finance, 35(5), 1303–1314.
Degryse, H., de Goeij, P., & Kappert, P. (2012). The impact of firm and industry characteristics on small firms’ capital structure. Small Business Economics, 38(4), 431–447.
D’Souza, J., & Megginson, W. L. (1999). The Financial and Operating Performance of Privatized Firms during the 1990s. Journal of Finance, 54(4), 1397–1438.
D’Souza, J., Megginson, W.L. & Nash, R. (2005). Effect of Institutional and Firm-Specific Characteristics on Post- Privatization Performance: Evidence from Developed
Countries. Journal of Corporate Finance, 11 (5), 747–766.
Eaton, J. (1989). Bureaucratic, capitalist and populist privatization strategies. International Review of Administrative Sciences, 55, 467–492.
Errunza, V. R., & Mazumdar, S. C. (2001). Privatization : a theoretical framework. Journal of International Financial Markets, Institutions and Money, 11, 339–362.
Faulkender, M., & Petersen, M. A. (2006). Does the source of capital affect capital structure? Review of Financial Studies, 19(1 SPEC. ISS.), 45–79.
Fauver, L., & McDonald, M. B. (2015). Culture, agency costs, and governance:
International evidence on capital structure. Pacific-Basin Finance Journal, 34, 1–23.
Ferreira, J. V. (2012). The performance of newly privatized firms: The case of Portugal. Journal of Governance and Regulation, 1(2), 92-125.
Fosu, S. (2013). Capital structure, product market competition and firm performance- Evidence from South Africa. The Quarterly Review of Economics and Finance,
53(13), 140–151.
Frydman, R., Gray, C., Hessel, M., & Rapaczynski, A. (1999). When Does Privatization Work? The Impact of Private Ownership on Corporate Performance in the Transition Economies. The Quarterly Journal of Economics, 114(4), 1153–1191.
30
Graham, J., & Harvey, C. (2002). How Do CFOs Make Capital Budgeting and Capital Structure Decisions? Journal of Applied Corporate Finance, 15(1), 8–23.
Gupta, N. (2005). Partial Privatization and Firm Performance Partial Privatization and Firm Performance, The Journal of Finance, 60(2), 987–1015.
Hall, G., Hutchinson, P., & Michaelas, N. (2000). Industry Effects on the Determinants of Unquoted SMEs’ Capital Structure. International Journal of the Economics of Business, 7(3), 297–312.
Hanousek, J. & Shamshur, A. (2011). A stubborn persistence: Is the stability of leverage ratios determined by the stability of the economy? Journal of corporate finance, 17, 1360–1376.
Harper, J. T. (2002). The performance of privatized firms in the Czech Republic. Journal of Banking and Finance, 26(4), 621–649.
Harris, M., & Raviv, A. (2007). The Theory of Capital Structure. The Journal of Finance,
46(1), 297–355.
Jordà, O., Schularick, M., & Taylor, A. M. (2012). When credit bites back. Journal of Money, Credit and Banking, 45(2), 3–28.
Lemmon, M. L., Roberts, M. R., & Zender, J. F. (2008). Back to the Beginning : Persistence and the Cross-Section of Corporate Capital Structure. The Journal of Finance, 63(4), 1575–1608.
Long, M. S., & Malitz, I. B. (1985). Investment Patterns and Financial Leverage.
Corporate Capital Structures in the United States, I, 325–352.
López-Calva, L. F., & Sheshinski, E. (2003). Privatization and Its Benefits: Theory and Evidence. CESifo Economic Studies, 49(3), 429–459.
MacKay, P., & Phillips, G. M. (2005). How Does Industry Affect Firm Financial Structure?
Review of Financial Studies, 18(4), 1433–1466.
Majluf, N. S., & Myers, S. C. (1984). Corporate Financing and Investment Decisions When Firms Have Information The Investors Do Not Have. Journal of Financial Economics, 13, 187–221.
Megginson, W. L., Nash, R. C., Netter, J. M., & Poulsen, A. (2004). The Choice of Private versus Public Capital Markets : Evidence from Privatizations. The Journal of Finance,
59(6), 2835–2870.
31
Modigliani, F., & Miller, M. H. (1958). The Cost of Capital, Corporation Finance and the Theory of Investment. The American Economic Review, 48(3), 261–297.
Myers, S. C. (1984). The Capital Structure Puzzle. The Journal of Finance, 39(3), 575–592.
Myers, S. C., & Shyam-Sunder, L. (1999). Testing static tradeoff against pecking order models of capital structure. Journal of Financial Economics, 51, 219–244.
Opler, T., & Titman, S. (1994). Financial Distress and Corporate Performance. The Journal of Finance, 49(3), 1015-1040.
Patena, W., & Błaszczyk, B. (2016). Post-privatization corporate performance: evidence from companies privatized in Poland in 2008–2011. Studia Ekonomiczne, (2), 199– 221.
Rajan, R. G., & Zingales, L. (1995). What Do We Know about Capital Structure ? Some Evidence from International Data. The Journal of Finance, 50(5), 1421–1460.
Rampini, A. A., & Viswanathan, S. (2013). Collateral and capital structure. Journal of Financial Economics, 109(2), 466–492.
Sarmento, J. M., & Renneboog, L. (2016). Anatomy of public-private partnerships: their creation, financing and renegotiations. International Journal of Managing Projects in Business, 9(1), 94–122.
Savas, E. S. (2000). Privatization and Public-Private Partnerships (2nd ed.). CQ Press.
Talberg, M., Winge, C., Frydenberg, S., & Westgaard, S. (2008). Capital Structure across Industries. International Journal of the Economics of Business, 15(2), 181–200.
Titman S. & Wessels R. (1988). The Determinants of Capital Structure Choice. The Journal of Finance, 43(1), 1–19.
32
8
Appendix
Figure 1 - Debt ratio evolution on the sample firms, over time
Figure 2 - Debt ratio evolution on the Polish sample firms, over time
0 0.1 0.2 0.3 0.4 0.5 0.6 0.7 0.8
- 8 - 6 - 4 - 2 0 2 4 6 8
LE V ER A G E R A T IO T 0 0.1 0.2 0.3 0.4 0.5 0.6 0.7 0.8
- 8 - 6 - 4 - 2 0 2 4 6 8
33
Table 1 – Countries and Industries present in the sample
Country Observations Percentage Industry Observations Percentage
Germany 37 6.45 Finance 46 8.01
Italy 91 15.85 Real Estate 7 1.22
Portugal 62 10.80 Utilities 133 23.17
Sweden 70 12.20 Trade 15 2.61
United Kingdom 43 7.49 Transportation 111 19.34
Belgium 27 4.70 Services 124 21.60
France 39 6.79 Natural Resources 7 1.22
Slovenia 10 1.74 Telecommunications 27 4.70
Spain 46 8.01 Manufacturing 94 16.38
Netherlands 25 4.36 Construction 10 1.74
Luxembourg 7 1.22 Total 574 100.00
Ireland 10 1.74
Greece 46 8.01
Finland 19 3.31
Czech Republic 18 3.14
Estonia 8 1.39
Lithuania 6 1.05
Hungary 10 1.74
Total 574 100.00
34
Table 2 - Variable Definition
Variable Definition
LEVERAGE
Ratio of total debt over total assets.
EBITM
Ratio of EBIT to sales. Proxy for profitability.
LN ASSETS
Size of the firm, measured by the logarithm of total assets.
FIXED ASSETS
Ratio of fixed assets to total assets.
EFFICIENCY
Ratio of sales to assets. Proxy for efficiency.
GDP
Logarithm of GDP.
MONEY SUPPLY Ratio of a country’s
money supply to the GDP.
MARKET
CAPITALIZATION Total value of all listed
shares in a stock market as a percentage of GDP.
Privatization Dummy variable equal to 1
from the year when a firm is privatized until the end of the sample (2013) and 0, otherwise.
Privatization_type
Interaction between
Privatization and
35
sale and 0 if it is privatized through share issue.
Privatization_partial Interaction between
Privatization and the dummy partial, which is equal to 1 if the privatization is partial and is equal to 0 if the firm is fully privatized.
Privatization_partial_perc Interaction between
Privatization, partial and partial_percentage, which is a variable that describes the percentage of privatization for each firm.
Privatization_industry Interaction between
Privatization and each industry present in the sample.
Privatization_industry_fa
Interaction between the dummy Privatization, the different industries and
FIXED ASSETS.
i
Firm.
z
Industry in which the firm is inserted.
c
Country in which the firm is based.
t
Year of data.
36
Table 3 – Descriptive Statistics
Panel A: Regression Variables
Variable N Mean Std.
Deviation Min
1st
Quantile Median
3rd
Quantile Max
Dependent Variable
Leverage 574 0.6235 0.2717 0.0075 0.4681 0.6342 0.7722 2.6622
Controls
LnAssets 574 19.7436 2.9566 13.1056 17.5476 19.4255 21.8345 27.2972
FixedAssets 574 0.4990 0.2670 0.0007 0.2815 0.5006 0.6944 0.9937
EBITm 574 0.0873 0.2436 -1.3223 0.0065 0.0646 0.1731 1.5705
Efficiency 574 0.8031 0.7532 0.0004 0.2414 0.5843 1.2117 4.9370
GDP 574 27.0135 1.2260 23.3727 25.9328 26.8259 28.1209 28.7405
MoneySupply 574 0.9286 0.3397 0.3962 0.7158 0.8912 1.0504 3.9911
MktCapGDP 574 0.6154 0.3646 0.0847 0.2949 0.5124 0.8817 2.2467
Notes: This table presents the descriptive statistics for the variables that were applied in this study.
Special Cases
Variable N Mean Std.
Deviation Min
1st
Quantile Median
3rd
Quantile Max
Dependent Variable
Leverage, if
type = SIP 174 0.6381 0.194 0.0541 0.5296 0.6892 0.7553 0.9635 Leverage, if
type = Asset Sale
400 0.6184 0.2993 0.0075 0.4213 0.6051 0.8029 2.6622 Leverage, if
Full 261 0.6128 0.2152 0.1179 0.4715 0.6109 0.7603 1.6922 Leverage, if
37
Panel B: Debt Ratios before and after Privatization
T-test for the mean differences
Before After Diff.
T-Statistic 0.6400 0.6093 0.0307 (1.36)
Debt Ratios before and after Privatization, by country
Country Before After
N Mean N Mean
Germany 17 0.7119 20 0.6376
Italy 46 0.6965 45 0.6707
Portugal 35 0.6783 27 0.7309
Sweden 36 0.6117 34 0.5109
United Kingdom 20 0.6139 23 0.611
Belgium 18 0.5903 9 0.6296
France 15 0.8215 26 0.7241
Slovenia 4 0.4843 6 0.6157
Spain 27 0.5389 19 0.5817
Netherlands 7 0.7718 18 0.6848
Luxembourg 3 0.4057 4 0.2618
Ireland 5 1.0079 5 1.0203
Greece 21 0.7987 24 0.5844
Finland 8 0.6138 11 0.6154
Czech Republic 7 0.2318 11 0.1271
Estonia 2 0.1304 6 0.3581
Lithuania 4 0.1142 2 0.2106
Hungary 7 0.455 3 0.4098
