UNIVERSIDADE DA BEIRA INTERIOR
Ciências Sociais e Humanas
Wind power energy and electricity exports:
Empirical evidence from Portugal
Agostinho Filipe da Rocha Pereira
Dissertação para obtenção do Grau de Mestre em
Economia
(2º ciclo de estudos)
Orientador: Prof. Doutor António Manuel Cardoso Marques
Co-orientador: Prof. Doutor José Alberto Serra Ferreira Rodrigues Fuinhas
iii
Acknowledgements
I would like to thank my supervisor Professor António Cardoso Marques for accept guide and work with me since the first moment. Her orientation and inspiration was very important in the final result of this master thesis. Invaluable help and constant encouragement to do a competent job. Thanks for her trust. My deepest gratitude goes to Professor José Alberto Rodrigues Ferreira for his valuable assistance and advice made throughout this thesis, in order to improve this work. I would like to express my greatest gratitude to my family for all their understanding, affection and immeasurable support through the duration of my studies. Finally, a big thank you to all my friends who helped and supported me from the beginning, without them I would not have come this far.
v
Resumo
A integração crescente de eletricidade gerada a partir de fontes renováveis nos sistemas electroprodutores nacionais estão a causar novos desafios à gestão desses sistemas. Em particular, nas horas de vazio, a gestão do sistema tem de garantir um destino adequado a eventuais excessos de eletricidade criados. Uma das soluções para lidar com este problema é exportar. Portugal tem pertencido ao grupo líder dos países onde as fontes renováveis mais cresceram. Estuda-se pois, para este país, a relação entre eletricidade gerada a partir da fonte eólica exportações de eletricidade, para o período de Julho de 2007 a 2012, com frequência diária. Dada a forte endogeneidade presente entre as fontes eólica, exportações, e eletricidade gerada no regime ordinário, a metodologia Vector Autoregressive (VAR) é usada. Esta opção permite ainda avaliar a natureza das relações sem a necessidade prévia de distinguir as variáveis endógenas das exógenas. Os resultados mostram que existe causalidade entre as variáveis, ou seja, estas interagem umas com as outras. Para além disso, existe uma relação bidirecional de causalidade entre o consumo e a produção de energia eólica e entre a proxy de eletricidade de exportação e consumo. Este estudo mostra que existe endogeneidade entre as variáveis e uma correlação positiva entre as exportações de eletricidade e a produção de energia eólica em Portugal. Os resultados auxiliam os decisores políticos a tomarem posições equilibradas no âmbito do sistema electroprodutor.
Palavras-chave
Energia renováveis; Exportação de eletricidade; Gestão da energia eólica; Flutuação de preços; Sistema eletroprodutor
Resumo Alargado
Com o aumento da integração crescente de eletricidade gerada a partir de fontes renováveis nos sistemas electroprodutores nacionais estão a causar novos desafios à gestão desses sistemas. Em particular, nas horas de vazio, a gestão do sistema tem de garantir um destino adequado a eventuais excessos de eletricidade criados. Uma das soluções para lidar com este problema é exportar. Portugal tem pertencido ao grupo líder dos países onde as fontes renováveis mais cresceram. Estuda-se pois, para este país, a relação entre eletricidade gerada a partir da fonte eólica exportações de eletricidade, para o período de Julho de 2007 a 2012, com frequência diária.
vi
Dada a forte endogeneidade presente entre as fontes eólica, exportações, e eletricidade gerada no regime ordinário, a metodologia Vector Autoregressive (VAR) é usada. Esta opção permite ainda avaliar a natureza das relações sem a necessidade prévia de distinguir as variáveis endógenas das exógenas.Portugal é um dos países que tem um sistema elétrico liberalizado que se encontra baseado em dois regimes: por um lado o ordinário, que assenta na produção com base em fontes tradicionais não renováveis, sobretudo o carvão, gás natural e em grandes centros electroprodutores hídricos; por sua vez o regime especial, com base na produção com recursos de energias renováveis ou de cogeração. Este como outros países da união europeia, deve cumprir as metas do Protocolo de Quioto, procurando aumentar a quota de energias renováveis para 20% em 2020. Assim, as políticas energéticas implementadas, sustentabilidade ambiental, segurança do fornecimento de energia e desenvolvimento económico, estão a impulsionar o aumento da utilização de energias renováveis que dependem de fatores naturais para produzirem. Tal como as políticas de energia, também as tarifas feed-in que o estado proporciona aos investidores, serviram de estímulo. Este incentivo é pago pelos consumidores e empresas. Assim, Portugal situa-se nos vintes países com mais capacidade instalada do mundo. A energia eólica não contribui de forma maioritária para geração total de eletricidade, mas este cenário pode mudar. Nos últimos anos a energia eólica tem aumentando a satisfação da procura de eletricidade. Apesar de se ter verificado um alargamento no que concerne ao uso das fontes renováveis, a energia eólica continua a ser a mais usada mas está a causar problemas devido à sua integração no sistema electroprodutor. Este prefere fontes de geração não renovável, pois assim a produção é contínua e mais facilmente consegue equilibrar o sistema entre a procura e a oferta.
Em muitos países, os sistemas electroprodutores não estão a conseguir acompanhar o aumento da capacidade instalada de energia renovável. Para além deste problema, surgem outras dificuldades. A energia eólica é uma fonte que produz consoante a variabilidade do vento, tornando-se uma fonte de geração menos previsível em relação às fontes convencionais, dificultando assim o equilíbrio no sistema energético. Para além disto, o sistema não consegue armazenar eletricidade quando as fontes renováveis produzem nas horas de vazio. Outro problema é a flutuação do preço de eletricidade, este que tem diminuído nos últimos anos devido a uma maior eficiência das turbinas. Com isto surge a necessidade de tentar dissipar a energia produzida excedentária. A Dinamarca é referida pela literatura como o país mais eficiente a gerir o excedente de energia renovável, devido às boas interconexões que tem com os países vizinhos.
Para chegar aos resultados esperados utilizou-se as seguintes variáveis: produção de energia eólica, total de produção em regime ordinário, consumo de eletricidade, preço spot de eletricidade e proxy de exportações de eletricidade. Os resultados mostram que existe endogeneidade entre as variáveis estudadas. Para além disso, existe uma relação bidirecional de
vii
causalidade entre o consumo e a produção de energia eólica e entre a proxy de eletricidade de exportação e o consumo. Através dos resultados verificamos que as energias de regime ordinário estão a perder importância para o regime especial. O aumento de energias não poluentes faz decrescer a dependência energética para os países que tem falta de recursos fosseis. Conclui-se também que a energia eólica tem uma correlação positiva com a exportação que assim faz diminuir as perdas de eletricidade. Estes resultados obtidos auxiliam os decisores políticos a tomarem posições equilibradas no âmbito do sistema electroprodutor.ix
Abstract
The increasing integration of electricity generated from renewable sources in the national electricity generating systems are posing new challenges to these systems management. In particular, in off-peak hours, the system management must ensure a suitable destination to any exceeding electricity created. One solution to deal with this problem is to export. Portugal has belonged to the leading group of countries where renewable sources grew most. Therefore its being studied for this country, the relationship between wind power electricity and the electricity exports for the period July 2007 to 2012, on a daily basis. Given the strong endogeneity between wind sources, exports, and the electricity generated in the ordinary regime, the methodology Vector Autoregressive (VAR) is used. This option also allows to evaluate the nature of the relationships without the prior need to distinguish endogenous from exogenous variables. The results show that causalities exist between the variables, that is, they interact with each other. In addition, there is a bidirectional causal relationship between consumption and production of wind energy and between the proxy electricity export and consumption. This study shows that there is endogeneity between variables and a positive correlation between exports electricity and wind energy production in Portugal. These results will help policy makers to take balanced positions within the power system.
Keywords
Renewable energy; Electricity exportation; Management of wind power; Price fluctuations; Power generation system
xi
Índice
1. Introduction
1
2. Renewables Intermittency, energy mix and electricity exports
3
3. Portuguese electrical system
4
4. Data and Methodology
7
5. Discussion
15
6. Conclusion
17
xiii
Figures list
Figure 1 – The influence of wind power on demand Figure 2 – The demand on total net production Figure 3 - Impulse Response Functions
xv
Tables list
Table 1 – Variable definitions, sources and summary statistics Table 2 – Descriptive statistics
Table 3 – Granger causality/ Block exogeneity Table 4 – VAR diagnostic tests
xvii
Acronyms list
CONS Electrical consumption
DPR First differences
EO Wind energy production
EPE Electricity proxy exports
EU European Union
ES Electrical system
GWH Gigawatts–hour
ORTP Ordinary regime total production
PR Electricity spot price
VAR Vector Autoregressive
1
1. Introduction
The European energy policy has three main goals: environmental sustainability, security of energy supply and economic development (European Community, 2007).Climate change has forced the political commitment to meet 20% of EU energy consumption from renewable sources by 2020 (EU Directive, 2009). The renewable energy sources solar, wind and photovoltaic, have been one of the most required solutions by European Union countries in order to meet European aims for reducing energy dependence and also to comply with the Kyoto Protocol.
The electricity generated form the wind source energy, hereafter wind power, depends on the strength and especially on the flow of the wind, and is to become a truly global resource generation and of continued growth (Bove et al., 2012). Before, ancient power generation systems had an easy prediction of electricity production, as most of the production was generated from fossil fuels (Bove et al., 2012). Nowadays, with the emergence of renewable sources, specifically wind power, problems arise in electrical systems (ES) due to the intermittent production, the feasibility and reliability (Dale et al., 2004; Østergaard 2009; Boccard 2009; Albadi and El-Saadany 2010). Wind turbines are seen as passive electricity producers which are producing when the wind blows, regardless of the electricity demand in the system (Sorknæs et al., 2013).
The penetration of these intermittent energy sources brings up another challenging for the other players, namely those using conventional sources, of the ES . The power generation systems of countries that are investing in renewable energy may failing to keep up with the installed capacity of wind energy, thus leading to energy loss (Zhao et al., 2009; Yang et al., 2012). Moreover, they still have the problem of electricity which is not a storable commodity (Franco and Salza 2011). Thus, it becomes important to the electric sector companies to better manage energy in order to maintain a more balanced electrical system concerning supply and demand, although these do not always coincide. Since the wind energy does not produce according to demand, one problem that arises has to do with the production of off-peak hours (Azcárate et al., 2012).The electricity demand impulses prices (Azcárate et al., 2012).With the variability of wind power, prices tend to fluctuate more depending on the wind strength (Jacobsen and Zvingilaite 2010). However, the technological development of wind turbines has decreased the price of electricity in recent years (EIA, 2009).
The Portuguese power generation system in Portugal of electricity is based in two regimens since July of 2007: ordinary and special. The first one is based on the production of traditional resources of non-renewable energy especially coal and natural gas in big hydric production centers; the second is based on the production of renewable resources or cogeneration. The central question of this study focuses on evaluating how the generation sources interact in these two regimes,
2
namely wind power in the special, as well as their relationship with a system management variable, the exports. In particular, we intend to realize if the wind power production influences or not electricity exports. However, it is also important to analyze other issues. Does the increase in wind power capacity positively influence exports of electricity? There are several authors who have focused in this study and come to the conclusion that the increase in wind power has a positive correlation with exports (Mignard et al., 2007; Lund et al., 2013). The most studied case is the one of Denmark, as this is known as the most efficient country in the world managing produced energy and where it has a well-considered renewable share. Will there be in Portugal such a positive correlation as in Denmark? It is in this question that this study will focus, since we are one of the twenty countries with the highest wind power capacity in Europe (EWEA, 2013). The use of Vector Autoregressive Model (VAR) was proved adequate in relation to the degree of endogeneity of variables. The results support that exports are influenced by wind power. On the other hand the study also highlights that the wind energy is increasing its share in power generation system.The paper is organized in the following way: section 2 focuses on the literature and on the issues of the intermittent generation with increased of installed capacity, management of wind power and future electric system with the introduction of wind power. Section 3 characterizes data and methodology. Section 4 presents the results and discussion is provided in section 5. Finally, section 6 shows the conclusions.
3
2. Renewables Intermittency, energy mix and electricity exports
The renewables cannot generate 100% of its maximum capacity, due to its intermittency. The approach for intermittent renewable energy can be accomplished through the analysis of its capacity. According to the Boccard (2009), the capacity factor depends on: (i) the variability of wind, and (ii) strong incentives that led to a quick and efficient implementation of wind energy. Albadi and El-Saadany (2010), states that the growth of wind power capacity is influenced by: (i) growing concern on climate problems; (ii) awareness of the depletion of oil and gas reserves; and (iii) improved turbine technology that reduces costs. The installed capacity of wind power is constantly increasing, thus putting challenges in the ES (Boccard 2009; Jacobsen and Zvingilaite 2010; Purvins et al., 2011).
The China power generation system will fail to handle this growth of wind energy installed capacity (Zhao et al., 2009;Wang 2010). These have difficulty absorbing all the wind penetrated Increased penetration of wind increases the challenge if the power generation system is not flexible (Albadi and El-Saadany 2010). The wind energy will cause insecurity due to the unpredictability because its production depends on natural factors (Purvins et al., 2011). To Luickx et al. (2008), states that challenges consist on inflexibility, unpredictability and variability. For Jacobsen and Zvingilaite (2010), variability leads to: (i) periods with surplus production causes a reduction of the average market price; (ii) the profitability of other technologies decreases; and (iii) price fluctuations in the market increases, as well as the unpredictability leads to: (i) higher compensation costs for wind energy, and (ii) greater fluctuation of intermittent generation. The perspective the Camadan (2011), states that it should be noted that if the variability is not totally new to the network management, then both the energy supply as the demand is uncertain.
The energy prices are tending to fluctuate more due to the wind availability, i.e., when the wind availability is more constant, less is the price, on the contrary, if the wind availability is less constant, higher is the price (Munksgaard and Morthorst 2008; Jacobsen and Zvingilaite 2010). On the other hand, the power generation system are not certain about buying renewable energy due to its higher price compared to the non-renewable energy (Yang et al., 2012). Beyond the energy price being high, the power generation system prefers the fossil fuels because they offer more stability, in fact their production is continuous (Yang et al., 2012).
The electrcicty production in off-peak is also a challenge for the power generation system(Azcárate et al., 2012). The high penetration of wind power makes increase cost of balancing the energy system(Sorknæs et al., 2013). Green and Vasilakos (2010) argues that there is significant risk only if the system has a high penetration of wind power. One of the most powerful strategies to manage the wind energy is the interconnection of grid (Camadan, 2011). Connection to other countries helps to better resource efficiency (Camadan, 2011). The unpredictability of wind power
4
generation is the main difficulty of the management of wind park, due to the force of the wind that does not disclose the exact output of electricity generated (Azcárate et al., 2012). However, the introduction of new equipment such as simulation tools, have become vital to forecast wind energy as assessing the economic viability (Azcárate et al., 2012).The management of wind power in peak hours will be a great challenge. The power generation system were not prepared for such a rapid growth of generated wind power. This way they will have to invest in a better management structure for this discontinuous production source that produces not according to demand (Azcárate et al., 2012). Mignard et al. (2007) reported that the wind power will have a positive correlation with exports. Denmark is referred by the literature as the country that better manages its intermittent wind energy in off-peak, mainly due to its geographical position. This deals with a significant amount of wind energy, seeing it has good interconnections with neighboring countries. Denmark can easily export the energy produced. Recently, Turkey has opted for interconnection with Greece and Bulgaria in order to limit the risk of wind energy (Camadan, 2011).
3. Portuguese electrical system
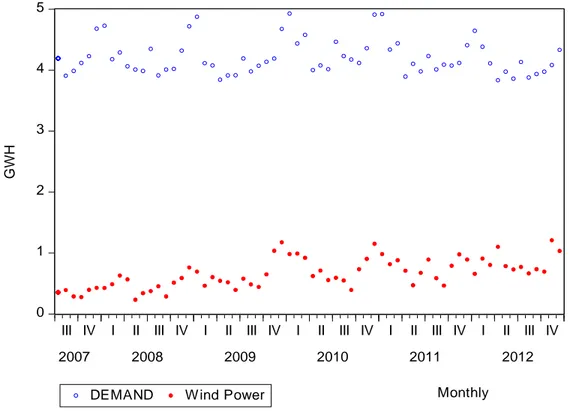
The increased penetration of wind power in power generation systems influence the total electricity generation (Albadi and El-Saadany 2010). In most countries the wind power has still little impact on the power generation system. Portugal is one of many cases. Although Portugal is being based into two regimes two: ordinary that is based in the production of traditional resources of non-renewable energy especially coal and natural gas in big hydric production centers; special based in the production of renewable resources or cogeneration. The power generation system still has a high share of renewable energy production. Observing the Figure 1, this with monthly data from 2007 to 2012 taken from REN, we noted that wind energy currently does not have much impact on the Portuguese power generation system.
5
In the power generation system of the European countries , production of electricity is mostly generated by fossil fuels (Mignard et al., 2007; Bove et al., 2012). In Portugal due to the little energy resources, and to meet the EU directive on renewable energy (2001/77/EC), the Portuguese government has focused on the expansion of energies (Shahbaz et al., 2011). It is important to note that the feed-in tariffs were a major impetus for the expansion of these ones (Klessmann et al., 2011). Marques and Fuinhas (2012), states that policies that subsidize the promotion of renewable energy are effective. In the coming years, this pattern on the energy system tends to change. The renewable energy share, especially wind energy, continues to grow within the electricity generation system (Azcárate et al., 2012). Figure 2 illustrates a possible scenario for the future power generation system.Figure 2 – The demand on total net production 0 1 2 3 4 5
III IV I II III IV I II III IV I II III IV I II III IV I II III IV
2007 2008 2009 2010 2011 2012
DEMAND W ind Power
G
W
H
6
With the increase of production of renewable energy, we see a prevision of (Bove et al., 2012) argues that this way three effects are predictable in energy systems: (i) more flexible generation due to intermittency of renewable; (ii) reduction of thermal center thereby increasing the cost of electricity; and (iii) excess wind which can be used for other related particular export. Recently Azcárate et al. (2012), states that there is the following consequences: (i) the peak electricity demand will not always focus on peak production; (ii) price fluctuations; and (iii) surplus off-peak electricity. One of the solutions to balance the power system is to export the excess of off-peak produced energy. As can be seen from the chat, renewable energy share is increasing, i.e, it will become increasingly difficult to balance the system. Besides Portugal must continue to increase its renewable energy capacity in order to meet the targets of the Kyoto Protocol. Another way to manage the excess energy caused by the wind energy is the hidric pumpus system. This technique allows a better use of hidric sources in order to less use conventional sources. (Gopal et al., 2013).3 3 4 4 4 5 5 6
III IV I II III IV I II III IV I II III IV I II III IV I II III IV
2007 2008 2009 2010 2011 2012
Total Net Prod. DEMAND Monthly
G
W
7
4. Data and Methodology
This work aims to study how the generation sources interact in ordinary and special regimes, namely wind power in the special, as well as their relationship with a system management variable, the exports. Thus, the methodology used was the Vector Autoregressive model (VAR). This method is used because, according to the Granger causality test / Block exogeneity, variables interact with each other, i.e. there is no independent variables because they all depend on each other. Taking into account that the variables are not co-integrated, the VAR model with variables in levels is used as follows:
𝑋
𝑡= ∑ Γ
𝑖.𝑋
𝑡−𝑖+ 𝐶
.𝐷
𝑡+ 𝜀
𝑡,
𝐾𝑖=1
where Xt is the vector of the endogenous variables, and Dt is the vector of exogenous variables, Γi is the coefficient matrix of endogenous variables, C is the coefficient matrix of exogenous variables, and k is the optimal lag number. The vector of endogenous variables is Xt = [EO,CONS,ORTP,EEP]. The vector of exogenous variables is Dt =[constant, dpr, christmas, weekend, i1, i112, i16, i4, i111, i55, i28, i82, i9, i23, i5, i3, i237, i117, i43, i157, i34, i136, i197, i52, i175], where the id’s and dpr controls the seasonality effects. The weekend and Christmas control the effect. The residual are denote by εt.
This model is a system of equations in which each variable is explained by its lagged values and the lagged values of the remaining variables of the system thus allowing only describe statistical relationships between the variables. This treats the variables as endogenous potential, thus evaluating relationships, without the prior need to distinguish the endogenous variables of the exogenous variables. The VAR model was estimated using the econometric software Eviews 7.2.
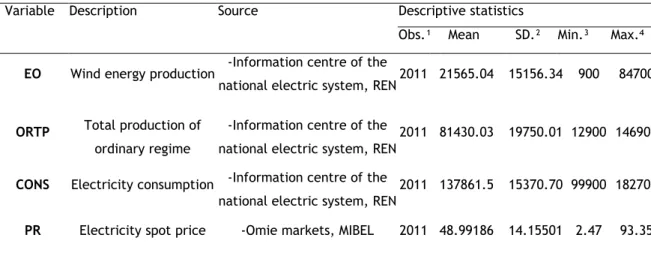
Table 1 – Variable definitions, sources and summary statistics.
Variable Description Source Descriptive statistics
Obs.¹ Mean SD.² Min.³ Max.⁴
EO Wind energy production -Information centre of the
national electric system, REN 2011 21565.04 15156.34 900 84700
ORTP Total production of
ordinary regime
-Information centre of the national electric system, REN
2011 81430.03 19750.01 12900 146900
CONS Electricity consumption -Information centre of the
national electric system, REN
2011 137861.5 15370.70 99900 182700
8
For this investigation it was used a database that relates to the period of July 2007 until 2012 with daily frequency. All these data were collected from the information center of the National Energy Network (REN) and the Iberian Electricity Market (MIBEL). All this information is in Table 1.Wind Energy production (EO) - The literature talks about wind energy integration in energy systems
(Mignard et al., 2007; Bove et al., 2012), about the impact that this has on the price of electricity generated (Jacobsen and Zvingilaite 2010; Lund et al., 2013). The wind energy production is increasingly correlated with exports and imports because of its fickle production (Mignard et al., 2007; Lund et al., 2013). The increase of wind power in power generation system will have to provide more efficient management (Camadan, 2011).
Electricity Consumption (CONS) - Power consumption in the literature is closely linked to the
development of the country. There is extensive literature between consumption and production (Payne, 2010). Less energy consumption less production in the country (Bhattacharyya, 2009). The energy consumption can be supplied by fossil fuels, renewable energy and a mixture of both (Marques et al., 2010).
Ordinary Regime Total Production (ORTP) - Fossil fuels are losing importance due the increase of
renewable energy production. Today, most of the countries members of the European Union still relies on fossil fuels (Szarka et al., 2008).In Portugal the electricity generated by fossil fuels comes from coal, oil and gas(Shahbaz et al., 2011).
Electricity spot price (PR) - With the entry of renewable energy in power systems the electricity
price suffers more variations (Jacobsen and Zvingilaite 2010). It is necessary to predict the energy demand to thus set prices (García-Ascanio and Maté 2010;Jacobsen and Zvingilaite 2010; Azcárate et al., 2012). The electricity generated from wind is more expensive than that which is generated by fossil fuels, although the difference has been converging (Camadan, 2011). The spot price shows strong seasonality, both annually, weekly and daily due to the volatility of short duration and sudden changes in prices generally known as peaks.
Electricity exports proxy (EEP) - This variable is an estimative of the difference between net import
and net export. It is assumed that this variable is an export stimulator. It is believed that the electricity proxy export variable is important to explicate the relation between exports and wind energy.
EEP Electricity proxy export -Raw data from REN 2011 31934.11 27588.96 76800 96400
Notes: ¹¹ ¹ Observations. ² Standard deviation. ³ Minimum. ⁴ Maximum.
9
The correlation matrix was performed before the traditional tests (Appendix A.1). The values suggest that the correlation coefficients are very low and do not suggest the existence of collinearity.Table 1 – Variable definitions, sources and summary statistics
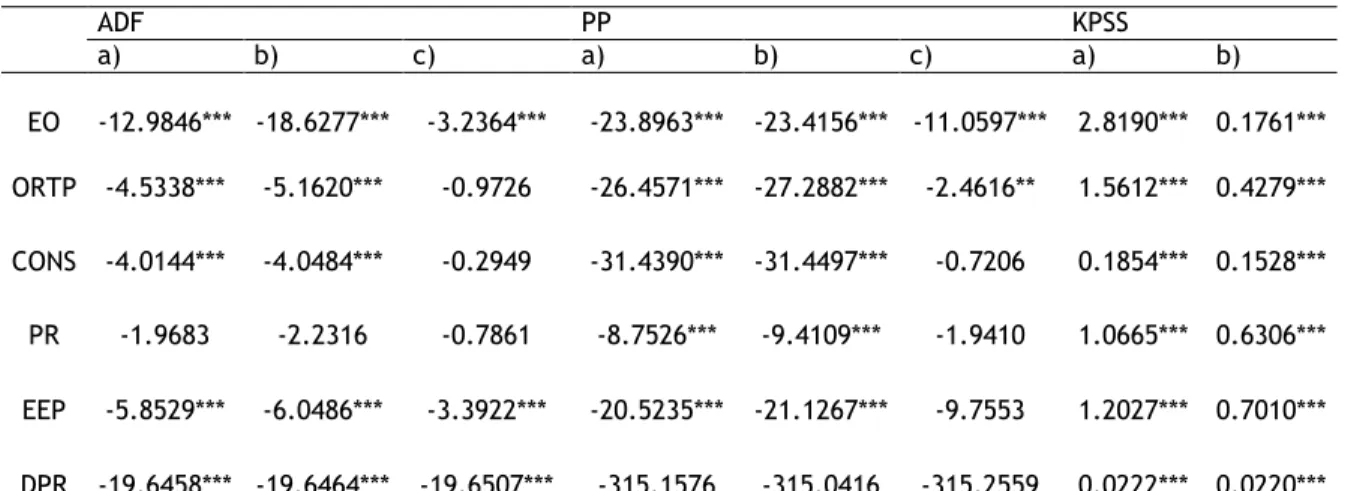
ADF PP KPSS a) b) c) a) b) c) a) b) EO -12.9846*** -18.6277*** -3.2364*** -23.8963*** -23.4156*** -11.0597*** 2.8190*** 0.1761*** ORTP -4.5338*** -5.1620*** -0.9726 -26.4571*** -27.2882*** -2.4616** 1.5612*** 0.4279*** CONS -4.0144*** -4.0484*** -0.2949 -31.4390*** -31.4497*** -0.7206 0.1854*** 0.1528*** PR -1.9683 -2.2316 -0.7861 -8.7526*** -9.4109*** -1.9410 1.0665*** 0.6306*** EEP -5.8529*** -6.0486*** -3.3922*** -20.5235*** -21.1267*** -9.7553 1.2027*** 0.7010*** DPR -19.6458*** -19.6464*** -19.6507*** -315.1576 -315.0416 -315.2559 0.0222*** 0.0220*** Note: a) represents the test statistic with intercept; b) represents the test statistic with trend and
intercept; c) represents the test with none; ***,** and * denote significance at 1%, 5% and 10%, respectively
The properties of the variables in the equation of time series are verified through tests Augmented Dickey-Fuller (ADF), Philips Perron (PP) and Schmidt Schin Kwiatkowski Phillips (KPSS). These procedures performed in Table 2 are needed to make sure that none of the variables are not in an integrated manner. Observing the table and using the ADF test we found that the variables EO, ORTP, CONS and EEP does not contain a unit root in their levels, i.e., I(0) for the unit root tests ADF. The PR variable has a unit root in the order I(1), but this is stationary in their first differences indicate that it is integrated in order I(1).
The purpose of the application of the first differences, is to remove the trend and a seasonal difference for seasonality. According to SIMS (1980) is not suitable to distinguish the series even though they have a unit root, in fact, they may eliminate relations between the variables. Lutkepool (2005), suggested that the differentiation of the series can change the interesting features of the relations between the original variables.
In the VAR model, all variables are endogenous and depend on own lags and the lags of all the variables of the system variables. To select the optimal lags for the VAR model, the traditional criteria for lags were used. The criteria used were the Schwarz (SC), Akaike information criterion (AIC), Hanan - Quinn information criterion (HQ) and the Schwarz Bayesian information criterion (SBC). After the test conducted 12 lags were used according to the Akaike Information Criterion (Appendix A.2).
10
Granger causality allows us to identify the causal relationship between the variables, which, according to Granger, occurs when a particular EEP variable in the present or in the past helps to predict future values of another EEP variable. Looking at the table above, Granger has detected causality in all the equations in general. When the dependent variable is ORTP all explanatory variables, EO and degrees of significance for the 5 and 10% and CONS for all levels of significance. For EO, CONS, exists for all levels of significance except for ORTP that is just have with a significance level of 10%. For CONS, have for all levels of significance except ORTP that has only for the level of significance of 10%. Finally, the EEP variable only have causality with the EO and CONS variables, in other words it does not cause any reaction for ORTP. In short, the Granger has mainly detected causality in the following series: CONS ORTP, EO CONS, EO EEP, CONS EO, CONS EEP and EEP EO and EEP CONS, means that these variables reinforce the endogeneity.
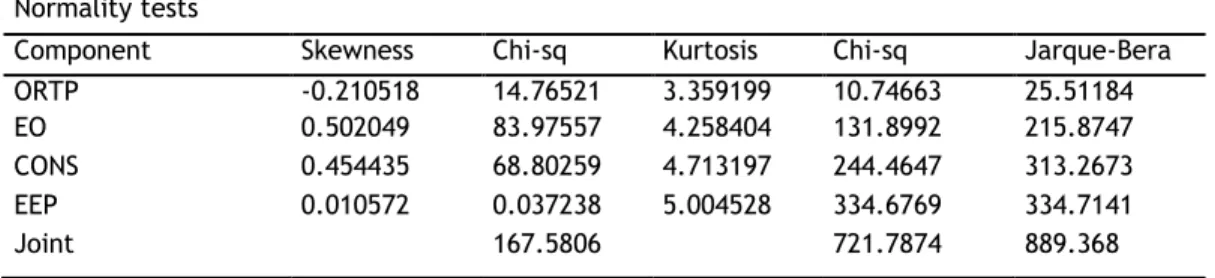
The validity of the estimated VAR model was evaluated by diagnostic tests , normal through the Jarque-Bera (Table 4), autocorrelation through the LM test (Appendix 2) and heterosedasticity performing the White test (no cross terms), see Appendix A.3.
Table 4 – VAR diagnostic tests Normality tests
Component Skewness Chi-sq Kurtosis Chi-sq Jarque-Bera
ORTP -0.210518 14.76521 3.359199 10.74663 25.51184
EO 0.502049 83.97557 4.258404 131.8992 215.8747
CONS 0.454435 68.80259 4.713197 244.4647 313.2673
EEP 0.010572 0.037238 5.004528 334.6769 334.7141
Joint 167.5806 721.7874 889.368
Knowing that the normality tests should have a normal distribution, autocorrelation has not been detected. However these results do not indicate that fact. Nevertheless, there is no reason to dramatize, indeed in certain scientific fields, namely financial, the results are identical to those
Table 3 – Granger causality/Block exogeneity
Dependent Variable
ORTP EO CONS EEP
ORTP does not cause - 23.06200* 97.50720* 24.09985
EO does not cause 18.84902** - 92.28383*** 30.54910***
CONS does not cause 18.58443*** 33.34925*** - 38.90912*** EEP does not cause 16.61730** 27.54915*** 91.85386*** -
All 99.53451*** 108.6404*** 159.2493*** 148.3550***
*Notes: : “All” denotes the causality test set for all independent variables ***,** and * denote significance at 1%,
11
obtained. The robustness tests show that there is little evidence of: (i) there is not a normal distribution; (ii) autocorrelation was detected: and (iii) there is heterocedasticity. However these results do not discredit the estimated VAR model. In other areas of study, particularly in the financial area and since it works with daily data the same scenario happens very often. The variables have a heavy-tailed distribution which is incompatible with normality, that is, the high kurtosis is a parameter that does not suggest the normality (Mandelbrot, 1963; Fama, 1965), which it then carries to the estimation of models of conditional heterocedasticity (Fernandes et al., 2004; Arias and Torres, 2004). For excess kurtosis nor with the introduction of dummy variables to correct the outliers, the series have a normal distribution (Santos, 2004). Most authors agree that it is very difficult to predict prices from past prices. In this case it leads to think that it is very difficult too to predict the wind power, as well as consumption and the prices based on the previous prices, due to intermittency.The forecast of the error variance decomposition allows us to evaluate how one variable responds to shocks on the specific variables. In table 5 shocks are studied over a period of 30 days.
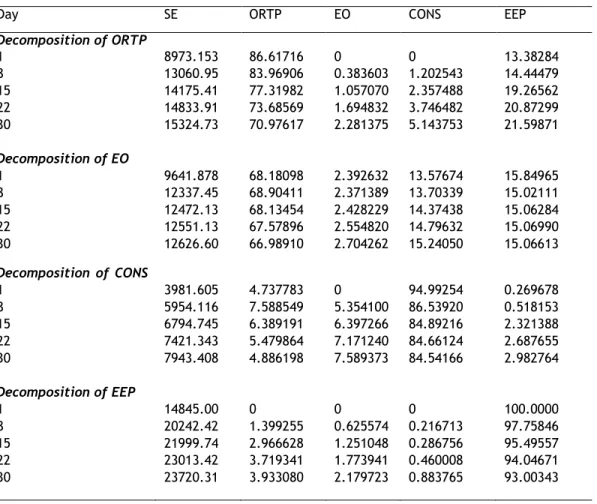
Table 5 – Variance decomposition
Day SE ORTP EO CONS EEP
Decomposition of ORTP 1 8973.153 86.61716 0 0 13.38284 8 13060.95 83.96906 0.383603 1.202543 14.44479 15 14175.41 77.31982 1.057070 2.357488 19.26562 22 14833.91 73.68569 1.694832 3.746482 20.87299 30 15324.73 70.97617 2.281375 5.143753 21.59871 Decomposition of EO 1 9641.878 68.18098 2.392632 13.57674 15.84965 8 12337.45 68.90411 2.371389 13.70339 15.02111 15 12472.13 68.13454 2.428229 14.37438 15.06284 22 12551.13 67.57896 2.554820 14.79632 15.06990 30 12626.60 66.98910 2.704262 15.24050 15.06613 Decomposition of CONS CONS 1 3981.605 4.737783 0 94.99254 0.269678 8 5954.116 7.588549 5.354100 86.53920 0.518153 15 6794.745 6.389191 6.397266 84.89216 2.321388 22 7421.343 5.479864 7.171240 84.66124 2.687655 30 7943.408 4.886198 7.589373 84.54166 2.982764 Decomposition of EEP 1 14845.00 0 0 0 100.0000 8 20242.42 1.399255 0.625574 0.216713 97.75846 15 21999.74 2.966628 1.251048 0.286756 95.49557 22 23013.42 3.719341 1.773941 0.460008 94.04671 30 23720.31 3.933080 2.179723 0.883765 93.00343
12
The ORTP variable has an immediate shock of 86% on it and diminishes along periods having only a shock in the last period of approximately 71% as we can observe in the table described above. The EO and CONS don't have an immediate effect on ORTP. In fact, in the first period, they do not have any effect but on the latter they have an effect of 2 and 5%. Finally, the EEP has an effect of 13% at the beginning and gradually increasing until the last period causing a shock of 21%. The EO has a very small impact on her own about 2%. ORTP has an immediate effect of 68% and decreases during periods its influence on the EO. The EEP has a very similar effect on the EO of 15% over the periods.The CONS have an immediate shock of 94% and will dilute over the periods. The EO does not generate any impact in the first period but in the last period it generates a shock of 7%. Regarding the ORTP this variable has a higher shock until the second period it, reducing its influence in the next periods. The EEP has a shock almost nil, and finally it has an impact of 2% in explaining the CONS. Finally, the EEP is 100% explained in the first period from her own, and the other variables have no impact on EEP. However as they advance the periods of the shock IBS increases. Consumption is what has less impact on the EEP.
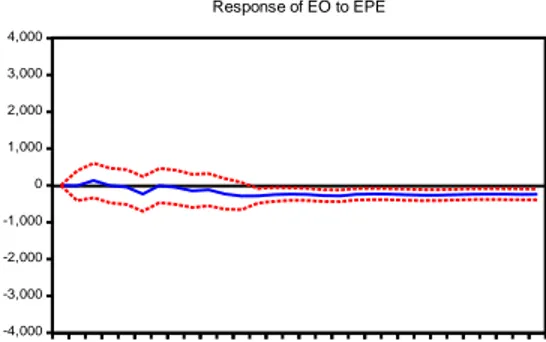
The impulse response (Figure 3) function allows us to analyse the behaviour of the variables according to an impulse existing in another variable. In other words that shows the effect of a shock in a given period it has on the values of the present and future endogenous variables. The impulse response can be used for the purpose of making political decisions considering the explanatory variables. When the impulse response statistics parcels are within the critical limits it means that all error correction models are stable.
Figure 3 – Impulse response functions
-2,000 -1,500 -1,000 -500 0 500 1,000 1,500 2,000 2 4 6 8 10 12 14 16 18 20 22 24 26 28 30 Response of EO to CONS -4,000 -3,000 -2,000 -1,000 0 1,000 2,000 3,000 4,000 2 4 6 8 10 12 14 16 18 20 22 24 26 28 30 Response of EO to EPE
13
-1,000 -500 0 500 1,000 1,500 2,000 2 4 6 8 10 12 14 16 18 20 22 24 26 28 30 Response of CONS to EO -1,000 0 1,000 2,000 3,000 4,000 2 4 6 8 10 12 14 16 18 20 22 24 26 28 30Response of CONS to CONS
-2,000 0 2,000 4,000 6,000 8,000 10,000 2 4 6 8 10 12 14 16 18 20 22 24 26 28 30
Response of ORTP to ORTP
-2,000 0 2,000 4,000 6,000 8,000 10,000 2 4 6 8 10 12 14 16 18 20 22 24 26 28 30 Response of ORTP to EO -2,000 -1,000 0 1,000 2,000 3,000 4,000 2 4 6 8 10 12 14 16 18 20 22 24 26 28 30
Response of ORTP to CONS
-2,000 -1,000 0 1,000 2,000 3,000 4,000 2 4 6 8 10 12 14 16 18 20 22 24 26 28 30
Response of ORTP to EPE
-1,000 -500 0 500 1,000 1,500 2,000 2 4 6 8 10 12 14 16 18 20 22 24 26 28 30
Response of CONS to EPE
-6,000 -4,000 -2,000 0 2,000 4,000 6,000 2 4 6 8 10 12 14 16 18 20 22 24 26 28 30
14
In ORTP, the expected variable ORTP has a strong shock and, immediately decreases in the periods that tend to zero. When the ORTP explanatory variable is the EO that has an increasing effect until the tenth period and then will decrease slightly over the period. And in the ORTP explanatory variable has an immediate and growing effect tending to zero. The EO and CONS are explained by themselves, they have a decreasing shock until the eighth and then periods until it slightly stabilize over the periods. Has a negative effect over the periods on CONS. The EEP and EO generate very similar shocks in. In the early periods it has an increasing effect but then it will decrease slightly. The EEP has an increasing effect in the early period but then the shocks generate a decreasing effect. ORTP and EO variables have an immediate and growing effect in EEP. The cons and EEP generate a negative shock in the EEP.-2,000 0 2,000 4,000 6,000 8,000 2 4 6 8 10 12 14 16 18 20 22 24 26 28 30 Response of EO to EO -8,000 -6,000 -4,000 -2,000 0 2,000 4,000 2 4 6 8 10 12 14 16 18 20 22 24 26 28 30 Response of EO to ORTP -1,000 -500 0 500 1,000 1,500 2,000 2 4 6 8 10 12 14 16 18 20 22 24 26 28 30
Response of CONS to ORTP
-4,000 -2,000 0 2,000 4,000 6,000 8,000 10,000 2 4 6 8 10 12 14 16 18 20 22 24 26 28 30
Response of EPE to EPE
-15,000 -10,000 -5,000 0 5,000 10,000 2 4 6 8 10 12 14 16 18 20 22 24 26 28 30 Response of EPE to EO -15,000 -10,000 -5,000 0 5,000 10,000 2 4 6 8 10 12 14 16 18 20 22 24 26 28 30 Response of EPE to EO
15
5. Discussion
The wind power can have an impact on exports and it may also influence the price, and management due to the introduction of renewable energy in the power generation system as stated in the literature. In fact we will see policy measures can be taken which considering some variables that attempt to influence the others.
One of the countries that have been betting in the emerging technologies for the production of renewable energies is Portugal. There remains much dependency on fossil fuels and it is crucial to continue to invest in renewable energy in order to reduce this dependency. Portugal has been strongly investing in these resources with the help of subsidiary entities and once they have to meet certain standards that the Kyoto Protocol has, it only helps to accelerate this process. The increase in electricity generation from renewable sources caused an increase in electricity prices. However we have to see that the technology is cutting edge and over time tends to decrease, thus decreasing also the price. Since Portugal is dependent on fossil fuels (oil, gas, coal), it becomes crucial to find a solution to reduce energy dependence. In 2003, fossil fuels in Portugal represented 62% of total electricity generation and renewable energy had a weight of 38% (IEA, 2004). In 2010, renewable energy generates 45% of electricity (Rosenthal, 2010). Over the past few years, the fossil fuel has been lost in comparison with the wind energy production. The investment in renewable energy is generating negative shocks on fossil fuels thereby reducing the share they have in the electricity total generation. However, the negative influence of the EO on the ORTP tends to stagnate, i.e., the impact of EO will never wipe out the ORTP because renewables are intermittent and not very reliable (Østergaard, 2009).
The ORTP will be the security of energy systems. Transmission network have failed to keep up with the increased capacity of wind power installation (Boccard, 2009). However REN goes against the literature, in Portugal the electricity carrier has accompanied the increase in electricity capacity thus reducing the loss of wind power as cited by some researchers (Zhao et al., 2009). Most of the transmission network of electricity were not prepared for such a rapid growth of renewable energy. Wind park cannot be placed at random because the further from the consumption centres, the further the loss.
The evolution of the wind power forces the power generation system to adopt other management policies. As mentioned in the literature review the wind power produces randomly and not according to demand (Azcárate et al., 2012), i.e. the electricity consumption has no major impact on wind energy (Table 5 and Figure 1). The intermittent production can create surplus production and so Portugal will have to try to export the energy produced. Besides this, this country
16
have to continue to increase installation capacity and wind power in order to meet the targets of the Kyoto Protocol by 2020. With this scenario the problems tend to worsen if no action is taken to balance the power generation system. Measures such as export and pumping must be strengthened to overcome such challenges that hinder the management to balance the Portuguese electricity system.The fact that Portugal is inserted in an electric system of the Iberian Peninsula, will allow to obtain greater flexibility and efficiency in the management of renewable resources.However there must be good cooperation between these two countries, as the decision-making in one country can influence the other. Since one of the major problems of energy systems is the storage of electricity(Franco and Salza 2011), it will be necessary to give a solution for production surplus. Some researchers have shown a positive correlation between export and wind power (Mignard et al., 2007; Lund et al., 2013). For Portugal this can be very beneficial because we are one of the countries with the most installed capacity, however we only have Spain to sell our surplus. Another problem that can come to check is the current crisis, consumption decreases and the surplus production increases, hindering the export of electricity, as demand is lower. The EO negatively influences the import balance. So the more the countries invest in EO the less they depend on fossil fuels and we achieve more exports. However Portugal will never export as Denmark in fact, is surrounded by Germany, Sweden and Norway (Jacobsen and Zvingilaite, 2010).
The Production in an ordinary and special regime has evolved, asymmetrically, over the last few years. As the resources of renewable energy evolve, fossil fuels lose importance as we see in the results. Today, the renewable energy is gaining strength in the power generation system. Natural resources for renewable energy have a very important role in the production of energy and will have an increasing role in satisfying the demand. However, fossil fuels give more security to power generation system only because it has a continuous production. Beyond this, they can be regulated in the price of electricity, as it is less expensive when generated in primary sources. The introduction of renewable energies should be introduced in a more reliable and sustained manner. In that way, the consumers, electrical transmission entities and others should prepare to adopt a new world with an increasing share of clean energy.
17
6. Conclusion
This study is focused in Portugal on the period of July, 2007 and 2012 with daily frequency, to thereby realize how wind power interact with the export of electricity. Indeed, this study sought to contribute to the debate about increasing installed wind power capacity, this intermittency in the energy system, fluctuating electricity prices and the influence of wind energy production in exports. It is important to recall that the increase of the capacity of renewable energy, especially wind power, have a great support from incentives, including feed-in tariffs. However, the increase of wind power is causing some challenges integrating in power generation system due to the wind power being intermittent. Portugal has already a well-integrated grid with wind power but still no one was leaning on the impact that this could or may cause on the electricity export.
The results show that there is a positive correlation with the wind energy production and the electricity exports. Over the years the full production under the ordinary regime is losing share within power generation system. Such that in the exogeneity test the wind energy production over periods will have more impact on consumption as opposed to full production under the ordinary regime. Besides this the price is also decreasing with technological progress on the electricity wind fans.
With the focus on renewable energies especially wind power we can meet the goals of the Kyoto Protocol and we can also less dependent on fossil fuels Thus, it is crucial to outline the best wind power management so as to prevent the loss of generated electricity. The implementation of new wind parks should not only lead to investors the idea of providing energy for Portugal but also think that it can be exported as does Denmark.
With the focus on renewable energy, especially wind power, the goals of the Kyoto Protocol can be meet and Portugal can become less dependent on fossil fuels. Thus it becomes interesting as future lines of research, studying the percentages of renewable and non-renewable energy in the energy mix. The implementation of new wind parks should not only lead investors to the idea of providing energy to Portugal, but it can also be exported as does Denmark. This study can be applied to other countries that are investing the same as Portugal invests in renewableresources. The results show that causality exists between the variables,i.e, they interact with each other. In addition, there is a bidirectional causal relationship between consumption and wind power and between the electricity proxy exports and consumption. This study shows that there is endogeneity between variables and a positive correlation between the electricity exports and wind power in Portugal
18
Albadi, M.H. & El-Saadany, E.F., 2010. Overview of wind power intermittency impacts on powersystems. Electric Power Systems Research, 80(6), pp.627–632.
Azcárate, C. et al., 2012. Peaking strategies for the management of wind-H2 energy systems.
Renewable Energy, 47, pp.103–111.
Bhattacharyya, S.C., 2009. Fossil-fuel dependence and vulnerability of electricity generation: Case of selected European countries. Energy Policy, 37(6), pp.2411–2420.
Boccard, N., 2009. Capacity factor of wind power realized values vs. estimates. Energy Policy, 37(7), pp.2679–2688.
Bove, R., Bucher, M. & Ferretti, F., 2012. Integrating large shares of wind energy in macro-economical cost-effective way. Energy, 43(1), pp.438–447.
Camadan, E., 2011. An assessment on the current status and future of wind energy in Turkish electricity industry. Renewable and Sustainable Energy Reviews, 15(9), pp.4994–5002. Dale, L. et al., 2004. Total cost estimates for large-scale wind scenarios in UK. Energy Policy,
32(17), pp.1949–1956.
Franco, A. & Salza, P., 2011. Strategies for optimal penetration of intermittent renewables in complex energy systems based on techno-operational objectives. Renewable Energy, 36(2), pp.743–753.
García-Ascanio, C. & Maté, C., 2010. Electric power demand forecasting using interval time series: A comparison between VAR and iMLP. Energy Policy, 38(2), pp.715–725.
Gopal, C. et al., 2013. Renewable energy source water pumping systems—A literature review.
Renewable and Sustainable Energy Reviews, 25, pp.351–370.
Green, R. & Vasilakos, N., 2010. Market behaviour with large amounts of intermittent generation.
Energy Policy, 38(7), pp.3211–3220.
Klinge Jacobsen, H. & Zvingilaite, E., 2010. Reducing the market impact of large shares of intermittent energy in Denmark. Energy Policy, 38(7), pp.3403–3413.
Luickx, P.J., Delarue, E.D. & D’haeseleer, W.D., 2008. Considerations on the backup of wind power: Operational backup. Applied Energy, 85(9), pp.787–799.
Lund, H. et al., 2013. System and market integration of wind power in Denmark. Energy Strategy
Reviews, 1(3), pp.143–156.
Marques, António C., Fuinhas, J. a. & Pires Manso, J.R., 2010. Motivations driving renewable energy in European countries: A panel data approach. Energy Policy, 38(11), pp.6877–6885. Marques, António Cardoso & Fuinhas, J.A., 2012. Are public policies towards renewables
successful? Evidence from European countries. Renewable Energy, 44, pp.109–118. Mignard, D., Harrison, G.P. & Pritchard, C.L., 2007. Contribution of wind power and CHP to
19
Munksgaard, J. & Morthorst, P.E., 2008. Wind power in the Danish liberalised power market—Policy measures, price impact and investor incentives. Energy Policy, 36(10), pp.3940–3947. Østergaard, P.A., 2009. Reviewing optimisation criteria for energy systems analyses of renewable
energy integration. Energy, 34(9), pp.1236–1245.
Payne, J.E., 2010. A survey of the electricity consumption-growth literature. Applied Energy, 87(3), pp.723–731.
Purvins, A. et al., 2011. Challenges and options for a large wind power uptake by the European electricity system. Applied Energy, 88(5), pp.1461–1469.
S, B. De, 2004. Desempenho de Estimadores de Volatilidade na Bolsa de Valores de S ˜. , 58(3), pp.429–448.
Shahbaz, M., Tang, C.F. & Shahbaz Shabbir, M., 2011. Electricity consumption and economic growth nexus in Portugal using cointegration and causality approaches. Energy Policy, 39(6), pp.3529–3536.
Sorknæs, P. et al., 2013. Market integration of wind power in electricity system balancing.
Energy Strategy Reviews, 1(3), pp.174–180.
Szarka, N. et al., 2008. Atmospheric emissions modeling of energetic biomass alternatives using system dynamics approach. Atmospheric Environment, 42(3), pp.403–414.
Wang, Q., 2010. Effective policies for renewable energy—the example of China’s wind power— lessons for China's photovoltaic power. Renewable and Sustainable Energy Reviews, 14(2), pp.702–712.
Yang, M., Patiño-Echeverri, D. & Yang, F., 2012. Wind power generation in China: Understanding the mismatch between capacity and generation. Renewable Energy, 41, pp.145–151. Zhao, Y., Hao, L.-S. & Wang, Y.-P., 2009. Development strategies for wind power industry in
Jiangsu Province, China: Based on the evaluation of resource capacity. Energy Policy, 37(5), pp.1736–1744. A
20
Appendix
*indicates lag order selected by the criterion
LR: Sequential modified LR statistic (each test at 5%, level) FPE: Final Prediction Error
AIC: Akaike information Error SC: Schwarz information criterion HQ: Hannan-Quinn information criterion
Appendix A.1 – Correlation Matrix
1 2 3 4
ORTP 1 1.000
EO 2 -0.419188 1.000
CONS 3 0.618770 0.148020 1.000
EEP 4 -0.379817 -0.405082 -0.130456 1.000
Appendix A.2 – Criteria Lag Length Lag length Criteria
Lag LogL LR FPE AIC SC HQ
0 -85558.80 NA 2.40e+32 85.91062 86.41553 86.09604 1 -80828.06 9229.221 2.13e+30 81.18643 81.73622 81.38832 2 -80667.67 312.2537 1.85e+30 81.04175 81.63643 81.26013 3 -80306.04 702.6119 1.31e+30 80.69543 81.33498 80.93028 4 -80074.33 449.2569 1.05e+30 80.47929 81.16372 80.73062 5 -79729.49 667.2227 7.56e+30 80.14979 80.87910 80.41760 6 -79673.65 107.8190 7.27e+29 80.10987 80.88406 80.39416 7 -79585.39 170.0613 6.76e+29 80.03746 80.85654 80.33824 8 -79504.13 156.2415 6.33e+29 79.97208 80.83604* 80.28934 * 9 -79480.73 44.90601 6.29e+29 79.96466 80.87350 80.29840 10 -79465.72 28.74370 6.29e+29 79.96565 80.91937 80.31587 11 -79442.54 44.29088 6.25e+29 79.95846 80.95706 80.32516 12 -79419.69 43.57791 6.21e+29* 79.95159* 80.99507 80.33477 13 -79405.63 26.75276 6.22e+29 79.95353 81.08908 80.35320 14 -79391.92 26.02634 6.23e+29 79.95583 81.08908 80.37198 15 -79377.30 27.70171* 6.24e+29 79.95722 81.13534 80.38984
21
Appendix A.3 – Autocorrelation LM tests
Autocorrelation LM tests Lags LM- Stat 1 302.3026 2 181.2487 3 29.13932 4 39.39870 5 27.44471 6 42.48624 7 29.36410 8 39.57929 9 28.54559 10 9.926300 11 20.43506 12 34.97701
White heteroskedasticity Chi-sq 2139.901