Universidade de Lisboa
Faculdade de Motricidade Humana
“Enhancing practice efficiency through
contextual interference in youth football”
Dissertação elaborada com vista à obtenção do Grau de Mestre em Treino
Desportivo
Orientador académico: Professor Doutor Pedro José Madaleno Passos
Júri: Presidente:
Professora Doutora Anna Georgievna Volossovitch Vogais:
Professora Doutora Rita Cordovil Matos Professor Doutor Pedro José Madaleno Passos
Ricardo Ranito Vicente 2018
2
Acknowledgment
First and foremost I would like to thank my dear friend Daniel Silva for all his support without which, the realization of this master thesis would not be possible. Thank you.
I would also like to thank my mentor Professor Pedro Passos for whom his guidance, wisdom and expertise allowed me to not only learn a lot but also to open my mind to new horizons. Thank you for this feeling of accomplishment.
Last but not least, I would like to thank my family, especially my mother, for all the concern and care one could ever ask for.
3
Figures Index
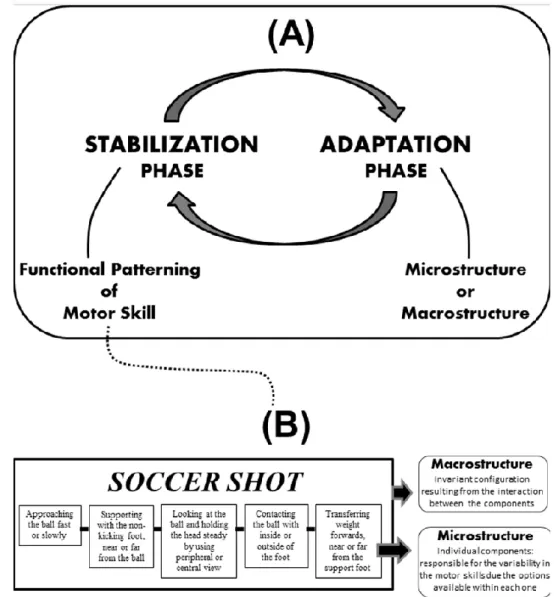
Figure 1. Illustration of (A) adaptive process of motor learning involving the phases of functional stabilization (structure/pattern formation) and adaptation (structure/pattern reorganization), and (B) hierarchical organization of a motor skill control structure (a
soccer shot example) ... 10
Figure 2. Task for the control group with no contextual interference ... 11
Figure 3. Task for the experimental group with contextual interference ... 12
Figure 4. Number of times the attacker rotated left after receiving the ball – 2nd position ... 13
Figure 5. Ball passed through the left of the defender - 1st position... 14
Figure 6. Ball passed through the right of the defender - 5th position ... 14
Figure 7. Defender tackled the striker - 1st position ... 15
4
Tables Index
Table 1. Chi-square tests for "attacker was tackled by the defender" for the 3rd position on the intermediate evaluation ... 14 Table 2. Chi-square tests for "shot hit the target" for the 3rd position on the intermediate evaluation ... 16
5
Index
Abstract ... 6 1. Introduction ... 7 1.1 Differential Learning ... 7 1.2 Contextual Interference ... 81.3 An Adaptive Process of Motor Learning ... 9
2. Method ... 11 2.1 Participants ... 11 2.2 Task ... 11 2.3 Procedures ... 12 2.4 Statistical Analysis ... 13 3. Results ... 13
3.1 Rotation after receiving the ball ... 13
3.2 Attacker shot through the left or right side of the defender ... 14
3.3 Attacker was tackled by the defender ... 15
3.4 Attacker dribbled the defender ... 16
3.5 Ball goes towards the target ... 16
4. Discussion ... 17
4.1 Rotation after receiving the ball ... 17
4.2 Attacker shot through the left or right side of the defender ... 17
4.3 Attacker was tackled by the defender ... 17
4.4 Attacker dribbled the defender ... 17
4.5 Ball goes towards the target ... 18
5. Conclusions ... 18
6. References ... 18
Appendix ... 20
Appendix 1 - Scheduling ... 20
Appendix 2 – Rotation after receiving the ball ... 20
Appendix 3 – Attacker shot through the left of the defender ... 35
Appendix 4 – Attacker shot through the right of the defender ... 50
Appendix 5 – Attacker was tackled by the defender ... 65
Appendix 6 – Attacker dribbled the defender ... 80
6
Abstract
To better understand how introducing variability in training could enhance motor skills learning, we compared a training approach without addition of variability in the practice conditions, with an approach with contextual interference in young football players. 12 athletes between the ages of 11 and 12 were divided into 2 groups, control (6) and experimental (6). The control group performed exercises with no variability in practice conditions and the experimental group performed exercises with contextual interference by series. They trained for 6 weeks, twice a week (30 minutes sessions), on ball control and shooting at goal tasks. Three evaluations were made, one initial, one intermediate and one final and were carried out two weeks apart. Both groups had the same amount of repetitions during the practice sessions. The experimental group improvement regarding ball control was statistically significant from the control group and the experimental group also hit the goal significantly more than the control group. These results allow us to suggest that adding variability to practice may lead to technical improvements in young football players and that variability in practice may potentialize an adaptive behavior to the environment.
Keywords: Variability, Motor Skills, Contextual Interference, Adaptation, Football,
7
1. Introduction
How motor skills are learned has always been an important subject in which researchers and professionals in coaching/educational fields have tried to optimize. Traditional influential models and theories of motor learning conceived of motor skills acquisition as a stabilization of the performance process (e.g. structure formation), in which initial inconsistency and lack of coordination in movement are gradually eliminated and replaced by patterned and accurate movements (Tani, Basso, Ugrinowitsch & Choshi, 2014) .
These models and theories have been questioned (Button, Lee, Dutt-Mazumder, Tan & Chow, 2012) because the characteristics of motor skills associated with team sports are complex and also, they have some degree of variability, so, an approach where a motor behavior is restricted to only one patterned solution seems reductive. Another reason why linear models have been contested is because the motor patterns are based on professional athletes and they do not account for individuality, whereas a more nonlinear approach leaves room to include it. Notwithstanding the contribution of the traditional models for understanding the motor skills phenomena, they display some disadvantages to explain the motor skill acquisition beyond the functional stabilization process.
A practical example of the foremost is during a football shot on a frontal position to the goal: according to the traditional models, during practice, if a player repeats that shot enough times he will “perfect” (i.e., stabilize) the motor skills required for it. But what if during gameplay that player has to take that shot with the weaker foot? What if the player has an opponent behind him/her? What if the defender is at the right side? Or on the contrary on the left side? What if the ball is jumping instead of standing still?
To address this dilemma, new approaches to the study of motor learning have emerged which consider nonlinear variations in movement as the basis of this learning and result in a greater acquisition of motor skills and better rates of motor learning in athletes (Davids, Araújo, Vilar, Renshaw & Pinder, 2013; Schöllhorn, Hegen & Davids, 2012; Schöllhorn, Michelbrink, Welminski & Davids, 2009), such as differential learning (interventions that added variability to movement) and contextual interference (variability due to changes in the conditions of the task).
1.1 Differential Learning
A learning theory that opposes the repetition of movement based on an ideal movement pattern is the differential learning approach proposed by Schöllhorn and its colleagues mainly characterized by taking advantage, of the fluctuations that occur on
8
human movement. This approach suggests that skill acquisition should be done without movement repetitions and without corrections during the performance of a motor task (Schöllhorn, Mayer-Kress, Newell & Michelbrink, 2009).
This approach does not identify key task constraints and tries to involve maximum variability between single repetitions (Schöllhorn, Beckmann, Janssen & Drepper, 2010). “The fluctuations in the learner’s subsystems itself are exploited during learning, because they have the potential to destabilize the whole system. This destabilization process can lead to an instability that has the advantage of requiring less energy in order to achieve a new stable state of organization for the learner” (Schöllhorn, Hegen & Davids, 2012), thus instigating a self-organizing process that forces the system to rearrange itself constantly and emerge with more effective/stable movement pattern. So, movement variability during learning allows the learner to search, find, and subsequently refine appropriate solutions for different performance contexts.
Schöllhorn and his colleagues (Schöllhorn, Hegen & Davids, 2012) suggest that “due to the nonlinearity of motor learning it seems reasonable to expedite training with stochastic perturbations. Monotonous repetitions of movements should be abandoned whereas large variations should be produced in order to initiate self-organization so that a more effective and more efficient learning process can be designed”.
1.2 Contextual Interference
Contextual interference is a term which was coined by W.F. Battig (Battig, 1972) and it covers interferences occurring between data concerning execution of tasks in the process of task learning. It was later the focus of the famous study by J.B. Shea & R.L. Morgan (Shea & Morgan, 1979). They first reported that high rather than low amounts of contextual interference benefit motor skill learning and most researchers have investigated this learning approach by comparing fixed amounts of contextual interference so they can control where the results come from (Barreiros, Figueiredo & Godinho, 2007). Varying amounts of contextual interference exist on a continuum, with blocked scheduling serving as the low end of the contextual interference continuum and random scheduling serving as the high end.
Porter and Magill (Porter & Magill, 2010) conducted experiments in their study where they wanted to investigate if systematically increasing contextual interference during practice would benefit skill learning more than fixed amounts of low and high contextual interference and whether these expected benefits were limited to tasks controlled by the same or different generalized motor programs. The results show that a
9
practice schedule offering systematic increases in contextual interference facilitates skill learning and these learning benefits generalize to tasks controlled by the same and different generalized motor programs. So, “by changing the practice environment in conjunction with skill being developed, the learner is challenged at the appropriate level in the initial stage of learning, which appears to be a key feature for improving skill” (Porter & Magill, 2010).
1.3 An Adaptive Process of Motor Learning
Motor learning models need to explain not only the pattern formation, but also how they transform into new ones, i.e., adaptation. Motor skills are goal directed by nature and most have an environmental goal. What this means is there occurs an intrinsic coupling between the performance of motor skill and the environment.
Adaptation is the process of change by which an organism or species becomes better suited to its environment and it occurs when changes in the environment perturb the system, challenging its stability and causing uncertainties. Having this in mind, Tani and his colleagues (Tani, Corrêa, Basso, Benda, Ugrinowitsch & Choshi, 2014), developed a model where the skill structure is assumed to be organized hierarchically at macroscopic (overall pattern that emerges from the interaction of the components that is understood to be responsible for making actions consistent) and microscopic levels (the components themselves).
This process is based on two phases; the stabilization and the adaptation phase. In the stabilization process, the formation of the spatiotemporal pattern of motor skill (macrostructure) based on negative feedback mechanism occurs, i.e., a process of diminishing error and inconsistencies in the motor responses that implies a functional patterning. Once stabilized, motor skills can be perturbed and thus, adaptation, is one in which “new skills are formed from the reorganization of those already acquired to respond to those uncertainties. It might occur in three ways: (a) through the flexibility of the system, i.e. alteration of parameters (parametric adaptation); (b) by reorganization of the skill structure (structural adaptation); and (c) through the emergence of a completely new structure (self-organizational adaptation)” (Tani, Corrêa, Basso, Benda, Ugrinowitsch & Choshi, 2014) (please see figure 1).
This approach has influenced some research in the recent years (Barrosa, Tani & Corrêa, 2017; Pinheiro, Marques, Tani & Corrêa, 2015) and the main hypothesis investigated in these studies was that different conditions of practice could lead the human
10
movement system to different levels of functional stabilization and, consequently, types of adaptation.
Figure 1. Illustration of (A) adaptive process of motor learning involving the phases of functional stabilization (structure/pattern formation) and adaptation (structure/pattern reorganization), and (B) hierarchical organization of a motor skill control structure (a
soccer shot example) [13].
Functional stabilization implies formation of a structure, so one could wonder how could we promote this adaptation. The structure formed should reflect the two basic characteristics of motor skills based on performance, consistency and variability. “Consistency is necessary to achieve goals with reliability and variability is fundamental to cope with environmental instability” (Tani, Corrêa, Basso, Benda, Ugrinowitsch & Choshi, 2014).
11
So, the aim of this study was to compare a training approach efficiency without addition of variability in the practice conditions, with an approach with contextual interference in young football players
2. Method
2.1 ParticipantsThe participants were 12 young athletes (for calculation of sample size GPower software was used and the results are in the annexes) of football between the ages of 11-12 years, which will be divided randomly by two groups, one control (n = 6) and one experimental (n = 6). The data collection, for the convenience of the author of this study, was carried out in a team from the district of Lisboa because they are athletes in the club with which the author works and easily has access and control over the training process. The exclusion criteria of the data collection process were: (i) absence in any of the three moments of evaluation and (ii) lack of attendance to more than 3 training sessions. This study was approved by the Ethics Council for Research of the Faculty of Human Kinetics.
2.2 Task
The control group perform a task with no contextual interference, starts with a pass and then the receiver (i.e., ball carrier) has to decide to which side to turn and shot the goal while in the meantime the defender pressures him; he can only leave his position after the opponent receives the ball (please see figure 2).
The experimental group perform a task with contextual interference where the receiver (i.e., ball carrier) starting position was manipulated at every attempt, with a change of the angle between the ball carrier, the defender and the goal (please see figure 3).
12
Figure 2. Task for the control group with no contextual interference
Figure 3. Task for the experimental group with contextual interference
2.3 Procedures
The study ran for 6 weeks, where both groups performed two training sessions per week (30 minutes early from normal training time) for a total of 12 sessions. Three evaluations were made, one initial, one intermediate and one final (please see appendix 1). The evaluations were carried out two weeks apart.
The control group performed exercises with no variability in practice conditions (please see figure 2) and the experimental group performs exercises with contextual interference by series (please see figure 3) in which ordered series of repetitions of the different variants of the motor task are done. Both groups had the same amount of
13
repetitions during the practice sessions. The practice conditions previously described for both groups are the independent variables of this study.
For both groups the data collection was done through notational analysis where it was made a record of occurrences of the following events that will be the dependent variables of the study: i) to which side the attacker turned after receiving the pass; ii) the ball carrier behavior after turning to the goal – divided into 4 variables: did the attacker shot through the left side of the defender, the right side, was he tackled or did he dribbled the defender; iii) the ball goes towards the goal or not. This sum a total of 6 dependent variables under analysis on this study. The task used to collect the data was figure 3 and every participant had one shot per position (7) from right to left. For this purpose, video images were recorded. These images are stored and encoded in a database and the only person with access to them is the lead author of the study.
2.4 Statistical Analysis
For the analysis of the above described variables it will be used statistical descriptive of the occurrences and to compare the groups will be used the non-parametric statistical test Chi-square (χ2).
3. Results
The results are display divided by sub-sections, which represent each one of the six dependent variables under analysis. For the sake of a better understanding of the results, the variables “attacker shot through the left side of the defender” and “attacker shot through the right side of the defender” were combined into one sub-section.
3.1 Rotation after receiving the ball
Figure 4. Number of times the attacker rotated left after receiving the ball – 2nd position
S um of oc curr enc es 0 1 2 3 4 5 6
Initial Intermediate Final
14
On every position but one, both groups did not display a clear pattern. The exception was on the 2nd position (i.e., right side of the performance area), where the experimental group displayed a noticeable improvement on the number of times the ball carrier rotated left after receiving the ball (please see figure 4). On the contrary, the control group remained constant across the three assessment moments.
3.2 Attacker shot through the left or right side of the defender
Both groups adapted sideways to the position they shot from, i.e., if the position where the ball received was on the right side of the performance field the players shoot often to the left side of the defender. The experimental group increase the frequency of shooting through the left side of the defender, whereas the control increase the frequency from the initial from the intermediate assessment but remain constant from the intermediate to the final assessment (please see figure 5). On the contrary and if the position where the ball was received was on the left side of the performance field the players shoot often to the right side of the defender. A tendency that increase along the three assessment moments (please see figure 6). For the remaining positions, there is no clear pattern. 0 1 2 3 4 5 6
Initial Intermediate Final
Experimental Control 0 1 2 3 4 5 6
Initial Intermediate Final
Experimental Control
Figure 5. Ball shot through the left side of the defender - 1st position
Figure 6. Ball shot through the right side of the defender – 5th position S um of oc curr enc es S um of oc curr enc es
15 3.3 Attacker was tackled by the defender
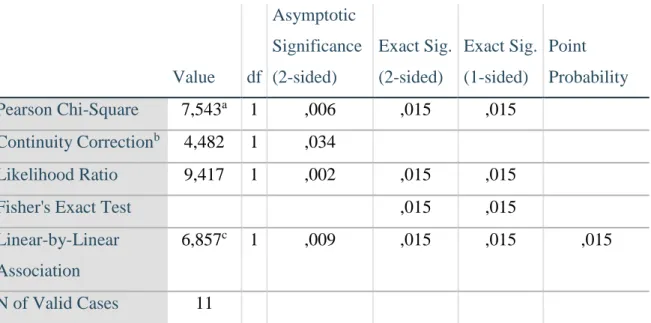
Table 1. Chi-square tests for "attacker was tackled by the defender" for the 3rd position on the intermediate evaluation
Regarding the number of occurrences that the defender took advantage over the ball carrier, on figure 7 and 8 display a tendency where both groups get tackled less by the defender as time goes by but only on positions 1 and 5. Also, we can see a major improvement in the experimental group for the first position (please see figure 7). The only statistically significance difference between
Value df Asymptotic Significance (2-sided) Exact Sig. (2-sided) Exact Sig. (1-sided) Point Probability Pearson Chi-Square 7,543a 1 ,006 ,015 ,015 Continuity Correctionb 4,482 1 ,034 Likelihood Ratio 9,417 1 ,002 ,015 ,015
Fisher's Exact Test ,015 ,015
Linear-by-Linear Association
6,857c 1 ,009 ,015 ,015 ,015
N of Valid Cases 11
a. 4 cells (100,0%) have expected count less than 5. The minimum expected count is 1,82. b. Computed only for a 2x2 table
c. The standardized statistic is -2,619.
0 1 2 3 4 5 6
Initial Intermediate Final
Experimental Control
Figure 8. Defender tackled the attacker – 5th position
S um of oc curr enc es S um of oc curr enc es 0 1 2 3 4 5 6
Initial Intermediate Final
Experimental Control
16
the control and experimental group was for the 3rd position on the intermediate evaluation (please see table 1).
3.4 Attacker dribbled the defender
Across all attempts, the control group only managed to dribble the defender 5 times, while the experimental group dribbled 15 times (for more information see appendix 6). No tendency stood-out from the descriptive of the occorences and the non-parametric statistical test Chi-square (χ2).
3.5 Ball goes towards the target
Table 2. Chi-square tests for "shot hit the target" for the 3rd position on the intermediate evaluation Value df Asymptotic Significance (2-sided) Exact Sig. (2-sided) Exact Sig. (1-sided) Point Probability Pearson Chi-Square 5,238a 1 ,022 ,061 ,045 Continuity Correctionb 2,753 1 ,097 Likelihood Ratio 6,782 1 ,009 ,061 ,045
Fisher's Exact Test ,061 ,045
Linear-by-Linear Association
4,762c 1 ,029 ,061 ,045 ,045
N of Valid Cases 11
a. 4 cells (100,0%) have expected count less than 5. The minimum expected count is 1,82. b. Computed only for a 2x2 table
c. The standardized statistic is 2,182.
As shown above, (please see table 2) being statistically significant, we can see that there is a difference between groups meaning that the experimental group hit the target often than the control group for the 3rd position on the intermediate evaluation.
17
4. Discussion
The discussion is divided by sub-sections, which represent each one of the six dependent variables under analysis. For the sake of a better understanding of the results, the variables “attacker shot through the left side of the defender” and “attacker shot through the right side of the defender” were combined into one sub-section.
4.1 Rotation after receiving the ball
On the 2nd position (right side of the performance field) the experimental group displayed a noticeable improvement on the number of times the ball carrier rotated left after receiving the ball indicating that perhaps the ball carrier tried to take advantage of the wide angle they have to shot at goal if rotate this way.
4.2 Attacker shot through the left or right side of the defender
Concerning which side of the defender the ball carrier shoot at goal, we can say that both groups displayed some adaptation. However, we would like to emphasize that the experimental group on the right side of the performance field (i.e., position 1) displayed an increase tendency for shooting through the left side of the defender along the three evaluation moments. This may suggest an adaptive behavior for the experimental group exploring the side that the defender left available.
4.3 Attacker was tackled by the defender
Along the three evaluation moments the ball carrier from both groups were tackled less by the defender, which means that both groups improved their technical skills regarding ball possession. But the results unravel that the experimental group improvement was statistically significant regarding the control group, which means that ball carrier from the experimental group display a higher improvement of the technical skills to avoid the defender than the ball carrier from the control group. This result reinforces that adding variability to the practice led to technical improvements (Davids, Araújo, Vilar, Renshaw & Pinder, 2013; Schöllhorn, Michelbrink, Welminski & Davids, 2009).
4.4 Attacker dribbled the defender
Dribbling your opponent is one of the most difficult technical skills in football. So it was expected that not only the defender could easily tackle the ball carrier if they took too long to shot. So it seems natural that the results indicate that only a small difference between the experimental group and the control group was observed (although the experimental group managed to dribble the defender 15 times more across all attempts).
18 4.5 Ball goes towards the target
The experimental group hit the target significantly more than the control group on the 3rd position on the intermediate evaluation suggesting that the experimental group had, to some extent, a steeper learning curve. Again, and in some sense similar to what data suggest for the skill of shooting to one of the sides of the defender, and displayed for the improvements of ball carrier technical skills to avoid the defender, this result reinforces that adding variability to practice may lead to improve technical skills in young football players.
5. Conclusions
In summary, the results of this study allow us to suggest that adding variability to practice may lead to technical improvements in young football players and that variability in practice may potentialize an adaptive behavior to the environment.
As a recommendation for future studies, and in order to improve the accuracy in the data collection, this procedure should be made outside of the normal practice hours and some extra time should be accounted for (repetitions if the pass does not go perfectly for example). Additionally and without disturbing the possibility of performing a longitudinal study, the sample size should be increased. Finally ensure the accuracy of task constraints such as player’s initial position on each trial as well as ball path and velocity (perhaps using a radar to measure ball velocity).
6. References
Tani, C., Basso, L., Ugrinowitsch, R. & Choshi, K. (2014). An Adaptive Process Model of Motor Learning: Insights for the Teaching of Motor Skills. Nonlinear
Dynamics, Psychology, and Life Sciences, 18, 47-65.
Button, C., Lee, C-Y.M., Dutt-Mazumder, A., Tan, W. K. C. & Chow, J-Y. (2012). Empirical Investigations of Nonlinear Motor Learning. The Open Sports Sciences
Journal, 5, 49-58.
Davids, K., Araújo, D., Vilar, L., Renshaw, I. & Pinder, R. (2013). An Ecological Dynamics Approach to Skill Acquisition: Implications for Development of Talent. Sport Talent Development & Excellence, 5, 21-34.
Schöllhorn, W. I., Hegen, P. & Davids, K. (2012). The Nonlinear Nature of Learning - A Differential Learning Approach. The Open Sports Sciences Journal, 5, 100-112. Schöllhorn, W. I., Michelbrink, M., Welminski, D. & Davids, D. (2009). Perspectives on
cognition and action in sport. In: Araujo, D., Ripoll, H. & Raab, M., Eds. Hauppauge, NY: Nova Science, 59-73.
19
Schöllhorn, W. I., Mayer-Kress, G., Newell, K.M. & Michelbrink, M. (2009). Time scales of adaptive behavior and motor learning in the presence of stochastic perturbations. Human Movement Science, 28, 319-33.
Schöllhorn, W. I., Beckmann, H., Janssen, D., & Drepper, J. (2010). Stochastic Perturbations in Athletics Field Events Enhance Skill Acquisition. Motor Learning in Practice. A constraints-led approach, London: Routledge, 69-82. Battig, W.F. (1972). Intratask interference as a source of facilitation in transfer and
retention. In: Thompson R.F. & Voss J.F. Topics in learning and performance. Academic Press, New York, 131-159.
Shea, J.B. & Morgan, R.L. (1979). Contextual interference effects on the acquisition, retention and transfer of a motor skill. Journal of Experimental Psychology:
Learning, Memory, and Cognition, 5, 179-87.
Barreiros, J., Figueiredo, T., & Godinho, M. (2007). The contextual interference effect in applied settings. European Physical Education Review, 3, 195–208.
Porter, J.M. & Magill, R.A. (2010). Systematically increasing contextual interference is beneficial for learning sport skills. Journal of Sports Sciences, 28, 1277-1285. Tani, G., Corrêa, U.C., Basso, L., Benda, R.N., Ugrinowitsch, H. & Choshi, K. (2014).
An Adaptive Process Model of Motor Learning: Insights for the Teaching of Motor Skills. Nonlinear Dynamics, Psychology, and Life Sciences, 18, 47-65. Barrosa, J.A.d.C., Tani, G. & Corrêa U.C. (2017). Effects of practice schedule and task
specificity on the adaptive process of motor learning. Human Movement Science, 55, 196-210.
Pinheiro, J.P., Marques, P.G., Tani, G., & Corrêa, U.C. (2015). Diversification of motor skills rely upon an optimal amount of variability of perceptive and motor task demands. Adaptive Behavior, 23, 83–96.
20
Appendix
Appendix 1 - Scheduling
Appendix 2 – Rotation after receiving the ball
0 1 2 3 4 5 6
Initial Intermediate Final
Experimental Control
Where did the attacker turn after receiving the ball - 1st position (number of times that he rotated to the left)
0 1 2 3 4 5 6
Initial Intermediate Final
Experimental Control
Where did the attacker turn after receiving the ball – 3rd position (number of times that he rotated to the left)
21 0 1 2 3 4 5 6
Initial Intermediate Final
Experimental Control
Where did the attacker turn after receiving the ball – 4th position (number of times that he rotated to the left)
0 1 2 3 4 5 6
Initial Intermediate Final
Experimental Control
Where did the attacker turn after receiving the ball – 5th position (number of times that he rotated to the left)
0 1 2 3 4 5 6
Initial Intermediate Final
Experimental Control
Where did the attacker turn after receiving the ball – 6th position (number of times that he rotated to the left)
0 1 2 3 4 5 6
Initial Intermediate Final
Experimental Control
Where did the striker turn after receiving the ball – 7th position (number of times that he rotated to the left)
22
Group * Rotation_I1 Crosstabulation
Count Rotation_I1 Total Left Right Group Control 3 3 6 Experimental 2 4 6 Total 5 7 12 Chi-Square Tests Value df Asymptotic Significance (2-sided) Exact Sig. (2-sided) Exact Sig. (1-sided) Point Probability Pearson Chi-Square ,343a 1 ,558 1,000 ,500 Continuity Correctionb ,000 1 1,000 Likelihood Ratio ,345 1 ,557 1,000 ,500
Fisher's Exact Test 1,000 ,500
Linear-by-Linear Association
,314c 1 ,575 1,000 ,500 ,379
N of Valid Cases 12
a. 4 cells (100,0%) have expected count less than 5. The minimum expected count is 2,50.
b. Computed only for a 2x2 table c. The standardized statistic is ,561.
Group * Rotation_M1 Crosstabulation
Count Rotation_M1 Total Left Right Group Control 2 3 5 Experimental 3 3 6 Total 5 6 11 Chi-Square Tests Value df Asymptotic Significance (2-sided) Exact Sig. (2-sided) Exact Sig. (1-sided) Point Probability Pearson Chi-Square ,110a 1 ,740 1,000 ,608 Continuity Correctionb ,000 1 1,000
23
Likelihood Ratio ,110 1 ,740 1,000 ,608
Fisher's Exact Test 1,000 ,608
Linear-by-Linear Association
,100c 1 ,752 1,000 ,608 ,433
N of Valid Cases 11
a. 4 cells (100,0%) have expected count less than 5. The minimum expected count is 2,27.
b. Computed only for a 2x2 table c. The standardized statistic is -,316.
Chi-Square Tests Value df Asymptotic Significance (2-sided) Exact Sig. (2-sided) Exact Sig. (1-sided) Point Probability Pearson Chi-Square ,110a 1 ,740 1,000 ,608 Continuity Correctionb ,000 1 1,000 Likelihood Ratio ,110 1 ,740 1,000 ,608
Fisher's Exact Test 1,000 ,608
Linear-by-Linear Association
,100c 1 ,752 1,000 ,608 ,433
N of Valid Cases 11
a. 4 cells (100,0%) have expected count less than 5. The minimum expected count is 2,27.
b. Computed only for a 2x2 table c. The standardized statistic is ,316.
Group * Rotation_I2 Crosstabulation
Count Rotation_I2 Total Left Right Group Control 3 3 6 Experimental 4 2 6
Group * Rotation_F1 Crosstabulation
Count Rotation_F1 Total Left Right Group Control 3 2 5 Experimental 3 3 6 Total 6 5 11
24 Total 7 5 12 Chi-Square Tests Value df Asymptotic Significance (2-sided) Exact Sig. (2-sided) Exact Sig. (1-sided) Point Probability Pearson Chi-Square ,343a 1 ,558 1,000 ,500 Continuity Correctionb ,000 1 1,000 Likelihood Ratio ,345 1 ,557 1,000 ,500
Fisher's Exact Test 1,000 ,500
Linear-by-Linear Association
,314c 1 ,575 1,000 ,500 ,379
N of Valid Cases 12
a. 4 cells (100,0%) have expected count less than 5. The minimum expected count is 2,50.
b. Computed only for a 2x2 table c. The standardized statistic is -,561.
Group * Rotation_M2 Crosstabulation
Count Rotation_M2 Total Left Right Group Control 2 3 5 Experimental 1 5 6 Total 3 8 11 Chi-Square Tests Value df Asymptotic Significance (2-sided) Exact Sig. (2-sided) Exact Sig. (1-sided) Point Probability Pearson Chi-Square ,749a 1 ,387 ,545 ,424 Continuity Correctionb ,034 1 ,853 Likelihood Ratio ,754 1 ,385 ,545 ,424
Fisher's Exact Test ,545 ,424
Linear-by-Linear Association
,681c 1 ,409 ,545 ,424 ,364
25
a. 4 cells (100,0%) have expected count less than 5. The minimum expected count is 1,36.
b. Computed only for a 2x2 table c. The standardized statistic is ,825.
Group * Rotation_F2 Crosstabulation
Count Rotation_F2 Total Left Right Group Control 2 3 5 Experimental 3 3 6 Total 5 6 11 Chi-Square Tests Value df Asymptotic Significance (2-sided) Exact Sig. (2-sided) Exact Sig. (1-sided) Point Probability Pearson Chi-Square ,110a 1 ,740 1,000 ,608 Continuity Correctionb ,000 1 1,000 Likelihood Ratio ,110 1 ,740 1,000 ,608
Fisher's Exact Test 1,000 ,608
Linear-by-Linear Association
,100c 1 ,752 1,000 ,608 ,433
N of Valid Cases 11
a. 4 cells (100,0%) have expected count less than 5. The minimum expected count is 2,27.
b. Computed only for a 2x2 table c. The standardized statistic is -,316.
Group * Rotation_I3 Crosstabulation
Count Rotation_I3 Total Left Right Group Control 2 4 6 Experimental 3 3 6 Total 5 7 12
26 Chi-Square Tests Value df Asymptotic Significance (2-sided) Exact Sig. (2-sided) Exact Sig. (1-sided) Point Probability Pearson Chi-Square ,343a 1 ,558 1,000 ,500 Continuity Correctionb ,000 1 1,000 Likelihood Ratio ,345 1 ,557 1,000 ,500
Fisher's Exact Test 1,000 ,500
Linear-by-Linear Association
,314c 1 ,575 1,000 ,500 ,379
N of Valid Cases 12
a. 4 cells (100,0%) have expected count less than 5. The minimum expected count is 2,50.
b. Computed only for a 2x2 table c. The standardized statistic is -,561.
Group * Rotation_M3 Crosstabulation
Count Rotation_M3 Total Left Right Group Control 3 2 5 Experimental 4 2 6 Total 7 4 11 Chi-Square Tests Value df Asymptotic Significance (2-sided) Exact Sig. (2-sided) Exact Sig. (1-sided) Point Probability Pearson Chi-Square ,052a 1 ,819 1,000 ,652 Continuity Correctionb ,000 1 1,000 Likelihood Ratio ,052 1 ,819 1,000 ,652
Fisher's Exact Test 1,000 ,652
Linear-by-Linear Association
,048c 1 ,827 1,000 ,652 ,455
N of Valid Cases 11
a. 4 cells (100,0%) have expected count less than 5. The minimum expected count is 1,82.
b. Computed only for a 2x2 table c. The standardized statistic is -,218.
27
Group * Rotation_F3 Crosstabulation
Count Rotation_F3 Total Left Right Group Control 4 1 5 Experimental 4 2 6 Total 8 3 11 Chi-Square Tests Value df Asymptotic Significance (2-sided) Exact Sig. (2-sided) Exact Sig. (1-sided) Point Probability Pearson Chi-Square ,244a 1 ,621 1,000 ,576 Continuity Correctionb ,000 1 1,000 Likelihood Ratio ,249 1 ,618 1,000 ,576
Fisher's Exact Test 1,000 ,576
Linear-by-Linear Association
,222c 1 ,637 1,000 ,576 ,455
N of Valid Cases 11
a. 4 cells (100,0%) have expected count less than 5. The minimum expected count is 1,36.
b. Computed only for a 2x2 table c. The standardized statistic is ,471.
Group * Rotation_I4 Crosstabulation
Count Rotation_I4 Total Left Right Group Control 3 3 6 Experimental 5 1 6 Total 8 4 12 Chi-Square Tests Value df Asymptotic Significance (2-sided) Exact Sig. (2-sided) Exact Sig. (1-sided) Point Probability Pearson Chi-Square 1,500a 1 ,221 ,545 ,273 Continuity Correctionb ,375 1 ,540
28
Likelihood Ratio 1,552 1 ,213 ,545 ,273
Fisher's Exact Test ,545 ,273
Linear-by-Linear Association
1,375c 1 ,241 ,545 ,273 ,242
N of Valid Cases 12
a. 4 cells (100,0%) have expected count less than 5. The minimum expected count is 2,00.
b. Computed only for a 2x2 table c. The standardized statistic is -1,173.
Group * Rotation_M4 Crosstabulation
Count Rotation_M4 Total Left Right Group Control 4 1 5 Experimental 4 2 6 Total 8 3 11 Chi-Square Tests Value df Asymptotic Significance (2-sided) Exact Sig. (2-sided) Exact Sig. (1-sided) Point Probability Pearson Chi-Square ,244a 1 ,621 1,000 ,576 Continuity Correctionb ,000 1 1,000 Likelihood Ratio ,249 1 ,618 1,000 ,576
Fisher's Exact Test 1,000 ,576
Linear-by-Linear Association
,222c 1 ,637 1,000 ,576 ,455
N of Valid Cases 11
a. 4 cells (100,0%) have expected count less than 5. The minimum expected count is 1,36.
b. Computed only for a 2x2 table c. The standardized statistic is ,471.
Group * Rotation_F4 Crosstabulation
Count
Rotation_F4
Total Left Right
29 Experimental 5 1 6 Total 9 2 11 Chi-Square Tests Value df Asymptotic Significance (2-sided) Exact Sig. (2-sided) Exact Sig. (1-sided) Point Probability Pearson Chi-Square ,020a 1 ,887 1,000 ,727 Continuity Correctionb ,000 1 1,000 Likelihood Ratio ,020 1 ,887 1,000 ,727
Fisher's Exact Test 1,000 ,727
Linear-by-Linear Association
,019c 1 ,892 1,000 ,727 ,545
N of Valid Cases 11
a. 4 cells (100,0%) have expected count less than 5. The minimum expected count is ,91.
b. Computed only for a 2x2 table c. The standardized statistic is -,136.
Group * Rotation_I5 Crosstabulation
Count Rotation_I5 Total Left Right Group Control 4 2 6 Experimental 4 2 6 Total 8 4 12 Chi-Square Tests Value df Asymptotic Significance (2-sided) Exact Sig. (2-sided) Exact Sig. (1-sided) Point Probability Pearson Chi-Square ,000a 1 1,000 1,000 ,727 Continuity Correctionb ,000 1 1,000 Likelihood Ratio ,000 1 1,000 1,000 ,727
Fisher's Exact Test 1,000 ,727
Linear-by-Linear Association
30
N of Valid Cases 12
a. 4 cells (100,0%) have expected count less than 5. The minimum expected count is 2,00.
b. Computed only for a 2x2 table c. The standardized statistic is ,000.
Group * Rotation_M5 Crosstabulation
Count Rotation_M5 Total Left Right Group Control 3 2 5 Experimental 5 1 6 Total 8 3 11 Chi-Square Tests Value df Asymptotic Significance (2-sided) Exact Sig. (2-sided) Exact Sig. (1-sided) Point Probability Pearson Chi-Square ,749a 1 ,387 ,545 ,424 Continuity Correctionb ,034 1 ,853 Likelihood Ratio ,754 1 ,385 ,545 ,424
Fisher's Exact Test ,545 ,424
Linear-by-Linear Association
,681c 1 ,409 ,545 ,424 ,364
N of Valid Cases 11
a. 4 cells (100,0%) have expected count less than 5. The minimum expected count is 1,36.
b. Computed only for a 2x2 table c. The standardized statistic is -,825.
Group * Rotation_F5 Crosstabulation
Count Rotation_F5 Total Left Right Group Control 3 2 5 Experimental 5 1 6 Total 8 3 11
31 Chi-Square Tests Value df Asymptotic Significance (2-sided) Exact Sig. (2-sided) Exact Sig. (1-sided) Point Probability Pearson Chi-Square ,749a 1 ,387 ,545 ,424 Continuity Correctionb ,034 1 ,853 Likelihood Ratio ,754 1 ,385 ,545 ,424
Fisher's Exact Test ,545 ,424
Linear-by-Linear Association
,681c 1 ,409 ,545 ,424 ,364
N of Valid Cases 11
a. 4 cells (100,0%) have expected count less than 5. The minimum expected count is 1,36.
b. Computed only for a 2x2 table c. The standardized statistic is -,825.
Group * Rotation_I6 Crosstabulation
Count Rotation_I6 Total Left Right Group Control 3 3 6 Experimental 6 0 6 Total 9 3 12 Chi-Square Tests Value df Asymptotic Significance (2-sided) Exact Sig. (2-sided) Exact Sig. (1-sided) Point Probability Pearson Chi-Square 4,000a 1 ,046 ,182 ,091 Continuity Correctionb 1,778 1 ,182 Likelihood Ratio 5,178 1 ,023 ,182 ,091
Fisher's Exact Test ,182 ,091
Linear-by-Linear Association
3,667c 1 ,056 ,182 ,091 ,091
32
a. 4 cells (100,0%) have expected count less than 5. The minimum expected count is 1,50.
b. Computed only for a 2x2 table c. The standardized statistic is -1,915.
Group * Rotation_M6 Crosstabulation
Count Rotation_M6 Total Left Right Group Control 2 3 5 Experimental 5 1 6 Total 7 4 11 Chi-Square Tests Value df Asymptotic Significance (2-sided) Exact Sig. (2-sided) Exact Sig. (1-sided) Point Probability Pearson Chi-Square 2,213a 1 ,137 ,242 ,197 Continuity Correctionb ,737 1 ,391 Likelihood Ratio 2,284 1 ,131 ,242 ,197
Fisher's Exact Test ,242 ,197
Linear-by-Linear Association
2,012c 1 ,156 ,242 ,197 ,182
N of Valid Cases 11
a. 4 cells (100,0%) have expected count less than 5. The minimum expected count is 1,82.
b. Computed only for a 2x2 table c. The standardized statistic is -1,418.
Group * Rotation_F6 Crosstabulation
Count Rotation_F6 Total Left Right Group Control 4 1 5 Experimental 5 1 6 Total 9 2 11
33 Chi-Square Tests Value df Asymptotic Significance (2-sided) Exact Sig. (2-sided) Exact Sig. (1-sided) Point Probability Pearson Chi-Square ,020a 1 ,887 1,000 ,727 Continuity Correctionb ,000 1 1,000 Likelihood Ratio ,020 1 ,887 1,000 ,727
Fisher's Exact Test 1,000 ,727
Linear-by-Linear Association
,019c 1 ,892 1,000 ,727 ,545
N of Valid Cases 11
a. 4 cells (100,0%) have expected count less than 5. The minimum expected count is ,91.
b. Computed only for a 2x2 table c. The standardized statistic is -,136.
Group * Rotation_I7 Crosstabulation
Count Rotation_I7 Total Left Right Group Control 3 3 6 Experimental 5 1 6 Total 8 4 12 Chi-Square Tests Value df Asymptotic Significance (2-sided) Exact Sig. (2-sided) Exact Sig. (1-sided) Point Probability Pearson Chi-Square 1,500a 1 ,221 ,545 ,273 Continuity Correctionb ,375 1 ,540 Likelihood Ratio 1,552 1 ,213 ,545 ,273
Fisher's Exact Test ,545 ,273
Linear-by-Linear Association
1,375c 1 ,241 ,545 ,273 ,242
34
a. 4 cells (100,0%) have expected count less than 5. The minimum expected count is 2,00.
b. Computed only for a 2x2 table c. The standardized statistic is -1,173.
Group * Rotation_M7 Crosstabulation
Count Rotation_M7 Total Left Right Group Control 4 1 5 Experimental 6 0 6 Total 10 1 11 Chi-Square Tests Value df Asymptotic Significance (2-sided) Exact Sig. (2-sided) Exact Sig. (1-sided) Point Probability Pearson Chi-Square 1,320a 1 ,251 ,455 ,455 Continuity Correctionb ,009 1 ,924 Likelihood Ratio 1,698 1 ,193 ,455 ,455
Fisher's Exact Test ,455 ,455
Linear-by-Linear Association
1,200c 1 ,273 ,455 ,455 ,455
N of Valid Cases 11
a. 3 cells (75,0%) have expected count less than 5. The minimum expected count is ,45.
b. Computed only for a 2x2 table c. The standardized statistic is -1,095.
Group * Rotation_F7 Crosstabulation
Count Rotation_F7 Total Left Right Group Control 4 1 5 Experimental 6 0 6 Total 10 1 11
35 Chi-Square Tests Value df Asymptotic Significance (2-sided) Exact Sig. (2-sided) Exact Sig. (1-sided) Point Probability Pearson Chi-Square 1,320a 1 ,251 ,455 ,455 Continuity Correctionb ,009 1 ,924 Likelihood Ratio 1,698 1 ,193 ,455 ,455
Fisher's Exact Test ,455 ,455
Linear-by-Linear Association
1,200c 1 ,273 ,455 ,455 ,455
N of Valid Cases 11
a. 3 cells (75,0%) have expected count less than 5. The minimum expected count is ,45.
b. Computed only for a 2x2 table c. The standardized statistic is -1,095.
Appendix 3 – Attacker shot through the left of the defender
0 1 2 3 4 5 6
Initial Intermediate Final
Experimental Control
Ball passed through the left of the defender – 2nd position 0 1 2 3 4 5 6
Initial Intermediate Final
Experimental Control
Ball passed through the left of the defender – 3rd position
36 0 1 2 3 4 5 6
Initial Intermediate Final
Experimental Control
Ball passed through the left of the defender – 4th position 0 1 2 3 4 5 6
Initial Intermediate Final
Experimental Control
Ball passed through the left of the defender – 5th position 0 1 2 3 4 5 6
Initial Intermediate Final
Experimental Control
Ball passed through the left of the defender – 6th position 0 1 2 3 4 5 6
Initial Intermediate Final
Experimental Control
Ball passed through the left of the defender – 7th position
37
Group * Left_I1 Crosstabulation
Count Left_I1 Total No Yes Group Control 5 1 6 Experimental 6 0 6 Total 11 1 12 Chi-Square Tests Value df Asymptotic Significance (2-sided) Exact Sig. (2-sided) Exact Sig. (1-sided) Point Probability Pearson Chi-Square 1,091a 1 ,296 1,000 ,500 Continuity Correctionb ,000 1 1,000 Likelihood Ratio 1,477 1 ,224 1,000 ,500
Fisher's Exact Test 1,000 ,500
Linear-by-Linear Association
1,000c 1 ,317 1,000 ,500 ,500
N of Valid Cases 12
a. 2 cells (50,0%) have expected count less than 5. The minimum expected count is ,50.
b. Computed only for a 2x2 table c. The standardized statistic is -1,000.
Group * Left_M1 Crosstabulation
Count Left_M1 Total No Yes Group Control 3 2 5 Experimental 4 2 6 Total 7 4 11 Chi-Square Tests Value df Asymptotic Significance (2-sided) Exact Sig. (2-sided) Exact Sig. (1-sided) Point Probability Pearson Chi-Square ,052a 1 ,819 1,000 ,652
38
Continuity Correctionb ,000 1 1,000
Likelihood Ratio ,052 1 ,819 1,000 ,652
Fisher's Exact Test 1,000 ,652
Linear-by-Linear Association
,048c 1 ,827 1,000 ,652 ,455
N of Valid Cases 11
a. 4 cells (100,0%) have expected count less than 5. The minimum expected count is 1,82.
b. Computed only for a 2x2 table c. The standardized statistic is -,218.
Group * Left_F1 Crosstabulation
Count Left_F1 Total No Yes Group Control 3 2 5 Experimental 3 3 6 Total 6 5 11 Chi-Square Tests Value df Asymptotic Significance (2-sided) Exact Sig. (2-sided) Exact Sig. (1-sided) Point Probability Pearson Chi-Square ,110a 1 ,740 1,000 ,608 Continuity Correctionb ,000 1 1,000 Likelihood Ratio ,110 1 ,740 1,000 ,608
Fisher's Exact Test 1,000 ,608
Linear-by-Linear Association
,100c 1 ,752 1,000 ,608 ,433
N of Valid Cases 11
a. 4 cells (100,0%) have expected count less than 5. The minimum expected count is 2,27.
b. Computed only for a 2x2 table c. The standardized statistic is ,316.
Group * Left_I2 Crosstabulation
Count
Left_I2
Total
39 Group Control 4 2 6 Experimental 2 4 6 Total 6 6 12 Chi-Square Tests Value df Asymptotic Significance (2-sided) Exact Sig. (2-sided) Exact Sig. (1-sided) Point Probability Pearson Chi-Square 1,333a 1 ,248 ,567 ,284 Continuity Correctionb ,333 1 ,564 Likelihood Ratio 1,359 1 ,244 ,567 ,284
Fisher's Exact Test ,567 ,284
Linear-by-Linear Association
1,222c 1 ,269 ,567 ,284 ,244
N of Valid Cases 12
a. 4 cells (100,0%) have expected count less than 5. The minimum expected count is 3,00.
b. Computed only for a 2x2 table c. The standardized statistic is 1,106.
Group * Left_M2 Crosstabulation
Count Left_M2 Total No Yes Group Control 3 2 5 Experimental 5 1 6 Total 8 3 11 Chi-Square Tests Value df Asymptotic Significance (2-sided) Exact Sig. (2-sided) Exact Sig. (1-sided) Point Probability Pearson Chi-Square ,749a 1 ,387 ,545 ,424 Continuity Correctionb ,034 1 ,853 Likelihood Ratio ,754 1 ,385 ,545 ,424
Fisher's Exact Test ,545 ,424
Linear-by-Linear Association
,681c 1 ,409 ,545 ,424 ,364
40
a. 4 cells (100,0%) have expected count less than 5. The minimum expected count is 1,36.
b. Computed only for a 2x2 table c. The standardized statistic is -,825.
Group * Left_F2 Crosstabulation
Count Left_F2 Total No Yes Group Control 5 0 5 Experimental 4 2 6 Total 9 2 11 Chi-Square Tests Value df Asymptotic Significance (2-sided) Exact Sig. (2-sided) Exact Sig. (1-sided) Point Probability Pearson Chi-Square 2,037a 1 ,154 ,455 ,273 Continuity Correctionb ,413 1 ,521 Likelihood Ratio 2,793 1 ,095 ,455 ,273
Fisher's Exact Test ,455 ,273
Linear-by-Linear Association
1,852c 1 ,174 ,455 ,273 ,273
N of Valid Cases 11
a. 4 cells (100,0%) have expected count less than 5. The minimum expected count is ,91.
b. Computed only for a 2x2 table c. The standardized statistic is 1,361.
Group * Left_I3 Crosstabulation
Count Left_I3 Total No Yes Group Control 4 2 6 Experimental 5 1 6 Total 9 3 12 Chi-Square Tests
41 Value df Asymptotic Significance (2-sided) Exact Sig. (2-sided) Exact Sig. (1-sided) Point Probability Pearson Chi-Square ,444a 1 ,505 1,000 ,500 Continuity Correctionb ,000 1 1,000 Likelihood Ratio ,451 1 ,502 1,000 ,500
Fisher's Exact Test 1,000 ,500
Linear-by-Linear Association
,407c 1 ,523 1,000 ,500 ,409
N of Valid Cases 12
a. 4 cells (100,0%) have expected count less than 5. The minimum expected count is 1,50.
b. Computed only for a 2x2 table c. The standardized statistic is -,638.
Group * Left_M3 Crosstabulation
Count Left_M3 Total No Yes Group Control 4 1 5 Experimental 4 2 6 Total 8 3 11 Chi-Square Tests Value df Asymptotic Significance (2-sided) Exact Sig. (2-sided) Exact Sig. (1-sided) Point Probability Pearson Chi-Square ,244a 1 ,621 1,000 ,576 Continuity Correctionb ,000 1 1,000 Likelihood Ratio ,249 1 ,618 1,000 ,576
Fisher's Exact Test 1,000 ,576
Linear-by-Linear Association
,222c 1 ,637 1,000 ,576 ,455
N of Valid Cases 11
a. 4 cells (100,0%) have expected count less than 5. The minimum expected count is 1,36.
b. Computed only for a 2x2 table c. The standardized statistic is ,471.
42
Group * Left_F3 Crosstabulation
Count Left_F3 Total No Yes Group Control 4 1 5 Experimental 5 1 6 Total 9 2 11 Chi-Square Tests Value df Asymptotic Significance (2-sided) Exact Sig. (2-sided) Exact Sig. (1-sided) Point Probability Pearson Chi-Square ,020a 1 ,887 1,000 ,727 Continuity Correctionb ,000 1 1,000 Likelihood Ratio ,020 1 ,887 1,000 ,727
Fisher's Exact Test 1,000 ,727
Linear-by-Linear Association
,019c 1 ,892 1,000 ,727 ,545
N of Valid Cases 11
a. 4 cells (100,0%) have expected count less than 5. The minimum expected count is ,91.
b. Computed only for a 2x2 table c. The standardized statistic is -,136.
Group * Left_I4 Crosstabulation
Count Left_I4 Total No Yes Group Control 4 2 6 Experimental 4 2 6 Total 8 4 12 Chi-Square Tests Value df Asymptotic Significance (2-sided) Exact Sig. (2-sided) Exact Sig. (1-sided) Point Probability Pearson Chi-Square ,000a 1 1,000 1,000 ,727 Continuity Correctionb ,000 1 1,000 Likelihood Ratio ,000 1 1,000 1,000 ,727
43
Fisher's Exact Test 1,000 ,727
Linear-by-Linear Association
,000c 1 1,000 1,000 ,727 ,455
N of Valid Cases 12
a. 4 cells (100,0%) have expected count less than 5. The minimum expected count is 2,00.
b. Computed only for a 2x2 table c. The standardized statistic is ,000.
Group * Left_M4 Crosstabulation
Count Left_M4 Total No Yes Group Control 4 1 5 Experimental 6 0 6 Total 10 1 11 Chi-Square Tests Value df Asymptotic Significance (2-sided) Exact Sig. (2-sided) Exact Sig. (1-sided) Point Probability Pearson Chi-Square 1,320a 1 ,251 ,455 ,455 Continuity Correctionb ,009 1 ,924 Likelihood Ratio 1,698 1 ,193 ,455 ,455
Fisher's Exact Test ,455 ,455
Linear-by-Linear Association
1,200c 1 ,273 ,455 ,455 ,455
N of Valid Cases 11
a. 3 cells (75,0%) have expected count less than 5. The minimum expected count is ,45.
b. Computed only for a 2x2 table c. The standardized statistic is -1,095.
Group * Left_F4 Crosstabulation
Count Left_F4 Total No Yes Group Control 4 1 5 Experimental 3 3 6 Total 7 4 11
44 Chi-Square Tests Value df Asymptotic Significance (2-sided) Exact Sig. (2-sided) Exact Sig. (1-sided) Point Probability Pearson Chi-Square 1,061a 1 ,303 ,545 ,348 Continuity Correctionb ,160 1 ,689 Likelihood Ratio 1,099 1 ,295 ,545 ,348
Fisher's Exact Test ,545 ,348
Linear-by-Linear Association
,964c 1 ,326 ,545 ,348 ,303
N of Valid Cases 11
a. 4 cells (100,0%) have expected count less than 5. The minimum expected count is 1,82.
b. Computed only for a 2x2 table c. The standardized statistic is ,982.
Group * Left_I5 Crosstabulation
Count Left_I5 Total No Yes Group Control 6 0 6 Experimental 4 2 6 Total 10 2 12 Chi-Square Tests Value df Asymptotic Significance (2-sided) Exact Sig. (2-sided) Exact Sig. (1-sided) Point Probability Pearson Chi-Square 2,400a 1 ,121 ,455 ,227 Continuity Correctionb ,600 1 ,439 Likelihood Ratio 3,175 1 ,075 ,455 ,227
Fisher's Exact Test ,455 ,227
Linear-by-Linear Association
2,200c 1 ,138 ,455 ,227 ,227
N of Valid Cases 12
a. 2 cells (50,0%) have expected count less than 5. The minimum expected count is 1,00.
b. Computed only for a 2x2 table c. The standardized statistic is 1,483.
45
Group * Left_M5 Crosstabulation
Count Left_M5 Total No Yes Group Control 3 2 5 Experimental 4 2 6 Total 7 4 11 Chi-Square Tests Value df Asymptotic Significance (2-sided) Exact Sig. (2-sided) Exact Sig. (1-sided) Point Probability Pearson Chi-Square ,052a 1 ,819 1,000 ,652 Continuity Correctionb ,000 1 1,000 Likelihood Ratio ,052 1 ,819 1,000 ,652
Fisher's Exact Test 1,000 ,652
Linear-by-Linear Association
,048c 1 ,827 1,000 ,652 ,455
N of Valid Cases 11
a. 4 cells (100,0%) have expected count less than 5. The minimum expected count is 1,82.
b. Computed only for a 2x2 table c. The standardized statistic is -,218.
Group * Left_F5 Crosstabulation
Count Left_F5 Total No Yes Group Control 5 0 5 Experimental 3 3 6 Total 8 3 11 Chi-Square Tests Value df Asymptotic Significance (2-sided) Exact Sig. (2-sided) Exact Sig. (1-sided) Point Probability Pearson Chi-Square 3,438a 1 ,064 ,182 ,121 Continuity Correctionb 1,379 1 ,240
46
Likelihood Ratio 4,573 1 ,032 ,182 ,121
Fisher's Exact Test ,182 ,121
Linear-by-Linear Association
3,125c 1 ,077 ,182 ,121 ,121
N of Valid Cases 11
a. 4 cells (100,0%) have expected count less than 5. The minimum expected count is 1,36.
b. Computed only for a 2x2 table c. The standardized statistic is 1,768.
Group * Left_I6 Crosstabulation
Count Left_I6 Total No Yes Group Control 3 3 6 Experimental 3 3 6 Total 6 6 12 Chi-Square Tests Value df Asymptotic Significance (2-sided) Exact Sig. (2-sided) Exact Sig. (1-sided) Point Probability Pearson Chi-Square ,000a 1 1,000 1,000 ,716 Continuity Correctionb ,000 1 1,000 Likelihood Ratio ,000 1 1,000 1,000 ,716
Fisher's Exact Test 1,000 ,716
Linear-by-Linear Association
,000c 1 1,000 1,000 ,716 ,433
N of Valid Cases 12
a. 4 cells (100,0%) have expected count less than 5. The minimum expected count is 3,00.
b. Computed only for a 2x2 table c. The standardized statistic is ,000.
47
Group * Left_M6 Crosstabulation
Count Left_M6 Total No Yes Group Control 4 1 5 Experimental 5 1 6 Total 9 2 11 Chi-Square Tests Value df Asymptotic Significance (2-sided) Exact Sig. (2-sided) Exact Sig. (1-sided) Point Probability Pearson Chi-Square ,020a 1 ,887 1,000 ,727 Continuity Correctionb ,000 1 1,000 Likelihood Ratio ,020 1 ,887 1,000 ,727
Fisher's Exact Test 1,000 ,727
Linear-by-Linear Association
,019c 1 ,892 1,000 ,727 ,545
N of Valid Cases 11
a. 4 cells (100,0%) have expected count less than 5. The minimum expected count is ,91.
b. Computed only for a 2x2 table c. The standardized statistic is -,136.
Group * Left_F6 Crosstabulation
Count Left_F6 Total No Yes Group Control 4 1 5 Experimental 5 1 6 Total 9 2 11 Chi-Square Tests Value df Asymptotic Significance (2-sided) Exact Sig. (2-sided) Exact Sig. (1-sided) Point Probability
48 Pearson Chi-Square ,020a 1 ,887 1,000 ,727 Continuity Correctionb ,000 1 1,000 Likelihood Ratio ,020 1 ,887 1,000 ,727
Fisher's Exact Test 1,000 ,727
Linear-by-Linear Association
,019c 1 ,892 1,000 ,727 ,545
N of Valid Cases 11
a. 4 cells (100,0%) have expected count less than 5. The minimum expected count is ,91.
b. Computed only for a 2x2 table c. The standardized statistic is -,136.
Group * Left_I7 Crosstabulation
Count Left_I7 Total No Yes Group Control 4 2 6 Experimental 5 1 6 Total 9 3 12 Chi-Square Tests Value df Asymptotic Significance (2-sided) Exact Sig. (2-sided) Exact Sig. (1-sided) Point Probability Pearson Chi-Square ,444a 1 ,505 1,000 ,500 Continuity Correctionb ,000 1 1,000 Likelihood Ratio ,451 1 ,502 1,000 ,500
Fisher's Exact Test 1,000 ,500
Linear-by-Linear Association
,407c 1 ,523 1,000 ,500 ,409
N of Valid Cases 12
a. 4 cells (100,0%) have expected count less than 5. The minimum expected count is 1,50.
b. Computed only for a 2x2 table c. The standardized statistic is -,638.
49
Group * Left_M7 Crosstabulation
Count Left_M7 Total No Yes Group Control 4 1 5 Experimental 6 0 6 Total 10 1 11 Chi-Square Tests Value df Asymptotic Significance (2-sided) Exact Sig. (2-sided) Exact Sig. (1-sided) Point Probability Pearson Chi-Square 1,320a 1 ,251 ,455 ,455 Continuity Correctionb ,009 1 ,924 Likelihood Ratio 1,698 1 ,193 ,455 ,455
Fisher's Exact Test ,455 ,455
Linear-by-Linear Association
1,200c 1 ,273 ,455 ,455 ,455
N of Valid Cases 11
a. 3 cells (75,0%) have expected count less than 5. The minimum expected count is ,45.
b. Computed only for a 2x2 table c. The standardized statistic is -1,095.
Group * Left_F7 Crosstabulation
Count Left_F7 Total No Yes Group Control 5 0 5 Experimental 5 1 6 Total 10 1 11 Chi-Square Tests Value df Asymptotic Significance (2-sided) Exact Sig. (2-sided) Exact Sig. (1-sided) Point Probability
50 Pearson Chi-Square ,917a 1 ,338 1,000 ,545 Continuity Correctionb ,000 1 1,000 Likelihood Ratio 1,295 1 ,255 1,000 ,545
Fisher's Exact Test 1,000 ,545
Linear-by-Linear Association
,833c 1 ,361 1,000 ,545 ,545
N of Valid Cases 11
a. 3 cells (75,0%) have expected count less than 5. The minimum expected count is ,45.
b. Computed only for a 2x2 table c. The standardized statistic is ,913.
Appendix 4 – Attacker shot through the right of the defender
0 1 2 3 4 5 6
Initial Intermediate Final
Experimental Control
Ball passed through the right of the defender - 1st position 0 1 2 3 4 5 6
Initial Intermediate Final
Experimental Control
Ball passed through the right of the defender – 2nd position
51 0 1 2 3 4 5 6
Initial Intermediate Final
Experimental Control
Ball passed through the right of the defender – 3rd position 0 1 2 3 4 5 6
Initial Intermediate Final
Experimental Control
Ball passed through the right of the defender – 4th position 0 1 2 3 4 5 6
Initial Intermediate Final
Experimental Control
Ball passed through the right of the defender – 6th position
Ball passed through the right of the defender – 7th position 0 1 2 3 4 5 6
Initial Intermediate Final
52
Group * Right_I1 Crosstabulation
Count Right_I1 Total No Group Control 6 6 Experimental 6 6 Total 12 12 Chi-Square Tests Value Pearson Chi-Square .a N of Valid Cases 12 a. No statistics are computed because Right_I1 is a constant.
Group * Right_M1 Crosstabulation
Count Right_M1 Total No Yes Group Control 4 1 5 Experimental 4 2 6 Total 8 3 11 Chi-Square Tests Value df Asymptotic Significance (2-sided) Exact Sig. (2-sided) Exact Sig. (1-sided) Point Probability Pearson Chi-Square ,244a 1 ,621 1,000 ,576 Continuity Correctionb ,000 1 1,000 Likelihood Ratio ,249 1 ,618 1,000 ,576
Fisher's Exact Test 1,000 ,576
Linear-by-Linear Association
,222c 1 ,637 1,000 ,576 ,455
N of Valid Cases 11
a. 4 cells (100,0%) have expected count less than 5. The minimum expected count is 1,36.
b. Computed only for a 2x2 table c. The standardized statistic is ,471.
53
Group * Right_F1 Crosstabulation
Count Right_F1 Total No Yes Group Control 4 1 5 Experimental 5 1 6 Total 9 2 11 Chi-Square Tests Value df Asymptotic Significance (2-sided) Exact Sig. (2-sided) Exact Sig. (1-sided) Point Probability Pearson Chi-Square ,020a 1 ,887 1,000 ,727 Continuity Correctionb ,000 1 1,000 Likelihood Ratio ,020 1 ,887 1,000 ,727
Fisher's Exact Test 1,000 ,727
Linear-by-Linear Association
,019c 1 ,892 1,000 ,727 ,545
N of Valid Cases 11
a. 4 cells (100,0%) have expected count less than 5. The minimum expected count is ,91.
b. Computed only for a 2x2 table c. The standardized statistic is -,136.
Group * Right_I2 Crosstabulation
Count Right_I2 Total No Yes Group Control 5 1 6 Experimental 5 1 6 Total 10 2 12 Chi-Square Tests Value df Asymptotic Significance (2-sided) Exact Sig. (2-sided) Exact Sig. (1-sided) Point Probability Pearson Chi-Square ,000a 1 1,000 1,000 ,773 Continuity Correctionb ,000 1 1,000
54
Likelihood Ratio ,000 1 1,000 1,000 ,773
Fisher's Exact Test 1,000 ,773
Linear-by-Linear Association
,000c 1 1,000 1,000 ,773 ,545
N of Valid Cases 12
a. 2 cells (50,0%) have expected count less than 5. The minimum expected count is 1,00.
b. Computed only for a 2x2 table c. The standardized statistic is ,000.
Group * Right_M2 Crosstabulation
Count Right_M2 Total No Yes Group Control 5 0 5 Experimental 5 1 6 Total 10 1 11 Chi-Square Tests Value df Asymptotic Significance (2-sided) Exact Sig. (2-sided) Exact Sig. (1-sided) Point Probability Pearson Chi-Square ,917a 1 ,338 1,000 ,545 Continuity Correctionb ,000 1 1,000 Likelihood Ratio 1,295 1 ,255 1,000 ,545
Fisher's Exact Test 1,000 ,545
Linear-by-Linear Association
,833c 1 ,361 1,000 ,545 ,545
N of Valid Cases 11
a. 3 cells (75,0%) have expected count less than 5. The minimum expected count is ,45.
b. Computed only for a 2x2 table c. The standardized statistic is ,913.
55
Group * Right_F2 Crosstabulation
Count Right_F2 Total No Yes Group Control 5 0 5 Experimental 5 1 6 Total 10 1 11 Chi-Square Tests Value df Asymptotic Significance (2-sided) Exact Sig. (2-sided) Exact Sig. (1-sided) Point Probability Pearson Chi-Square ,917a 1 ,338 1,000 ,545 Continuity Correctionb ,000 1 1,000 Likelihood Ratio 1,295 1 ,255 1,000 ,545
Fisher's Exact Test 1,000 ,545
Linear-by-Linear Association
,833c 1 ,361 1,000 ,545 ,545
N of Valid Cases 11
a. 3 cells (75,0%) have expected count less than 5. The minimum expected count is ,45.
b. Computed only for a 2x2 table c. The standardized statistic is ,913.
Group * Right_I3 Crosstabulation
Count Right_I3 Total No Yes Group Control 5 1 6 Experimental 5 1 6 Total 10 2 12 Chi-Square Tests Value df Asymptotic Significance (2-sided) Exact Sig. (2-sided) Exact Sig. (1-sided) Point Probability Pearson Chi-Square ,000a 1 1,000 1,000 ,773 Continuity Correctionb ,000 1 1,000 Likelihood Ratio ,000 1 1,000 1,000 ,773