University of Brasília - UnB
Master’s Program in Nanoscience and Nanobiotechnology (PPGNANO)
Kissia Batista Ferreira
Correlation of the size of self-assembled silver nanoparticles
in phosphate glasses modified with aluminum or zinc oxides in
RAMAN-SERS signal aiming application as early
biomarker-related disease diagnosis
Masters Dissertation
BRASÍLIA 2020
ii Kissia Batista Ferreira
Correlation of the size of self-assembled silver nanoparticles
in phosphate glasses modified with aluminum or zinc oxides in
RAMAN-SERS signal aiming application as early
biomarker-related disease diagnosis
Master’s Dissertation presented to the Graduate Program in Nanoscience and
Nanobiotechnology of the Biology Institute of University of Brasília as a partial requirement for obtaining the title of Master in Nanoscience and Nanobiotechnology.
Supervisor: Prof. Dr. Juliano Alexandre Chaker
BRASÍLIA 2020
iv
To my mother and father, Terezinha and Eduardo, I
dedicate this work, who encouraged me in the search of
knowledge.
v
Acknowledgments
This scientific journey I experienced was full of surprises, challenges, struggles and realizations. I feel grateful for everyone who have been a part of this moment, that helped and guided me until now. Here, I thank everyone who made it possible.
I want to thank Prof. Juliano Alexandre Chaker, for always believing in my potential and making me become better. His guidance and friendship were crucial to develop my maturity in the scientific field and support me through challenges. To my lab friends Prof. Marcelo Henrique Sousa, who assisted me many times and always amused me with his good spirit, making my workdays funnier, and to Atailson, Mac-Kedson and Eliane for always sharing their knowledges and contributing to my personal development.
I thank Prof. Ricardo Schneider for providing all the support needed with my samples and their supplies. I deeply thank Prof. Sebastião da Silva and his students Isis and Alexandre, who instructed and assisted me countless times during all my analysis with Raman that, without them, my work could not have been completed. My gratitude to Prof. Jorlândio Felix for his knowledge and assistance with my SERS analysis.
I thank Felipe de Almeida, who encouraged and pushed me to never give up, while providing me strength and carefulness (which I deeply needed to keep my sanity). His contribution was more than what I could ever ask. I Thank all my beautiful friends Angela, Marina, Eduardo, Leonardo, Lucas, Lúcio e Roberto, for always believing, cheering for me and watching me at difficult moments.
I specially thank my family, who provided me always with the best, assisting me in all necessary aspect. To Jessica Ferreira, my precious sister, who always believed in me, and helped me with her encouragement. To Terezinha Ferreira, my mother, who gave my freedom to pursue my dreams and engage in the science field, while supporting me with my expenses. To Eduardo Ferreira, my father, who introduced me to science and always inspired me to seek knowledge.
I thank all the collaborators and friends, here not mentioned, who indirectly helped me within this past two years.
vi
“Ignorance more frequently begets confidence than does
knowledge: it is those who know little, and not those who
know much, who so positively assert that this or that
problem will never be solved by science.”
Charles Drawing
“Nothing in life is to be feared, it is only to be understood.
Now is the time to understand more, so that we may fear
less.”
vii
Abstract
FERREIRA, K. B.. Correlation of the size of self-assembled silver nanoparticles in phosphate glasses modified with aluminum or zinc oxides in RAMAN-SERS signal aiming application as early biomarker-related disease diagnosis. Masters Dissertation – Graduate Program in Nanoscience and Nanobiotechnology, University of Brasília, Brasília, 2020
The use of nanostructured SERS substrates in biomolecule detection has gaining considerable attention as they offer great sensitivity and specificity, displaying a very promising application for early disease diagnoses of biomolecule-related (expressing biomolecules) diseases. Albeit the innumerous substrates developed with this objective, many lacks in few crucial criterions for clinical or point-of-care applications such as sensitivity, resistivity, high spectroscopic performance and reproducibility. This is a consequence of the difficulty in getting strong Raman signal enhancements with simple approaches, either by substrate structuring or analysis methods. Under those circumstances, it was investigated in this work the potential of two borophosphate glass compositions (modified with aluminum or zinc oxides) as nanostructured SERS substrates for detecting a standard dye molecule and, subsequently, their potential in detecting biomolecules under different conditions. And, since the method for acquiring metallic nanoparticles can influence in SERS effect (in respect of particle size, morphology and arrangement) and in biomolecule interaction (due to the surface characteristics of the nanoparticle) the influence of the nanoparticle obtainment process in the vitreous structure was also investigated. Thus, this study also involved the portrait of the main differences between the glass compositions, when thermally treated at different times for the growth of nanoparticles (bottom-up), accessing the structural conformation of the glassy network, the general thermal stability of the matrices and the morphology of the nanoparticles for each treatment time. It was observed that thermal treatment changes insignificantly the glass matrices, but the difference in thermal stability and degree of packing among them results in different nanoparticles growth rates, culminating in distinct nanoparticle size distributions between same treatment time. SERS effect was achieved for the spherical-like nanoparticles at similar sizes, estimated to be between 34 to 38 nm, and with an enhancement factor greater than the overall found in the literature, having maximum value calculated in 1.7x10⁷
for aluminum and 7x10⁶ for zinc modified glass. Biomolecule detection showed to be promising
with PCA analysis, but biomolecule adsorption and respective SERS analysis must be further investigated.
viii
Resumo
FERREIRA, K. B.. Correlação do tamanho de nanopartículas de prata automontadas em vidros fosfatados modificados com óxidos de alumínio ou zinco no sinal RAMAN-SERS visando aplicação como diagnóstico precoce de doenças relacionadas a biomarcadores. Dissertação de Mestrado - Programa de Pós-Graduação em Nanociência e Nanobiotecnologia, Universidade de Brasília, Brasília, 2020.
O uso de substratos SERS nanoestruturados na detecção de biomoléculas vem ganhando considerável atenção por oferecerem grande sensibilidade e especificidade, mostrando uma aplicação bastante promissora para diagnósticos precoces de doenças relacionadas a (que expressem) biomoléculas. Apesar dos inúmeros substratos desenvolvidos com esse objetivo, muitos carecem de alguns critérios cruciais para aplicações clínicas ou no local de atendimento, como sensibilidade, resistividade, alto desempenho espectroscópico e reprodutibilidade. Isso é consequência da dificuldade de obter fortes melhorias de sinal Raman com abordagens simples, seja pela estruturação do substrato ou pelos métodos de análise. Nessas circunstâncias, investigou-se neste trabalho o potencial de duas composições de vidro borofosfato, modificadas com óxidos de alumínio ou zinco e dopadas com prata, como substratos SERS para detecção de uma molécula de corante padrão e, posteriormente, o potencial desses na detecção de biomoléculas em diferentes condições. E, como o método para aquisição de nanopartículas metálicas pode influenciar no efeito SERS (em relação ao tamanho, morfologia e arranjo das partículas) e na interação com biomoléculas (devido às características superficiais da nanopartícula), foi examinada também a influência do processo de obtenção de nanopartículas de prata na estrutura vítrea. Assim, este estudo envolveu também o retrato das principais diferenças entre as composições vítreas, quando tratados termicamente em diferentes tempos para o crescimento de nanopartículas (bottom-up), acessando a conformação estrutural da rede vítrea, a estabilidade térmica geral das matrizes e morfologia das nanopartículas para cada tempo de tratamento. Observou-se que o tratamento térmico altera de forma insignificante as matrizes de vidro, mas a diferença de estabilidade térmica e grau de empacotamento entre elas resulta em diferentes taxas de crescimento de nanopartículas, culminando em distribuições distintas de tamanho de nanopartículas no mesmo tempo de tratamento. O efeito SERS foi alcançado para as nanopartículas esféricas em tamanhos semelhantes, estimadas entre 34 e 38 nm, e com um fator de aumento maior que o padrão alcançado na literatura, tendo valor máximo calculado em 1,7x10⁷ para alumínio e 7x10⁶ para vidro
modificado com zinco). A detecção de biomoléculas mostrou-se promissora com a análise de PCA, mas a adsorção de biomoléculas e a respectiva análise SERS devem ser mais investigadas.
ix
Figures List
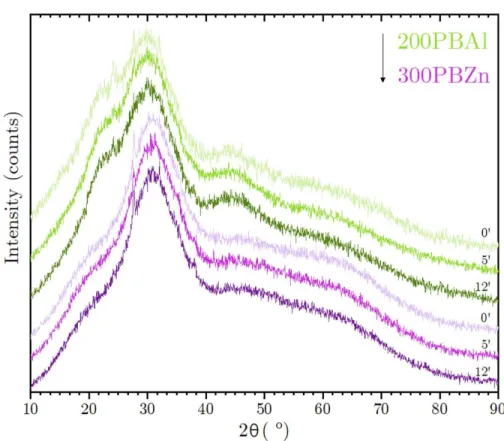
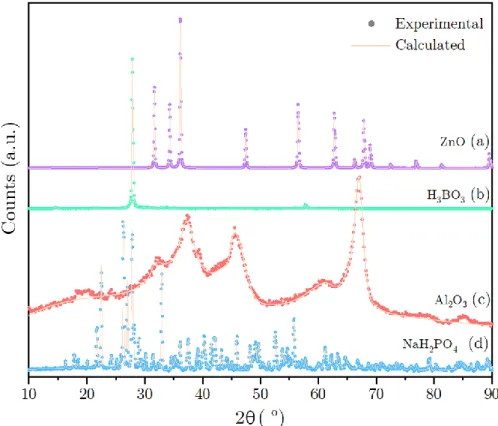
Figure 1. Cancers rate incidence (per 100,000) of prostate, breast, colon (male/female) and lung (male/female) from 2000 to 2016 in Brazil... 2 Figure 2. XRD patterns of 200PBAl (green) and 300PBZn (purple) glasses without thermal treatment (0 min.) and with annealing time of 5 and 12 min. each. ... 32 Figure 3. Rietveld refinement of the glass precursors. Calculated (straight light orange line) and experimental ZnO (purple dots), H3BO3 (green dots), Al2O3 (orange dots) and NaH2PO4 (blue dots) diffraction
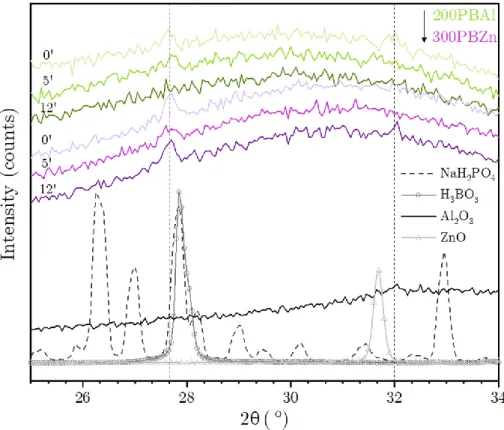
patterns. ... 33 Figure 4. Experimental diffractogram of borophosphate glass samples (uppermost) modified with aluminum (green shades) or zinc (purple shades) and glass precursors (NaH2PO4 – dash line, H3BO3 –
straight line with open circle, Al2O3 – straight line and ZnO – straight line open triangle). .... 34
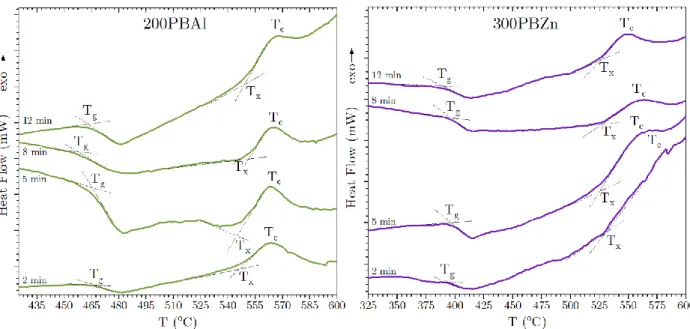
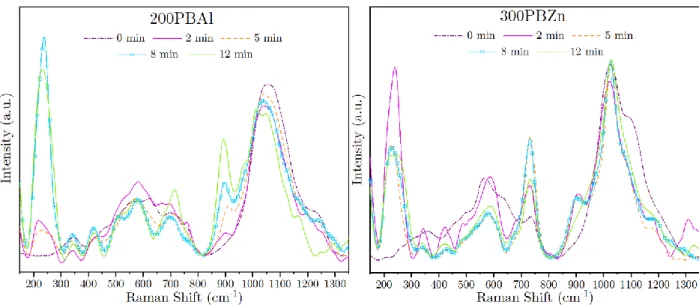
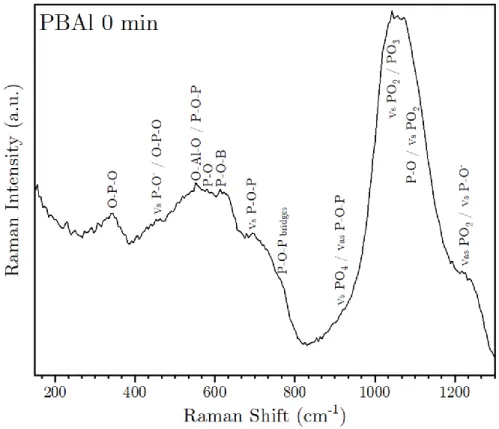
Figure 5. DSC analysis of borophosphate glass matrices modified with aluminum (left, green lines) and zinc (right, purple lines), in their respective annealing times (2 – 12 min). ... 36 Figure 6. Raman spectra (532nm) of borophosphate glass samples modified with aluminum (left) and zinc oxides (right) without thermal treatment (0 min.) and with annealing time of 2, 5, 8 and 12 min. each ... 41 Figure 7. Raman spectra (532nm) of borophosphate glass samples modified with aluminum without thermal treatment. ... 42 Figure 8. Raman spectra (532nm) of 200PBAl (left) and 300PBZn (right) at their corresponding annealing times (a-0 min, b-2 min, c-5 min, d-8 min and e-12 min). ... 45 Figure 9. Raman spectra (532nm) of borophosphate glass samples modified with zinc without thermal treatment. ... 46 Figure 10. FTIR spectra of borophosphate glass matrices modified with aluminum without thermal treatment. ... 49 Figure 11. FTIR spectra of borophosphate glass matrices modified with zinc without thermal treatment. 50 Figure 12. FTIR spectra of borophosphate glass matrices modified with aluminum (green) and zinc (purple) without thermal treatment and with thermal treatment with 12 min ... 51
x
Figure 13. SEM images of borophosphate glasses modified with aluminum (left side) annealed for 2 (a), 5 (b), 8 (c) and 12 (d) minutes and zinc (right side) annealed for 2 (e), 8 (f) and 12 (g and h) min. ... 57 Figure 14. Normality plot of silver nanoparticle grown on both glass sample matrices (modified with aluminum or zinc), thermally treated for 8 min. Normally (200PBAl8) and non-normally (300PBZn8) distributed data are compared. ... 58 Figure 15. Boxplot of non-normal size distribution of nanoparticles grown on both glass matrices (modified with aluminum or zinc), at their respective thermal treatment time (2-12 min.). The dispersity of NP size (dot scores) has fixed values for “x” axis, varying only in the “y” axis. ... 59 Figure 16. Linear regression fit (red line) of the nanoparticle size median, grown on borophosphate matrices containing aluminum (triangle) or zinc (circle), with their corresponding line equation, Pearson’s correlation coefficient (r), and R2 of each. The calculated NP size for HT time of 5min. for both
lattices are represented as the blue star, with estimated standard deviation. ... 61 Figure 17. Nanoparticle size distribution of 200PBAl and 300PBZn borophosphate glass sample sets at their respective thermal treatment time (2-12 min). ... 63 Figure 18. UV-VIS absorbance spectra of 200PBAl (uppermost) and 300PBZn (lowermost), at their respective thermal treatment time (in minutes)... 66 Figure 19. Normal Raman spectra of Cresyl Violet Perchlorate (CVP) at 1 M concentration and its enhanced Raman spectra obtained by SERS using 200PBAl set (a) and 300PBZn set (b) at the different annealing times (2 – 12 min), with concentrations of 10-6 M, 10-3 M and 1 M (front to back). (c)
Chemical structure of CVP. ... 70 Figure 20. SERS of the CVP most intense peak (around ~592 cm-1), at concentrations 1, 1x10⁻³ and 1x10⁻⁶
mol.l-1, obtained on 200PBAl (a) and 300PBZN (b) vitreous substrates, at their respective
annealing times (in minutes). The scales were adapted (cut) for better visualization. ... 71 Figure 21. SERS substrate enhancement factor of borophosphate glasses modified with aluminum (a) and zinc (b) according to their respective heat treatment time (in minutes) and CVP concentration (1, 1x10⁻³ and 1x10⁻⁶ mol.l-1) compared to normal Raman signal of CVP obtained at 1 M. The
scales were adapted (cut) for better visualization. ... 73 Figure 22. (a) Normal Raman spectra of BSA (i), 200PBAl8 (ii) and 300PBZn5 (iv), with respective BSA SERS spectra collected on 200PBAl5 (iii) and 300PBZn (v). (b) Normal Raman spectra of anti-HIL2 (i) and carbonate buffer (ii), with respective SERS spectra collected on 200PBAl8 (iii) and 300PBZn5 (iv). SERS were collected subsequent ambient drying. ... 75
xi
Figure 23. PCA scatter plot of BSA samples and vitreous substrates. (light purple) 200PBAl8, (dark purple) 300PBZn5, (light blue) BSA Raman spectra, (light pink) 300PBZn5 + BSA 1µM, (red) 300PBZn + BSA 1nM, (light green) 200PBAl8 + BSA 1µM ... 77 Figure 24. PCA scatter plot of anti-HIL2 samples and vitreous substrates. (light purple) - HIL2 antigen, (light green) anti-HIL2, (orange) antibody + antigen, (light pink) 200PBAl8 + anti-HIL2 2.5 pg.ml-1, (light yellow) 200PBZn5 + anti-HIL2 pg.ml-1, (red) 200PBAl8, (dark blue)
300PBZn5, (light blue) carbonate buffer, (dark purple) microscope slide. ... 78 Figure 25. SERS of immobilized anti-HIL2 incubated with HIL2 antigen at 12.5 pg.ml-1 (a), 50 pg.ml-1 (b),
200 pg.ml-1 (c), 800 pg.ml-1 (d), anti-HIL2 antibody (e) and normal Raman of anti-HIL2 (f). . 80
Figure 26. PCA scatter plot of immobilized anti-HIL2 antibody (on 300PBZn5) conjugated with HIL2 at different concentrations. (light blue) HIL2 12.5 pg.ml-1, (dark blue) HIL2 50 pg.ml-1, (light
green) HIL2 200 pg.ml-1, (dark green) HIL2 800 pg.ml-1, (light yellow) immobilized
xii
Tables List
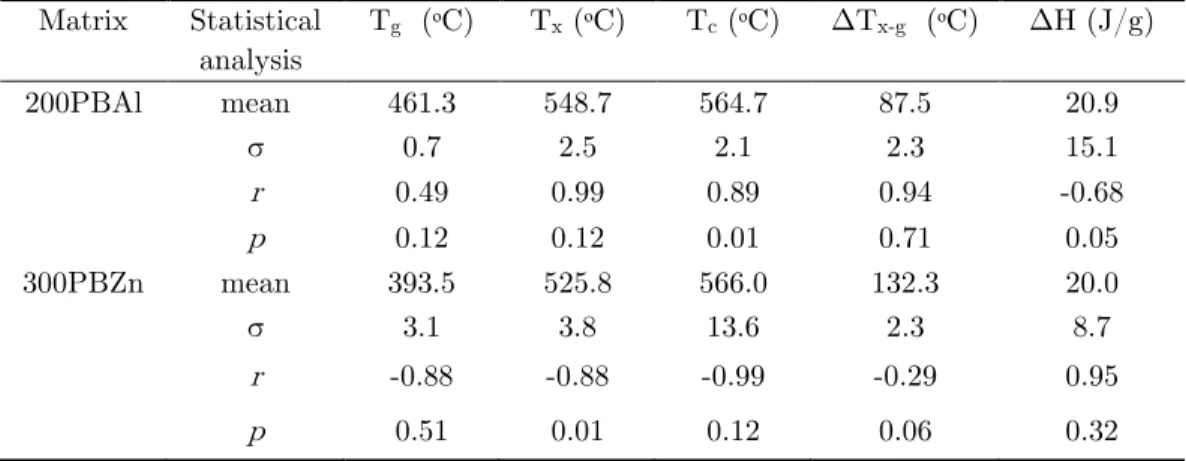
Table 1. Pre-established vitreous samples and their corresponding annealing times used during the study, with their respective characterization and application studies. ... 20 Table 2. Crystalline phase of borophosphate glass precursors identified by Rietveld refinement. ... 35 Table 3. Glass transition temperature (Tg), degradation onset (Tx), degradation peak (Tc), glass stability (ΔT) and peak enthalpy for vitreous matrices treated with Al or Zn and their respective heat treatment time (in minutes). ... 37 Table 4. Descriptive statistics (mean, standard deviation (σ), Pearson’s coefficient(r)) of borophosphate glass matrices glass transition (Tg), crystallization onset (Tx) and peak (Tc), thermal stability (ΔTx-g)
temperatures and enthalpic variation (ΔH)... 39 Table 5. Vibrational modes presented on Raman spectra of borophosphate glasses modified with aluminum or zinc. ... 47 Table 6. Vibrational modes presented on FTIR spectra of borophosphate glasses containing aluminum or zinc oxide ... 53 Table 7. Descriptive statistics (median, percentiles, median absolute deviation (MAD), quartile-based coefficient of variation (QCV), mean and standard deviation) of nanoparticle size and distance of the respective heat treatment time of each glass matrix, with calculated values for samples treated for 5 min. ... 59 Table 8. SERS substrate enhancement factor of each thermal treatment time calculated at three different CVP concentrations for the peak at ~592 cm-1. ... 74
xiii
Abbreviations List
AgNP Silver Nanoparticle SRO Short Range Order
AuNP Gold Nanoparticle SSEF SERS Surface-enhancement Factor BM Biomolecule UV-VIS Ultraviolet-Visible
BO Bridging Oxygen XRD X-Ray Diffraction BSA Bovine Serum Albumin
CA Capture Antibody CPV Cresyl Violet Perchlorate CV Coefficient of Variation
DSC Differential Scanning Calorimetry EM Electromagnetic
FTIR Fourier-Transform Infrared HIL-2 Human Interleukin 2 HT Heat treatment IQR Interquartile Range
MAD Median Absolute Deviation ND Neutral Density filter NBO Non-Bridging Oxygen NP Nanoparticle
PCA Principal Component Analysis PI Isoelectric point
PSD Particle size distribution
QCV Quartile-Based Coefficient of Variation QR Quartile Range
RR Rietveld Refinement
SEM Scanning Electron Microscopy
SERS Surface-enhanced Raman Spectroscopy SPR Surface Plasmon Resonance
xiv
Symbols List
cm-1 Wavenumber / Raman shift
ΔH Enthalpic variation
ΔT Thermal variation related to Glass stability m Mass
M Molar concentration (mol/l) Na Avogadro constant
nm Nanometers
p Statistical significance (p-value)
Q1 First interquartile (or 25th percentile)
Q2 Median (x̄) value of interquartile range
Q3 Third interquartile (or 75th percentile)
Qn Number of bridging oxygens
r Pearson’s correlation coefficient σ Standard deviation
ẟ Bending modes
νs/as Symmetric/asymmetric stretching
Tc Glass crystallization Peak Temperature
Tg Glass Transition Temperature
Tx Glass crystallization Onset Temperature
θ Theta xi Data point
x̄ Median x̄. Mean
xv
Summary
1. Introduction ... 1
1.1. Global Treats ... 1
1.2. Overall of Current Diagnostic Methods ... 2
1.3. Researches on Biomarkers Based Biosensors ... 4
1.4. Plasmonic Resonance in SERS ... 6
1.5. Types and Approaches for SERS Substrates ... 9
1.6. Some Applications of Glasses in Biosensors... 11
1.7. Synthesis of Glass Matrices for Nanoparticle Growth ... 12
1.8. Adsorption of Biomolecule on Nanoparticle ... 14
2. Objectives ... 18
2.1. General Objectives ... 18
2.2. Specific Objectives ... 18
3. Experimental ... 20
3.1. Glass Structure and Synthesis ... 20
3.2. Glass Properties and Structural Analysis ... 21
3.2.1. Crystallographic analysis ... 21
3.2.2. Thermostability ... 22
3.2.3. Molecular structure investigation ... 23
3.3. Nanoparticle Morphology and Vitreous Surface Study ... 24
3.3.1. Arrangement and size investigation ... 24
3.3.2. Plasmon identification ... 25
3.3.3. Study of the surface plasmon resonance effect ... 26
xvi
4. Results and Discussion ... 31
4.1. Spatial array analysis by XRD ... 31
4.2. Thermal Properties Studied by DSC ... 35
4.3. Chemical Glass Structure ... 41
4.3.1. Molecular evaluation by Raman spectroscopy ... 41
4.3.2. Molecular evaluation with FTIR spectroscopy ... 49
4.4. Nanoparticle Morphology by SEM ... 54
4.4.1. Morphology and distribution evaluation ... 54
4.4.2. Nanoparticles size statistical analysis from SEM data ... 58
4.5. Plasmonic Resonance UV-VIS Absorbance ... 65
4.6. Enhancement Factor ... 68
4.7. SERS Analysis of Adsorbed Protein ... 74
4.7.1. Single step incubation ... 75
4.7.2. Antibody immobilization ... 79
4.7.3. Discussion... 83
5. Conclusions ... 87
APPENDIX A - Theoretical background ... 89
A.1. X-Ray Diffraction ... 89
A.2. Differential Scanning Calorimetry ... 90
A.3. Raman and Infrared Spectroscopies ... 91
A.4. Scanning Electron Microscopy ... 93
A.4.1. Statistical analysis of nanoparticle size study ... 94
A.5. Ultraviolet-Visible Spectroscopy ... 95
A.6. Surface Enhanced Raman Spectroscopy ... 96
1. Introduction
1
1.
Introduction
Ultrasensitive and fast detection of analytes has been, for a long time, crucial in many fields – food industry, drug discovery, environmental control and early-stage disease diagnosis, for instance.1–4 In this respect, the use of analytes for the identification of a
health condition is highly important since issues in human health are advancing constantly and so the need of new reliable detection methods for an accurate and efficient disease diagnose.
1.1.
Global Treats
Accordingly to the World Health Organization (WHO), resistant bacterial infections and non-communicable diseases such as cancer were one of the greatest threats to global health in 2019.5 Many difficulties arise when it comes to detection, treatment
and prevention of infectious diseases and cancers, partially because of the complexity of these diseases and their rapid spread (either between people or in person).6
The International Agency of Research on Cancer (IARC) has been updated on rates of cancer incidence worldwide and, for Brazil, the overall rate of the four most fatal types (including the ones shared amongst both sexes) have not been decreasing in the past years (Figure 1), not including lung cancer and prostate in male patients. In this case, rate reduction is linked to decrease in smoking rates in the past decades due to smoking conscientization, but, even so, the rates are still high.7 Meanwhile, the WHO released a
1. Introduction
2 differences in life expectancy in low income countries.8 However, mortality of patients, due
to infectious disease or cancer, can be effectively reduced with early diagnosis and treatment, demonstrating that this situation requires new prevention strategies, diagnosis, treatment and/or the application of theranostic medicine.9,10 Within it, development of
techniques associated to disease diagnosis with minimum disadvantage is required.
1.2.
Overall of Current Diagnostic Methods
Important and useful techniques used currently for diagnosis and disease therapeutics such as Enzyme-linked immunosorbent assay (ELISA), magnetic resonance imaging (MRI), computed tomography (CT), positron emission tomography (PET), polymerase chain reaction (PCR), culturing and others aids in the medical health system
Figure 1. Cancers rate incidence (per 100,000) of prostate, breast, colon (male/female) and lung (male/female) from 2000 to 2016 in Brazil.
1. Introduction
3 with disease identification, each of them carrying their strengths and drawbacks related to sensitivity, swiftness, low-cost, portability and easy accesses, for example. ELISA, for instance, is a versatile immunological assay technique that can be used as a diagnostic tool in medical centers, and also in the analytical industries. This technique allows the user to access quality control or detect and quantify a particular antigen, with similar approaches that can be adapted for an individual purpose.11 Nevertheless, target labeling demands
complicated chemical processes, which can affect the biological molecular structures used in this methodology. Therefore, label-free techniques exhibit distinguish potential for analyte detection.1
MRI, largely used in various brain disorder analysis and also often used to examine other organs abnormalities, has a major drawback related to detection and sensibility.11
This advanced technique can generate images deeper into the tissue, but cannot detect entities smaller than a few centimeters or differentiate minor changes in tumor size,12–14
which can result in a tardily cancer detection, when the disease is at a more advanced stage and treatment options are considerably affected.15 CT and PET are techniques that
can be complementary to each other for providing detailed description of structures and images, in which metastasis in the organism can also be identified.13,16 However,
submitting the patient to relatively high radiation doses, it may lead to the appearance of new cancer outbreaks, not to mention that PET also has a limited resolution on the order of few millimeters.15,17 These disadvantages, therefore, require new strategies that are able
to provide rapid diagnostics with a great sensitivity, capable of early detection that are also not aggressive/prejudicial to the patient.6
Infectious disease identification, on the other hand, requires different approaches, involving techniques such as ELISA and other methodologies like PCR and culturing. PCR has great sensitivity and specificity but has also limitations concerning chain reaction products, which are prone to binding and mutation errors. Additionally, as it needs isolated
1. Introduction
4 genetic materials, a careful manipulation of biological sample and complex analytical instruments are also needed.18,19 Furthermore, even though culturing, the mainstay in
clinical microbiology, is related to pathogen identification by isolated cultures, it became outdated for the study of complex microbial communities and is not totally adapted for detection of emerging fastidious bacteria.10 Within it, approaches that offer great
sensitivity and specificity but are also versatile and ease do handle are then an opportunity to overcome these challenges.
Many current diagnostics, as could be seen, lack in at least one crucial criterion necessary to be considered favorable in developing nations, being them sensitivity, swiftness, low-cost, portability and easy accesses.6 That being the case, point of care tests
(POCT) emerge as an alternative for detecting a variety of diseases-related biomarkers, enabling these technological systems to encompass the missing critical parameters of the analysis already in use, and improve overall diagnosis.20
1.3.
Researches on Biomarkers Based Biosensors
The biomolecular network of a human being is very complex, comprising of countless micro and macromolecules that regulates biological functions.21 Changes in the
concentration of some specific biomolecules can lead to malfunction of a cell and/or it can be the organism response against a health condition. Withing it, it is notable the use of these components for improvement of clinical care, which can include the assessment of a disease status monitored by a set of distinguish biomarkers.21,22 Biomarker can thus be
defined as a particular component related to a normal biological process, pathogenic mechanism or response to an (external) interference.22 Different approaches for the
detection of biomolecules have been under study, aiming disease diagnosis such as wearable molecular diagnostic systems,23,24 lateral flow assays,18,25 micro-fluidics assays 20,24 and
1. Introduction
5 Detection of biomolecules based on plasmonic effects is the commonly used approach in optical sensors and is gaining an outstanding importance in the past years owing to their label-free nature, high sensitivity and great limit of detection as low as single-molecule level.20,27 The fundament of the plasmon resonance is based on the
amplification of the electromagnetic field by association of the oscillatory electrons frequency on a metal surface with an external electromagnetic source.13,28 This
electromagnetic resonance, at a specific wavelength, is what is known as surface plasmon resonance (SPR). Among the distinct techniques that uses SPR, surface-enhanced Raman spectroscopy (SERS) is a very wide used one as it has little interference from water and, in some cases, additional structural information can also be acquired, making SERS very suited for biological applications.17,29,30
In the past few years, during Ebola epidemic, Sebba et. al.27 published about a
multiplex platform for detection of pathogen-related molecules, characterized by a particle-based sandwich immunoassay. This system is particle-based on SERS tags and magnetic beads conjugated with specific antigen for Ebola, Lassa or malaria, latter forming a complex with the target molecule and, after magnetic separation, it allows one to access enhanced Raman spectrum information of the disease biomarkers. Nonetheless, Xiao and collaborators 31
demonstrated that it is even possible to analyze untargeted molecules through SERS with liquid chromatography separation. This allowed the creation of a unique tumor metabolic fingerprint based on SERS spectra, enabling the detection of a tumor without knowing the identity of the component metabolites.
Moreover, Hernández-Arteaga and coworkers26 investigated a colloidal suspension
of a citrate-silver-nanoparticle (cit-Ag-NP) as SERS substrate for the ability of measuring the concentration of sialic acid in human saliva. Their work aimed to determine levels of this component and compare data among healthy and breast cancer patients, in which high sialic acid concentration in the saliva is related to disease presence. Using a calibration
1. Introduction
6 curve, their methodology, based on mixing the cit-Ag-NP with treated saliva samples showed sensitivity of 94%, specificity of 98% and accuracy of 92%, proving to be a promising technique. It is notable that enhanced Raman signals of molecules, which can be obtained from very low particle concentrations (up to 10-16 M), greatly outperforms the
detection limits of prevalent medical technologies.17
Some of these SERS-based sensors that focus clinical applications, nonetheless, are yet to be improved considering that, in general, point of care tests must also be simple to operate as well as suited for application in non-laboratory settings.24 Furthermore, the use
of non-specific biomolecules for disease identification can lead to uncertain diagnosis, since an indiscriminate biomarker can be related to more than one health condition. This implies that the use of specific (targeted) molecules may ameliorate diagnostic precision. 26
At last, it is important to consider that performance in a real-life situation may culminate in different results of that obtained in a bench research, and one must consider how some conditions (such as other molecules interference, sample type, storage condition, and others) may interfere in the final analysis.27 Given these points, as SERS is a technique
based on Raman signal enhancement trough SPR effect provided by metallic nanoparticles, it is also pertinent to investigate substrate-sensitivity and limit of detection based on the enhancement effect of the probed approach.
1.4.
Plasmonic Resonance in SERS
Unlike some fluorescence and absorbance techniques (such as ELISA and fluorescence microscopy), Raman spectroscopy relies on inelastic light scattering directly from an analyte, not requiring sample labeling with external dye molecules.32,33 However,
biological specimens analyzed at low wavelength such as 532 nm often yield in fluorescence and damage/burning of sample.32,34 This type of analysis thus requires longer excitation
1. Introduction
7 adversity, enhancement of Raman spectra has been improved over time through surface plasmon resonance, a technique known as SERS, providing high sensitivity, resistance to photobleaching and optimization to avoid native autofluorescence of organic samples.32,35
SERS, as explained previously, is based on the plasmonic resonance between an incident electromagnetic wave and a metal surface, which amplifies the field near the surface.32,36 For this oscillation to be in resonance, it depends on several factors such as
nanoparticle size and shape, the wavelength frequency applied, the environment (i.e., air, aqueous solutions, etc.), metal type and others.37
Among the metals normally used in nanoparticle studies, silver, gold and copper are widely employed in SERS applications due to their high optical properties and enhancement factors, having plasmon band lying in the visible range.28,38,39 AuNP, for
example, have great biocompatibility, being broadly applied for detection in living cells and animals.28,30,40 Nevertheless, gold is a more expensive material and produces weaker
SERS enhancement compared to silver nanoparticles.41 Copper nanoparticles, on the other
hand, have enhancement factor compared to gold and even silver nanoparticles.38,42
However, since copper is easily oxidized, gold and silver nanostructures are still more attractive for optical applications.39 Hence, biomolecule detection using silver
nanoparticles have substantial benefits for SERS applications compared to other metals.36,43
Furthermore, as shape and size of metallic nanostructure can influence plasmon resonance, an intense magnetic field at specific positions, such as the corners of nanocubes, can generate highly localized SPR (LSPR), capable of increasing the overall sensitivity of the technique.28 Single plasmonic nanoparticle, nevertheless, does not provide sufficient
enhancement for practical applications.32 When particles are brought close together,
however, the gap between them can produce extremely vast signal enhancement, known as “hot-spots”.32,44 These so called “hot-spots” are regions of the nanoparticulate
1. Introduction
8 colloids/substrates where the electromagnetic field is highly enhanced. These regions between metallic nanoparticles highly localize the EM field and, thus, very high enhancements are produced at these interfaces.29,45 Bulk metal or a smooth metallic surface
can generate SPR, but plasmon dispersion results in low sensitivity.46 Nanoparticles, on
the other hand, have higher surface area and, by controlling the basic geometry and nanoparticle distance, it is possible to achieve extremely large sensitivity because of the spatial confinement of the plasmon mode in the narrow gaps between particles.47
Matteini and collaborators29 produced a standardized Ag nanocube suspended in
physiological pH, in which the tips of the cubes worked as “antennas” for the plasmonic resonance, presenting plasmon band at 455 nm and electric field around 22 V.m-1. With
this very specific location for enhancement, the EFmax obtained by the authors were around
105, not much higher than the average reported on the literature, possibly due to the small
and isolated areas for the LSPR. The EM fields presented on the nanostructure surface are immensely pronounced on sharp edges or vertices, but the high field strengths at these regions diminish rapidly with distance from the particle surface.17
Additionally, Lu and colleagues36 developed a silver nanostructured substrate with
particles ranging from 46.5 to 75.8 nm. They observed that with increase in nanoparticle size, the plasmon band red shifted and a decrease of interparticle spacing was also observed from 15 to 1 nm respectively. This resulted in an increase in electric field increment from 5.7 to 40.7 V.m-1, with enhancement factor estimated to be 3.106. This indicates that
strong electric fields can be obtained when interparticle distance decreases, producing powerful hot-spots. However, since these regions comprise smaller areas compared to the neighboring metallic surface, the chances of a molecule adsorbing at a hot-spot are narrow.48 In colloidal nanoparticles, the aggregates are responsible for forming these
hot-spots (when no sharp structure is adopted), but this leads to poor reproducibility of signal enhancement, since aggregation is not completely controled.2
1. Introduction
9 Regardless of this, the higher the enhancement, the lesser the nanogap will be, which lowers the probability to find the hot-spot.32 Thus, hot-spot regions will only be
found in a small portion of the whole SERS substrate. According to this, different SERS substrates have been developed aiming the obtention of good hot-spot regions for great sensitivity and limit of detection.
1.5.
Types and Approaches for SERS Substrates
Metal colloids and structural solid substrates are the most used approaches to obtain SERS effect and they differ mostly in the arrangement of nanoparticles. They have been developed with the purpose of improving the Raman signal enhancement based on hot-spots, with techniques such as silver mirror reaction,36 spin-coating,49 lithographic
systems,50 nanoimprinting51 and self-assembly.52 This variety of systems for nanoparticle
obtention aspire the best SPR response, each having its own singularity since metal type, configuration, morphology and arrangement of nanoparticles can influence in the plasmonic resonance effect. These characteristics regulate both collection efficiencies of signal and detection sensitivities in SERS, hence distinct techniques can be applied resulting in a different nanoparticle configuration and different signal enhancement outcome.36,53
Within it, a number of these mechanisms are using cellulose based substrates for nanoparticle assembly as cellulose provides a unique three-dimension cross-linked porous structure that lead to a wide hot-spot region following (controlled) silver deposition.36,54– 57 Lu and collaborators36 recently demonstrated the efficiency of a cellulose based nanofiber
structured with silver NP for detecting Rhodamine 6G at concentrations as low as 1x10-16
mol.l-1 (depending on NP size). They also reported that large silver particles aggregates
1. Introduction
10 intensity. Therefore, some difficulties arise when taking into account reproducibility and SERS signal homogeneity along the substrate.54
Providing that, different strand materials can also be employed for SERS based on standardized techniques, such as optical fiber with lithographic systems. Quero et. al.50
applied nanosphere lithography to obtain regular polystyrene nanoparticles covered by thin gold film at the fiber tips and was able to achieve an enhancement factor of 4x10⁵.
This approach gives a substrate with very high periodicity and proper enhancement factor. However, this technique requires the use of sophisticated equipment and is time consuming. Furthermore, for colloidal nanoparticles acquisition, some of the techniques include the use of sodium citrate (i.e. Lee-Meisel method)58, which produce nanoparticles
with great Raman signal enhancement.59 But it can result in signal interference from some
of the citrate or other capping agents, which disturbs the desired analyte vibrational mode obtention.57,60 Therefore, “clean” techniques for obtaining NP are important strategies to
avoid adulteration of the SERS signal.
Notwithstanding, the challenges regarding the facile fabrication of these substrates with a high spectroscopic performance remains difficult and costly for routine SERS detection. An explanation to that concerns the substrates and techniques requirement for advanced apparatus, while they occasionally provide good sensitivity and signal homogeneity/reproducibility.52 An alternative for metallic nanoparticle assembly is by
using glassy materials, in which a diverse number of approaches can be used for obtaining good standardized nanoparticle aiming SERS substrates.38,61,62 Additionally, metallic
glassy substrates possess good mechanical properties, making them easy to be conserved and durable in applications.51
1. Introduction
11
1.6.
Some Applications of Glasses in Biosensors
Among the SERS solid substrates, glassy materials are an alternative for obtaining reproducible highly sensitive metallic nanoparticles for Raman signal enhancement, as it can present high-density hot-spots, satisfactory uniformity, signal reproducibility, high enhancement factors and low fabrication cost, depending on the approach for NP obtention.51,62–64 Liu and collaborators,51 for instance, used nanoimprinting to produce
metallic glass array nanowires as an easy, rapid, environmentally and economically favorable method to prepare air-stable SERS substrates. The uniformly distributed nanowires presented plentiful hot-spots between the nanowire tips, with an overall enhancement factor of 1x10⁵ when analyzing Rhodamine B.
Conversely, Solís and coworkers62 studied SERS effect of nanoparticles
submonolayers by drop-coating colloidal solution on a glass substrate. They obtained planar and highly uniform NP monolayers on glass surfaces and could observe that SERS efficiency of nanospheres and nanorods outgrowth with increasing neatly/tidily surface coverage, which can be explained by an accumulation of hot-spots on these substrates. Furthermore, a distinct approach using glass as a SERS substrate was applied in a study performed by Schneider et. al.,64 where they used a distinct NP growth process, based on
a bottom-up approach, to obtain nanoparticles at the glass surface. This mechanism is based on vitreous doping with a noble metal while producing the glass melting. They could obtain silver based nanostructures from an active glass matrix using thermal treatment under a reductive atmosphere, with overall 1x10⁵ enhancement factor.
Owning to this, the importance of glasses in SERS applications is remarkable and prominent, since it possesses improved durability, enhanced signal reproducibility, abundance in hot-spots, satisfactory uniformity, high enhancement factors and low fabrication cost.
1. Introduction
12
1.7.
Synthesis of Glass Matrices for Nanoparticle Growth
Recently, the synthesis of doped glasses for nanoparticle assembly (through bottom-up approach) have been demonstrated by researches to be a compelling SERS substrates.38,64–66 As it is, the process of glass fabrication can be better understood in order
to elucidate the mechanism of nanoparticle formation.
The traditional definition of the word “glass” is related with molten inorganic products that have been cooled to a solid state without crystallizing, maintaining its liquid nature in a rigid condition.67 In general, for one to obtain a vitreous substrate, glass
network formers such as borate, silicate, phosphate, borosilicate and borophosphate must be used as they can form a highly connected three-dimensional amorphous chain.68 If an
oxide, like Na2O, is added to the glass during its fusion process, a bond in this network is
broken and the sodium ion becomes part of this structure. These types of oxides are known as modifying agents, and their addition are useful to reduce the matrix viscosity and to grant more chemical resistance since they depolymerize the lattice and reduce the glass transition temperature.
For example, phosphate glasses are composed basically of PO4 tetrahedra units
linked through covalent bridging oxygens (BO), while the basic units of borate glasses are trigonal BO3.69,70 The addition of modifiers to each glass network will result in
depolymerization of phosphate glasses, as the introduction of an oxygen from the modifier oxide forms negative non-bridging oxygen (NBO) sites. Controversially, it increases the polymerization degree of borate glasses, changing the boron coordination number from trigonal to tetrahedral (BO3 to BO4). Additionally, the charge of these NBO formed during
depolymerization is compensated by the positive modifier cation.71
After fusion, these metallic and non-metallic elements (mostly oxides) can turn into glass only under critical cooling rates, in which they maintain their amorphous spatial structuring like that of a liquid (can also be referred as a super cooled liquid).67 The
1. Introduction
13 definition of a glass can thus be summarized as a thermodynamically and kinetically stabilized liquid but in a non-equilibrium amorphous solid state.71 In addition, differently
from crystals, the atomic arrangement of the vitreous structure has no periodicity over space, but they can be considered to have a short-range order (SRO).72 However, with the
addition of modifying agents in high concentrations, the matrix can become extremely fluid, facilitating the formation of crystalline structures in the matrix and increasing the long-range order (LRO) of the three-dimensional network, which is generally not desired.68
Nonetheless, it is possible to control crystal nucleation with temperature, or with concentration of former and modifier oxides.
Among the oxides considered good glass forming agents, phosphate oxide have been earning attention due to its remarkable functional properties as a glass, such as low viscosity, high thermal expansion and low refractive index for instance, which make them excellent candidates in optical applications.73,74 Nevertheless, pure phosphate glasses have
low chemical durability with low aqueous corrosion resistance, but they have an important advantage that includes the ability to incorporate high concentrations of transition metal ions and still remain amorphous.74,75 Thus, modification of the pure phosphate glass matrix
with other glass formers, such as B2O3, helps in improving chemical durability as well as thermal and mechanical stability.74,76 The further addition of trivalent and divalent oxides
thus helps improving its resistance and borophosphate glasses, modified with ZnO or Al2O3, have already been demonstrated to have great chemical stability and low hygroscopicity.65,66,71
The addition of modifiers depolymerizes the borophosphate network by forming NBO as the glass structure also becomes more open.77 This, in turn, favors cation mobility
within these formed free paths and, under certain temperature conditions (annealing), metallic dopant ions, such as AgNO3, can be reduced on the glass surface and form
1. Introduction
14 nucleation sites for nanoparticle growth.65,75 A reductive atmosphere, such as hydrogen,
can hence produce Ag0 nanoparticles that size can be controlled with annealing time.64–66
Withing it, these metallic nanostructures formed at the outer side (surface border) of vitreous matrix can serve as “antennas” for enhancing Raman signal through plasmon resonance effect. Furthermore, since SERS effect of a particular molecule arises only close to the metallic surface (due to SPR range), it is pertinent to investigate the analyte interaction with nanoparticles along with test-sensitivity (related to the response of a molecule to Raman) and limit of detection (associated to molecular concentration) of the probed approach.
1.8.
Adsorption of Biomolecule on Nanoparticle
The enhancement of the Raman signal of a molecule by surface plasmons generally occurs at close proximity of the nanometallic surface.20 Given that, some chemical and/or
physical mechanisms are associated in this bioconjugation to efficiently adsorb biomolecules onto the nanoparticle surface.
SERS immunoassays requires surface modification of the metal nanoparticles with target-specific antibodies in order to be able to precisely identify the desired analyte. This discriminatory mechanism based on antibodies adsorption rather than direct analyte interaction is very pertinent as it is based on biospecific recognition, offering great selectivity.37 It can be accomplished by antibody binding to the silver surface through
their amino acids, forming complexes with the silver.78
Providing this, several potential adsorption strategies can be employed, either by relying on chemical or physical interactions, to analyze a biomarker via SERS. Chemical process (stronger, rely on covalent bonds) requires functionalization of NP by using, for example, chemisorption via thiol derivatives and bifunctional or mediator linkers.40
1. Introduction
15 Physical process (weaker, but very abundant), on the other hand, relies on non-covalent interactions such electrostatic attractions.79
Formerly, in vivo or in living cells applications, colloidal nanoparticles are typically preferred due to its practicality in administration as they are already suspended in a solution.41 For these types of nanoparticles, surface functionalization (alteration of the
exterior nanoparticle characteristics – charge, presence of linkers, etc.) is commonly used not only for targeting a specific molecule or cell but also to improve NP stability, increase cellular uptake, depress immunogenicity, decrease aggregation, among others.40 Chemical
functionalization of these nanoparticles are thus a routine mechanism employed in biological analysis. In consequence, the use of immunosorbent sandwich approach for biomolecule detection is frequently applied with the use of Raman active dye molecules or use of another functionalized colloidal nanoparticle solution to produce satisfactory SERS.44 Nonetheless, the electromagnetic enhancement of the analyte signal decays
exponentially with the distance formed, after functionalization, between nanoparticle surface and desired biomolecule, drastically reducing SERS effect.80
Furthermore, some SERS based methodologies benefit from the signal of another Raman active molecule (similar to ELISA approach), in which the intensity of the Raman reporter collected is directly related to the concentration of the desired analyte. Chuong and colleagues,81 for instance, presented a SERS-linked sandwich assay based on two
Raman tags, one linked to a gold film surface and another linked to gold nanoparticles. They aspired in detecting thrombin without a false-positive result, so only read-out signals containing both Raman reporter spectra were indicative of the presence of thrombin. This (sandwiched) approach, however, requires the stabilization of the colloidal nanoparticles to avoid nanoparticle aggregation which may interfere in the analysis and, since the hot-spots formed are only achieved if there is a conjugation between targeted film and nanocolloids, three false-positives can occur: SERS from defected thin films, from
1. Introduction
16 nanoparticle aggregates or from protein mediated biding “errors”.44,81 Additionally, some
analysis, based on a colormap result, can culminate in false color result since it is difficult to achieve homogeneous distribution of SERS NP aggregates on the surface. All these protracting methodologies, with oodles steps and difficulties, are an impasse for an efficient point-of-care test.
Solid SERS substrates, on the other hand, do not necessarily demand surface functionalization for nanoparticle stabilization or particle aggregation reduction, which cooperates for direct biomolecule adsorption. Ionic interactions depend on the attraction of the amino acid groups (in a non-zwitterionic state) with opposed charged ions presented on the metallic molecule of interest. The difference in a pH solution enables the adjustment of the protein net charge without the need of previously functionalize the nanoparticle surface with a specific charge. So, if the surface of interest is positive, the biomolecule can be protonated in an acidic buffer to enable ionic interactions, not previously possible if considering physiological conditions.
However, when it is indeed crucial and used (especially when the substrate is not nanostructured), some strategies are necessary to be considered in order to intensify the SERS signal as signal enhancement decay with distance rise.80 As an example, the use of
functionalized thin-films of gold (AuTF) and gold nanospheres (AuNS) with dithiol can be configurated in such a way that the gap distance between the region of interest surfaces is set by the length of the adsorbed molecules.82 Good enhancement factors can be achieved
with a functionalized sandwiched between AuTF-AuNS, in the order of 6.4x10⁶. But this
approach, consequently, has a gap distance, nanoparticle size and sandwich configuration dependency, which makes reproducibility difficult.82
Developing a scenario in which physical interactions can be further exploit offers a breakthrough for a methodology simpler to reproduce. Processes such as (i) ionic interactions between the charged nanoparticles surface and the opposed charged antibody
1. Introduction
17 residues, (ii) hydrophobic attraction between biomolecule and NP surface and (iii) dative binding between conductive electrons and sulfur atoms of antibody amino-acids describe the spontaneous adsorption of antibodies onto nanoparticle surfaces.40 Thus, the antibody
structure plays an important role when relying on physical means for molecule adsorption. However, a major drawback of this strategy is the necessity of high antibody concentration, random orientation and replacement by other molecules in biological samples.40,83
Even though, (free) immobilization (without the use of chemical linkers) of proteins onto a metallic nanoparticle surface can also offer single molecule detection limits, similarly to results found with functionalization.84–86 It is important to consider, howbeit, that some
immobilization strategies already studied counted on citrate stabilized gold nanoparticles (facilitating protein interaction), with extreme long incubation time (>15 h).59,84
Withing it, biomolecule conjugation offers additional difficulty in SERS study by affecting the quality and easiness of analysis. Hence, extending the comprehension and capability of antibody adsorption, based on physical methods, can advance the development of practical methodologies to be applied in a rapid and simple way analysis. Notwithstanding, despite of all the different substrates for SERS applications that have been developed or are in-development, an analysis of the literature leads us to come to one main conclusion: Albeit the several qualities these substrates present, to the best of our knowledge, they lack at least one crucial criterion to be considered a great point-of-care diagnostic tool, such as sensitivity, low-cost, portability, easy access and important aspects like facile fabrication, resistivity, high spectroscopic performance, reproducibility and easy assembly.
As previous shown, glass substrates with self-assembled nanoparticles possesses great potential to overcome these attributes, since they are reasonably easy to obtain, with overall cheap procedures, with great SERS effect, are resistant and offers good signal reproducibility.38,64,65,87
2. Objectives
18
2.
Objectives
2.1.
General Objectives
Explore the use of two borophosphate glass matrix as a self-supported silver nanoparticle substrate for SERS application, one modified with aluminum oxide (Al2O3)
and another with zinc oxide (ZnO). Our aim is thus to identify the main differences between both vitreous matrices under thermal treatment and how they respond to the SERS effect based on the different nanoparticle sizes obtained at each annealing time. The hypotheses investigated thus considered whether the nanoparticles growth offers dissimilarities in glass matrices and if the enhancement ability as a SERS substrate is superior to the overall found in the literature. Furthermore, protein analysis was also investigated in order to better elucidate whether biomolecule detection is possible and which method (between long or short incubation, and in the presence or not of buffer solution) would be best suited to employ in our vitreous substrate.
2.2.
Specific Objectives
I. Characterization of glass matrices and silver nanoparticles according to the adopted annealing time by accessing:
• Crystallographic/amorphous profile • Thermostability
• Structural conformation
• Nanoparticle dimension and morphology
2. Objectives
19 II. Examination of SERS performance with overall enhancement factor in respect
of a standard molecule
III. Study of the performance of our vitreous substrate in detecting biomolecule based on three direct approaches for biomolecule adsorption with: protein solution in water (free of possible salt interference) and protein under simulated biological conditions (buffers); based on:
• Single step for protein adsorption (short incubation) • Protein immobilization (long incubation)
3. Experimental
20
3.
Experimental
The techniques employed in this study are summarized in Table 1, and theoretical information regarding each of them can be accessed in Theoretical Background (APPENDIX A).
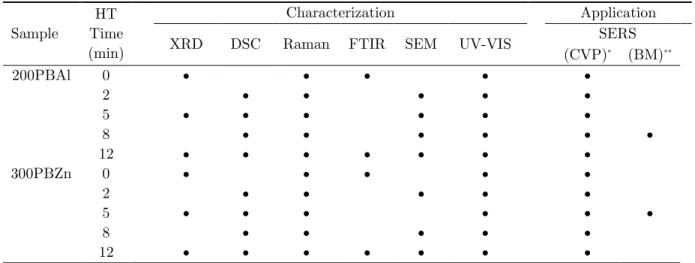
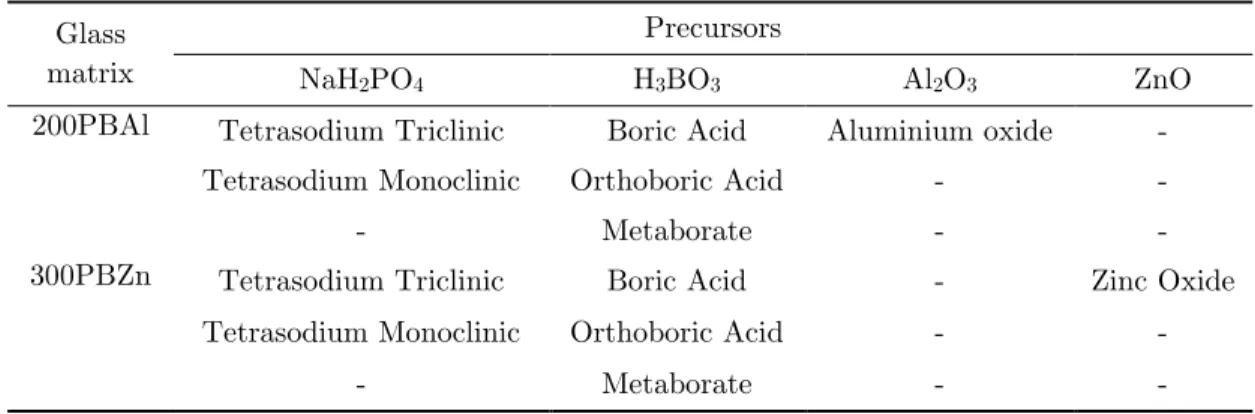
Table 1. Pre-established vitreous samples and their corresponding annealing times used during the study, with their respective characterization and application studies.
Sample HT Time (min) Characterization Application
XRD DSC Raman FTIR SEM UV-VIS SERS
(CVP)* (BM)** 200PBAl 0 • • • • • 2 • • • • • 5 • • • • • • 8 • • • • • • 12 • • • • • • • 300PBZn 0 • • • • • 2 • • • • • 5 • • • • • • 8 • • • • • 12 • • • • • • •
* Cresyl Violet Perchlorate ** Biomolecules Source: Self-elaborated.
3.1.
Glass Structure and Synthesis
Borophosphate glasses were fabricated (by collaborators) adopting (in mol%) the NaH2PO4-HBO3-Al2O3/ZnO glass template, in which NaH2PO4 and HBO3 ratio was set
at 2, Al2O3 or ZnO were added in a proportion of 20% (10% Al2O3 and 20% ZnO). Samples were also doped with AgNO3, added at 3%, and all reagents used were of high purity
(Aldrich Co.). The melting-quenching technique applied is described previously by Schneider,64 where the synthesis used 5 g of the above-mentioned reagents, homogenized
3. Experimental
21 fused at 1050 °C for 1h and, posteriorly, glasses were quenched to the room temperature in a graphite mold.
Thermal post-treatment was applied (by collaborators) for growth of nanoparticles (bottom-up process),38,64,65 in which Ag0 nanolayer was obtained at 200 °C for aluminum
matrix and at 300 °C for zinc matrix, under an hydrogen atmosphere for 2, 5, 8 and 12 minutes. A constant flow of 50 ml.min-1 was applied during the bottom-up process.
Samples were stored in a dissector under vacuum until analysis. The nomenclature of samples was designated as 200PBAlt or 300PBZnt, where 200 or 300 represents the temperature used during the annealing process (in ᵒC), P = NaH2PO4, B = HBO3, Al/Zn
= Al2O3/ZnO and t = 0, 2, 5, 8 or 12 (depending on the amount of thermal treatment time applied, in minutes).
3.2.
Glass Properties and Structural Analysis
3.2.1. Crystallographic analysis
The crystallographic structures of vitreous borophosphate matrix were studied by x-ray diffraction technique (XRD). The crystallinity patterns were obtained by a Miniflex diffractometer 600 (Rigaku, Japan), with a Cu Kα radiation (1.541 Å) at 40 kV and 30 mA. Data were collected from 10 to 90° 2θ, with a step size of 0.02° min-1. For the analysis
of XRD patterns, experimental diffraction patterns have been normalized. Additionally, in order to identify the possible phases of the glass samples, XRD of the glass precursors (NaH2PO4, H3BO3, Al2O3 and ZnO) were also collected. A Rietveld refinement of the precursors were conducted in the Miniflex diffractometer 600 software for crystalline phase identification and further comparison with vitreous diffraction patterns.
3. Experimental
22 3.2.2. Thermostability
Vitreous state of 200PBAl2-12 and 300PBZn2-12 samples were studied by thermal analysis known as differential scanning calorimetry (DSC). The glass transition temperature (Tg) measurements were achieved by DSC-60 Differential Scanning Calorimeter (Shimadzu, Japan). Samples were ground to a thin powder using agate mortar, with 5 to 10 mg of each being placed into sealed aluminum crucibles and analyzed under a constant nitrogen flux of 50 ml.min-1 with applied heating rate of 10 °C min-1
ranging from 30 to 600 °C. A baseline was run under a flowing nitrogen atmosphere using a reference empty aluminum crucible.
For this current work, the adopted definition of Tg considered the onset value. The glass degradation onset (Tx) was determined similarly, taking the intersection of tangents
from the baseline and the initial slope of the peak. And finally, the determination of degradation peak (Tc) considered the midpoint of its maximum value, while the area under the peak provided the latent heat (enthalpy) of degradation (See A.2 of APPENDIX Afor further comprehension).
To further investigate the association of thermal analysis and annealing time, a correlation analysis was investigated for each sample set. No normality test was assumed, since sample size number is not sufficient to express significance. Pearson’s correlation coefficient was then chosen as it measures the association, that is, the tendency of the variables to lie on a straight line, considering the following equation:
r = ∑ (xi- x̄.)*(yi-ȳ ) n i=1 √∑n (xi- x̄.) i=1 2* ∑ni=1(yi- ȳ )2 Eqn. (1)
Which consider the variation of data from the mean (x̄. and ȳ) divided by its variability.88
3. Experimental
23 3.2.3. Molecular structure investigation
In this sense, chemical structure of vitreous substrates was evaluated by normal Raman analysis, conducted on a LabRAM HR Evolution (HORIBA Scientific) coupled with a CCD detector. A 532 nm line with CW Argon ion laser was used, with a 50x objective and optical intensity was kept at 100% laser power. All samples were analyzed at room temperature and with Raman shift ranging from 150 to 1800 cm-1. All
borophosphate matrices (Al200 °C, Zn300 °C) at all different treatment times (0, 2, 5, 8 and 12 min.) were analyzed. Samples were not polished or pre-treated, having whole fragments selected.
Raman analysis was complemented with Fourier transform infrared (FTIR) spectroscopy, with spectra collected in a Shimadzu IRPrestige-21 spectrometer (IRPrestige-21 model). Data were obtained at room temperature, with wavenumbers ranging from 4000 to 400 cm-1 and spectra given in transmittance percentage vs.
wavenumber. For this analysis, only one annealing time per matrix was selected, being it the maximum treatment time (12 min), along with samples without thermal treatment (0 min). Fragments were first dried for 40 minutes at 60 ᵒC and then grounded to thin powder, with an agate mortar, previous to pellet preparation. Sampling preparation used potassium bromide (KBr) (pre-dried for 12 hours at 100 ᵒC) and powdered glass samples at a ratio of 0.1% (m of KBr/m of sample), vigorously mixed in an agate mortar. The 13 mm pellets of the KBr/sample mixture were assembled with an applied pressured of 60 psi for 30 seconds, and pure KBr pellet was used for baseline correction.
All Raman and FTIR spectra were baseline corrected (constant at minimum value) and normalized to the band with maximum intensity. Deconvolution of spectra was carried out in order to identify all peak contributions related to vibrational modes of the chemical glass structure. For spectra plotting, baseline correction based on a second order polynomial fitting and Loess smooth signal process were performed.
3. Experimental
24
3.3.
Nanoparticle Morphology and Vitreous Surface Study
3.3.1. Arrangement and size investigation
All glass samples (200PBAl/300PBZn) at all annealing times (2-12 min), with exception of 300PBZn5, had their nanoparticle size and shape assessed by scanning electron microscopy (SEM) technique. The images were recorded using a Quanta FEG 250 Scanning Electron Microscope, with platinum and gold coating performed at 40 mA for 60s. In general, 201 nanoparticle counts, for each HT time and matrices, were considered for area calculation of thresholded images where clearly isolated nanoparticles were used in the counting. Thresholded nanoparticle images that appeared coalesced together were not included for the area calculation or were manually separated (when associated by just few pixels), as these samples could bring size dispersion to higher values erroneously. It must be considered that, since SEM images gives a superficial representation of the glass surface without perspective or depth notion, area rather than volume was the adopted strategy for size evaluation, with further diameter measurement.
The average nanoparticle size was calculated based on the Shapiro-Wilk test, used for assessing normality of data previously the statistical analyses. The dispersion or variability of data (deviation of data from the median value) was calculated by the median absolute deviation (MAD), a more robust alternative (for nonparametric data) compared to the standard deviation method, with the following equation:
MAD = median (|xi− x̄ |)
Eqn. (2)
Which considers the absolute deviation of data from the median. Additionally, the average uniformity of a particle was calculated by the median coefficient of variation (CV), known as an estimate of the particle size distribution (dispersity) in its environment.89
3. Experimental
25 This coefficient is defined as 100 percent times the standard deviation (σ) of the particle diameter distribution divided by the mean (x̄.) particle diameter.88,89
CV = σ
x̄. x 100
Eqn. (3)
This equation is applied for normal distributed data, where mean and standard deviation provide enough useful statistical information. However, when the data is not normally distributed, this coefficient can be estimated based on the IQR from a median calculation, and this measure is given by the quartile-based coefficient of variation (QCV).90
QCV = (Q3-Q1)
Q2 x 100
Eqn. (4)
Where Q1 is the 25th percentile, Q3 is the 75th percentile and Q2 is the median (x̄)
value in the interquartile range. The QCV was then applied for the investigation of nanoparticle size dispersion. Further explanations about this statistical analysis can be accessed in A.4.1 of APPENDIX A.
3.3.2. Plasmon identification
The qualitative analysis of silver nanoparticles was evaluated by ultraviolet-visible (UV-VIS) spectroscopy with a UV-3600 UV–VIS–NIR Shimadzu spectrometer, operating from 400 to 4000 nm and with a resolution of 1 nm. The technique allows the assessment of surface plasmon resonance (SPR) bands of metallic nanoparticles bigger than 2 nm by analyzing the absorption band resulting from the interaction of the electromagnetic wave and the free electrons of the surface silver nanoparticles (refer to A.5 APPENDIX A for further comprehension). Data was collected for both glass matrices without annealing time and for each thermal treatment time under study. This analysis used whole fragment, held