Maria João Quitoles De Oliveira
Licenciada em Biologia Celular e Molecular
Plasmonic substrates for ultrasensitive
surface-enhanced Raman spectroscopy: application to the
detection of food toxins
Dissertação para obtenção do Grau de Mestre em Biotecnologia
Orientador: Prof. Doutor Hugo Manuel Brito Águas, Faculdade de
Ciências e Tecnologia da Universidade Nova de Lisboa
Co-orientador:
Prof. Doutor José Ricardo Ramos Franco Tavares,
Faculdade de Ciências e Tecnologia da Universidade
Nova de Lisboa
Júri:
Presidente: Prof. Doutor Pedro Miguel Calado Simões Arguente: Doutor César António Tonicha Laia
Vogal: Prof. Doutor Hugo Manuel Brito Águas
ii
Maria João Quitoles De Oliveira
Licenciada em Biologia Celular e Molecular
Plasmonic substrates for ultrasensitive surface-enhanced
Raman spectroscopy: application to the detection of food
toxins
Dissertação para obtenção do Grau de Mestre em Biotecnologia
Orientador: Prof. Doutor Hugo
Manuel Brito Águas, Faculdade de
Ciências e Tecnologia da Universidade Nova de Lisboa
Co-orientador:
Prof. Doutor José Ricardo Ramos Franco Tavares,
Faculdade de Ciências e Tecnologia da Universidade
Nova de Lisboa
Júri:
Presidente: Prof. Doutor Pedro Miguel Calado Simões Arguente: Doutor César António Tonicha Laia
Vogal: Prof. Doutor Hugo Manuel Brito Águas
iii Plasmonic substrates for ultrasensitive surface-enhanced Raman spectroscopy: application to the detection of food toxins
Copyright © Maria João Quitoles de Oliveira, Faculdade de Ciências e Tecnologia, Universidade Nova de Lisboa.
v Para a minha avó Soledade,
com saudade
Para os meus Pais, “Que nos dão as asas…. E o céu para voarmos bem alto”
vii
Acknowledgements
Agradeço ao Professor Hugo Águas por me ter aceitado como orientanda com a prontidão de um clic, por me ter orientado ao longo deste ano com a sua competência científica e alegre disponibilidade.
Ao Professor Ricardo Franco que sendo meu coorientador me guiou nas encruzilhadas que por vezes o trabalho de investigação encontra, pela sua paciência, conselhos e resposta rápida.
Estou muito grata pelo seu encorajamento em momentos menos fáceis.
Agradeço também ao coordenador do meu mestrado, Professor Carlos Salgueiro, pela eficiência e rapidez que sempre demonstrou no esclarecimento de dúvidas e pela ajuda que simpaticamente me deu na solução de problemas mais burocráticos.
Ao Professor João Sotomayor por me ter ensinado a medir o ângulo de contacto.
Ao departamento de Conservação e Restauro, particularmente à Professora Maria João Melo e Professora Márcia Vilarigues por me terem permitido trabalhar com o espectrómetro de Raman, tão essencial ao meu trabalho.
Ao Doutor Pedro Quaresma pelo esclarecimento de dúvidas e boa disposição, bem como, pelas suas nanostrelas de prata.
Às Mestres Ana Marques e Mafalda Costa, pela disponibilidade para lidar com as idiossincrasias da impressora a cera.
À Mestre Andreia Araújo por me ter ajudado na técnica de deposição física de vapor.
À Mestre Vanessa Otero, pela paciência no esclarecimento de todas as dúvidas, preocupação, conselhos, mas sobretudo pela boa-disposição contagiante mesmo nos dias menos bons! À Tatiana Vitorino por ser madrugadora como eu e me abrir o laboratório, e à Marta por me ter deixado encantar pelas obras em que trabalhava. Aos restantes elementos do laboratório de Conservação e Restauro, Rita, Susana, e Miguel, obrigada pela simpatia e disponibilidade.
À Doutora Inês Gomes por todas as discussões para tentar solucionar problemas, por todos os conselhos, motivação, encorajamento e “bilhetinhos”! Essencialmente, por toda a tua paciência, és uma excelente pessoa e foi um prazer poder conhecer-te!
Às minhas colegas Ana Inês Reis e Mariana Coutinho, pela alegria, almoços e disparates. Tornaram os infindáveis dias de laboratório mais leves.
Aos meus “orientandos”, António Lopez e Catarina Bombaça, por me terem permitido desorientá-los proporcionando-me assim a minha primeira experiência de ensino.
À minha vizinha Raquel Maricato, que há 9 anos nos aturamos e que espero que assim continue!
viii Aos meus avós, Bina, Francisco e Zé. Obrigada por se preocuparem comigo e o meu bem-estar. Pela força e carinho que me transmitem diariamente. São um exemplo a seguir e sinto muito orgulho por vos ter na minha Vida.
À minha Piglet, pela paciência nas noites de luz acesa a trabalhar. Pelas gargalhadas e uma compreensão que é só nossa. Pelas discussões, carinho e amor. És uma excelente pessoa mesmo que não o saibas tão bem quanto eu. Tenho muito orgulho em te chamar minha irmã.
Ao David, por tudo. Pela pessoa genuinamente boa que és, pelo apoio incondicional e paciência que demonstras diariamente, mesmo quando eu não mereço. Obrigada pelo carinho e amor mais do que alguma vez pensei ser possível. Não há palavras para expressar o quanto sou feliz ao teu lado, obrigada por me fazeres rir. Obrigada por me amares.
Aos meus pais, porque dizer obrigada parece, é, muito pouco. Vocês apoiam-me sempre nas minhas escolhas, mesmo tendo eu tendência para o caminho mais difícil. Obrigada por me ouvirem a falar sobre o meu trabalho e tentarem aconselhar-me, mesmo não o percebendo. Obrigada, porque não têm sido anos fáceis, mas nós os quatro continuamos uma família unida capaz de ultrapassar todas as montanhas. Obrigada por tudo.
“The endless cycle of idea and action,
Endless invention, endless experiment, Brings knowledge of motion, but not of stillness; Knowledge of speech, but not of silence; Knowledge of words, and ignorance of the Word. All our knowledge brings us nearer to our ignorance, All our ignorance brings us nearer to death, But nearness to death no nearer to God. Where is the Life we have lost in living? Where is the wisdom we have lost in knowledge? Where is the knowledge we have lost in information? The cycles of Heaven in twenty centuries
Bring us farther from God and nearer to the Dust.”
ix
Abstract
The food contaminants consist in chemical substances in food products. The contaminants include for example, pesticides, antibiotics, and toxins. Recently there has been an increasing concern in detection of such contaminants not only for the prevention of public health, but also of the environment.
The currently available methods for detection of chemicals in foods are time consuming, expensive and complex to operate. Hence, is necessary to development other methods to overcome the aforementioned disadvantages.
The main objective of this work was to explore the feasibility of surface-enhanced Raman spectroscopy (SERS) as a sensitive, robust, simple and fast technique for the detection of food contaminants. Therefore, two different types of SERS substrate were developed. One of the substrates had paper as solid support matrix, with wells enclosed by hydrophobic barriers (two paper types were studied, chromatography and office). Nanoparticles (NPs) of silver, spherical and star-shaped, were chemically synthesized and deposited in the wells by drop-casting. The SERS efficiency study highlighted the office paper as the most appropriate support, due to the greater retention of NPs in star-shape on its surface. The detection limit values (LOD) and quantitation (LOQ) for rhodamine 6G (R6G) were 0.17±0.04 and 2.5±0.5 ppb, respectively. This substrate has proven reproducible and stable over time (5 weeks) with relative standard deviations (RSD) of 1.7 % and 7.3 %, respectively.
The second substrate was made by physical vapor deposition (PVD) allowing a layer of spherical NPs. The LOD and LOQ values for R6G were 0.015±0.002 and 1.1±0.2 ppb, respectively. The proof-of-concept study was conducted with malathion and domoic acid (DA) and was not possible to
detect DA. However, the LOD and LOQ for malathion in paper SERS substrate were ≈3944 and ≈1652 ppm respectively, and for the PVD substrate were, ≈925 and ≈5644 ppm, respectively. Both SERS
substrates and their production method, were sensitive, robust, and inexpensive, allowing the rapid detection of analytes.
xi
Resumo
Os contaminantes alimentares consistem em substâncias químicas presentes em produtos alimentares. Como contaminantes alimentares inserem-se por exemplo, os pesticidas, antibióticos e toxinas. Recentemente tem existido uma crescente preocupação na detecção deste tipo de contaminantes não só para prevenção da saúde pública, mas também no meio ambiente.
Os métodos actualmente disponíveis para detecção de substâncias químicas em produtos alimentares são morosos, dispendiosos e complexos de operar. Sendo necessário o desenvolvimento de outros métodos que ultrapassem as desvantagens mencionadas.
Assim, o presente trabalho tinha como objectivo principal explorar a viabilidade da espectroscopia de Raman aumentada pela superfície (SERS) como técnica sensível, robusta, simples e rápida para a detecção de contaminantes alimentares. Deste modo, foram desenvolvidos dois tipos de substratos para aplicação em SERS. Um dos substratos possuía como suporte papel, com poços delimitados por barreiras hidrofóbicas (dois tipos de papel foram estudados, de fotocópia e de cromatografia). Nanopartículas (NPs) de prata, esféricas e em forma de estrela, foram sintetizadas quimicamente e depositadas nos poços por drop-casting. Através da sua performance em SERS determinou-se o papel de fotocópia como sendo o mais apropriado, devido à maior retenção de NPs em forma de estrela na sua superfície. Os valores de limite de detecção (LOD) e de quantificação (LOQ) foram 0,17±0,04 e 2,5±0,5 ppb, respectivamente. Este substrato revelou-se reprodutível e estável ao longo do tempo (5 semanas) com desvios-padrão relativo (RSD) de 1,7 % e 7,3 %, respectivamente.
O segundo substrato foi fabricado por deposição física de vapor (PVD) permitindo formar uma camada de NPs de prata esféricas. Os valores de LOD e LOQ foram, 0,015±0,002 e 1,1±0,2 ppb, respectivamente. O estudo de prova-de-conceito foi realizado com malatião e ácido domóico (DA), não tendo sido possível detectar DA. No entanto, os valores de LOD e LOQ para malatião no substrato de SERS em papel foram ~3944 e ~1652 ppm respectivamente, e no substrato de PVD foram, ~925 e ~5644 ppm, respectivamente. Os substratos e respectivo método de produção, revelaram ser sensíveis, robustos e pouco dispendiosos permitindo a rápida detecção de analitos.
xiii
Contents
ACKNOWLEDGEMENTS ... VII ABSTRACT ... IX RESUMO ... XI CONTENTS ... XIII INDEX OF FIGURES ... XVII INDEX OF TABLES ... XXIII ABBREVIATIONS ... XXV SYMBOLS ... XXVII
CHAPTER 1. INTRODUCTION ... 1
1.1 SURFACE-ENHANCED RAMAN SPECTROSCOPY FOR THE CHEMICAL ANALYSIS OF FOOD ... 1
1.2 SURFACE-ENHANCED RAMAN SPECTROSCOPY ... 2
1.2.1 Electromagnetic enhancement effect ... 3
1.2.2 Chemical Enhancement ... 3
1.2.3 SERS enhancement Factor and hot spots ... 4
1.2.4 SERS substrates: Production methods and features... 4
1.2.4.1 Colloidal nanoparticles ... 5
1.2.4.2 Physical vapour deposition ... 7
1.2.5 Solid support matrix ... 8
1.2.6 Surface functionalization ... 9
1.2.7 Rhodamine 6G as Raman label ... 9
1.3 CHEMICAL CONTAMINANTS IN FOOD ... 10
1.3.1 Shellfish Toxins as food contaminants ... 10
1.3.1.1 Domoic acid as factor for amnesic shellfish poisoning ... 11
1.3.2 Pesticides as food contaminants ... 13
1.3.2.1 Malathion ... 13
1.4 PRACTICAL APPLICATIONS OF SERS ... 14
1.4.1 Applications of SERS in the Chemical Analysis of Food: DA and malathion ... 15
1.4.1.1 DA detection methods based on SERS ... 15
1.4.1.2 Malathion detection methods based on SERS ... 16
1.5 WORK PROPOSAL ... 17
CHAPTER 2. MATERIALS AND METHODS ... 18
2.1 CHEMICALS, MATERIALS AND INSTRUMENTATIONS... 18
2.1.1 Chemical synthesis of citrate capped spherical silver nanoparticles ... 18
2.1.2 Chemical synthesis of citrate capped star-shaped silver nanoparticles ... 18
2.2 FABRICATION OF PAPER AND PVDSERS SUBSTRATES ... 19
2.2.1 Fabrication of paper SERS substrates ... 19
2.2.2 Treatments of the paper SERS substrates ... 22
2.2.3 Fabrication of SERS substrates by physical vapour deposition... 23
2.3 PREPARATION OF SAMPLES FOR SERS MEASUREMENTS ... 24
2.3.1 Rhodamine 6G ... 25
2.3.2 Domoic acid ... 25
2.3.3 Malathion ... 25
2.4 LASER POWER INFLUENCE IN SERS MEASUREMENTS AND MEASURE PARAMETERS OPTIMIZATION ... 25
2.5 REPRODUCIBILITY BETWEEN DIFFERENT SYNTHESIS BATCHES ... 26
2.6 TIME STABILITY STUDY OF THE PAPER SERS SUBSTRATE ... 26
2.7 RESULTS TREATMENT ... 26
2.7.1 Analytical Enhancement Factor calculation ... 26
CHAPTER 3. CHARACTERIZATION TECHNIQUES ... 27
3.1 SCANNING ELECTRON MICROSCOPY ... 27
3.2 ENERGY DISPERSIVE X-RAY SPECTROSCOPY ... 28
3.3 UV-VIS ABSORPTION SPECTROSCOPY ... 28
xiv
3.4 RAMAN SPECTROSCOPY ... 29
CHAPTER 4. PRESENTATION AND DISCUSSION OF RESULTS ... 31
4.1 SYNTHESIS AND CHARACTERIZATION OF SILVER NANOPARTICLES ... 31
4.1.1 Synthesis and Characterization of citrate capped non-aggregated silver nanoparticles by UV-Vis absorption spectroscopy ... 31
4.1.2 Characterization of citrate capped star-shaped silver nanoparticles by UV-Vis absorption spectroscopy……….. ... 35
4.1.3 Scanning electron microscopy ... 36
4.2 RAMAN AND SERS SIGNAL OF RHODAMINE 6G ... 37
4.3 DEVELOPMENT OF PAPER SERS SUBSTRATE ... 39
4.3.1 Hydrophobic barriers production ... 39
4.3.2 Well Impregnation by drop-casting with NPs ... 40
4.4 LASER POWER INFLUENCE IN SERS MEASUREMENTS AND OPTIMIZATION OF THE MEASUREMENT PARAMETERS .. 40
4.5 CHARACTERIZATION OF PAPER SERS SUBSTRATES ... 42
4.5.1 Scanning electron microscopy ... 42
4.5.2 Energy-dispersive X-ray spectroscopy ... 43
4.5.3 Raman Spectroscopy of different types of paper ... 45
4.6 PAPER SERS SUBSTRATES ASSAYS BY RAMAN SPECTROSCOPY ... 48
4.6.1 Paper SERS substrates produced with Whatman no.1 Paper ... 48
4.6.2 Paper SERS substrates produced with office paper ... 50
4.6.3 Enhancement factor between the different paper SERS substrates ... 53
4.6.4 Optimization of paper SERS substrate... 56
4.7 DETECTION AND LIMITS OF DETECTION AND QUANTIFICATION OF SEVERAL ANALYTES ... 57
4.7.1 Rhodamine 6G ... 57
4.7.2 Malathion ... 59
4.7.3 Domoic Acid ... 61
4.8 REPRODUCIBILITY BETWEEN DIFFERENT SYNTHESIS BATCHES ... 64
4.9 TIME STABILITY STUDY OF THE PAPER SERS SUBSTRATE ... 65
4.10 MEASUREMENTS OF SERS SUBSTRATES FABRICATED THROUGH PHYSICAL VAPOUR DEPOSITION METHOD ... 66
4.10.1 Detection and limits of detection and quantification of several analytes ... 67
4.10.2 SERS substrates with double layers of silver nanoparticles ... 72
4.10.3 SERS substrates with nanostars grown or deposited onto a monolayer of PVD silver nanoparticles………. ... 73
CHAPTER 5. CONCLUSION AND FUTURE PERSPECTIVES ... 76
CHAPTER 6. REFERENCES ... 79
APPENDIX ... 87
I. CHEMICALS, MATERIALS AND INSTRUMENTS ... 87
i. Chemicals reagents ... 87
ii. Materials ... 87
iii. Instruments ... 88
II. LASER POWER FROM DIFFERENT FILTERS ... 88
III. DETERMINING DIAMETER AND MOLAR CONCENTRATION OF SPHERICAL CITRATE-CAPPED SILVER NANOPARTICLES IN WATER ACCORDING TO PARAMELLE ET AL. METHOD ... 89
IV. FORMATION MECHANISM OF AG NANOPARTICLES ... 90
V. STUDY THE STABILITY OF THE AGNPS ... 91
A. BY VARIATION OF IONIC STRENGTH ... 91
B. BY VARIATION OF PH VALUE ... 92
VI. DISTRIBUTION OF AGNSS BY THE TWO PAPERS: WHATMAN NO.1 AND OFFICE PAPER. ... 93
xv
VIII. EDS ANALYSIS ON TWO DIFFERENT PAPERS: WHATMAN NO.1 AND OFFICE PAPER ... 95
A. DISTRIBUTION MAP OF THE KEY ELEMENTS IDENTIFIED IN WHATMAN NO.1 PAPER. ... 95
B. DISTRIBUTION MAP OF THE KEY ELEMENTS IDENTIFIED IN OFFICE PAPER... 96
IX. SPECTRA OF R6G WITH SILVER NANOPARTICLES IN WHATMAN NO.1 PAPER ... 97
A. SERS SPECTRA FOR CITRATE CAPPED NON-AGGREGATED SILVER NANOPARTICLES NON-AGGREGATED ... 97
B. SERS SPECTRA FOR CITRATE CAPPED AGGREGATED SILVER NANOPARTICLES ... 98
C. SERS SPECTRA FOR CITRATE CAPPED STAR-SHAPED SILVER NANOPARTICLES ... 99
X. SPECTRA OF R6G WITH SILVER NANOPARTICLES IN OFFICE PAPER ... 100
A. SERS SPECTRA FOR CITRATE CAPPED NON-AGGREGATED SILVER NANOPARTICLES ... 100
B. SERS SPECTRA FOR CITRATE CAPPED AGGREGATED SILVER NANOPARTICLES ... 101
C. SERS SPECTRA FOR CITRATE CAPPED STAR-SHAPED SILVER NANOPARTICLES ... 102
XI. OPTIMIZATION OF PAPER SERS SUBSTRATE ... 102
XII. REPRODUCIBILITY BETWEEN DIFFERENT AGNSS SYNTHESIS BATCHES ... 103
xvii
Index of Figures
Chapter 1. Introduction
Figure 1. 1|Energy diagram representing the (from left to right) IR absorption, elastic Rayleigh scattering and the inelastic anti-Stokes (left) and Stokes (right) Raman scattering with ωinc , ωinc ± ωvib and ωvib reffering to the frequencies of the incident light, the Raman scattered light, and the molecular vibration, respectively (adapted from8,9). ... 2 Figure 1. 2|Illustration of the LSPR effect. LSPR consists in a collective oscillation of conduction electrons in a
coinage metal nanoparticle (NP) which is in resonance with the frequency of incident light.9,17... 3
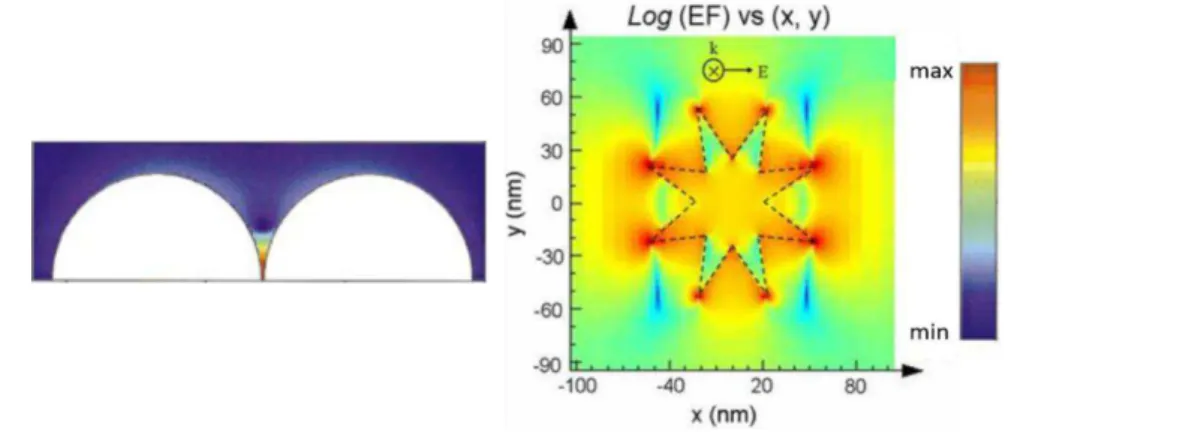
Figure 1. 3|The EM enhancement for dimer configurations of two spheres with a separation of 1 nm (from the left). octagonal star (from the right). The colour scale from dark blue to dark red is logarithmic (adopted from20,21). ... 4 Figure 1. 4|Ultraviolet-Visible (UV-Vis) absorption spectra from non-aggregated and aggregated
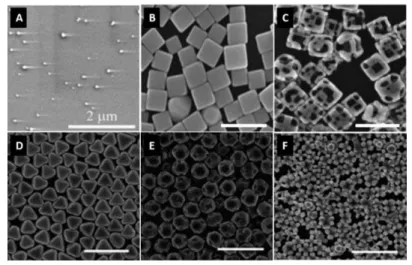
(represented in yellow and red colour, respectively) spherical silver nanoparticles (AgNPs) and star-form silver nanoparticles (AgNSs). ... 6 Figure 1. 5|Scanning electron micrographs of NPs with different morphology. Several examples of SERS-active nanostructures: (a) nanospheres; (b) nanocubes (c) etched nanocubes (d) octahedra (e) etched octahedra (f) octapods (adapted from 22). ... 6 Figure 1. 6|SEM images showing silver nanoparticles (AgNPs) obtained from different Ag mass thicknesses
on the surface of cardboard substrates (adopted from29). ... 7 Figure 1. 7|UV-Vis absorption spectrum of R6G with its molecular structure in the inset. The strong
absorption of R6G in aqueous solution has a maximum around 530 nm and a vibronic shoulder around 470 nm. The molecular structure was adapted from45. ... 9 Figure 1. 8|Chemical structure of the most characteristic shellfish toxins. Marine shellfish toxins can be
divided in two different classes: hydrophilic and lipophilic toxins. Toxins associated with the syndromes amnesic shellfish poisoning (ASP) and paralytic shellfish poisoning (PSP) are hydrophilic and have a molecular weight (MW) below 500 Da. Toxins responsible for neurologic shellfish poisoning (NSP), diarrhetic shellfish poisoning (DSP), have a MW above 600 Da. These toxins are generally called lipophilic marine toxins (adapted from3). ... 10 Figure 1. 9|Molecular structure of DA. Crystalline DA in neutral zwitterionic form (a) and DA with
stereochemistry in the side chain (b). This toxin is denoted as 1’-Z,3’-E,5’-R(-)-domoic acid due to the double bonds at C-1’ and C-3’ are Z and E isomers, and this molecule has R-configuration at C-5’ centre (adapted from 58). ... 12 Figure 1. 10|Molecular mechanism of action from DA. DA can act as an excitatory neurotransmitter binding
to the same specific receptors of glutamic and kainic acid (at the top). The molecular structure of the evolved molecules are represented at the bottom (adopted from52). ... 12
Figure 1. 11|Molecular Structure of malathion (adopted from63). ... 13 Figure 1. 12|The cholinergic synapse and cholinesterase inhibitors. Normally (from the left and centre),
AChE efficiently hydrolyses acetylcholine released by the presynaptic terminal. Upon terminal depolarization, synaptic vesicles containing acetylcholine, release the neurotransmitter into the cleft. When sufficient cholinesterase inhibitors bind to AChE (from the right), ACh accumulates in the synaptic cleft. This leads to persistent stimulation of cholinergic receptors on the postsynaptic cell (adopted from65,66). ... 14 Figure 1. 13|Strategies employed in this work. (A) Paper-SERS substrate: (1) non-aggregated AgNPs; (2)
aggregated AgNPs and (3) AgNSs; and (B) PVD SERS substrate: (1) monolayer of AgNPs; (2) double layers of AgNPs; (3) monolayer of AgNPs with AgNSs linked; (4) growing AgNSs onto a monolayer of AgNPs. ... 17
Chapter 2. Materials and Methods
Figure 2. 1|Patterns design in paper. Scheme of several layers to fabricate the paper surface that supports the SERS substrates. Front view of the paper surface with diameters wells of (A) 5 mm and (B) 3 mm. 20 Figure 2. 2|Scheme of the solid ink printer used to produce the hydrophobic barriers to fabricate SERS
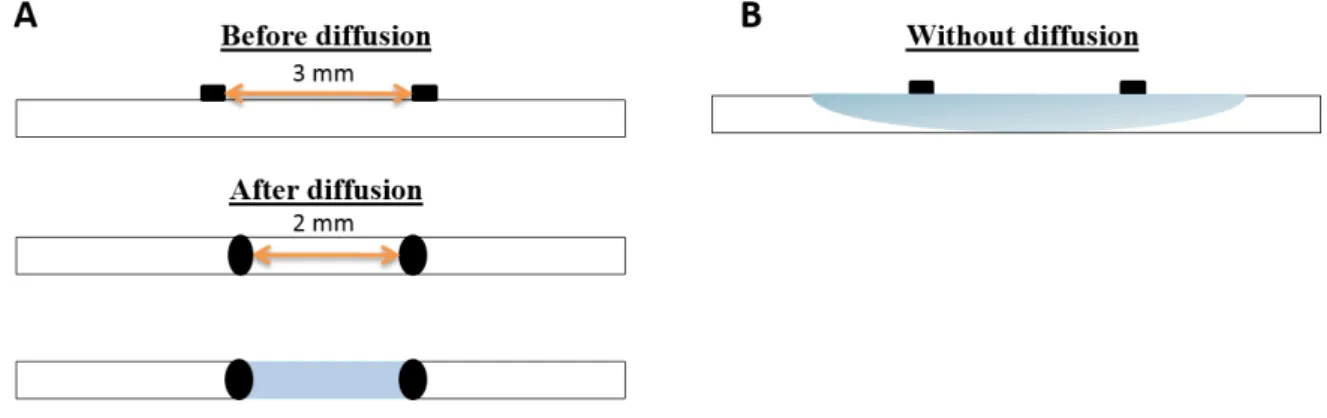
xviii Figure 2. 3|Process diffusion of the wax – producing the hydrophobic barriers. (A) The printing is only at the surface of the paper and to create the wells to hold the NPs, the diffusion as to be promoted by a heating plate. The result is a well with a diameter lower than the original pattern due to diffusion of the wax in all directions ≈0.5 mm (i.e., not only in the thickness of the paper but also laterally) and the liquid (represented in blue) is trapped in the well. (B) Without diffusion, the liquid spreads. ... 21 Figure 2. 4|Drop-castingmethod. (A) Silver NPs deposition with the volume of 50 μL in the well. (B) The
volume of 100 μL was to demonstrate that the well cannot sustain that volume. ... 22 Figure 2. 5|AgNSs on the PVD SERS substrate. (A) NPs fabricated by the PVD method. (B) AgNSs that can be
chemically synthesized or chemically grown as describe in the sections 2.1.2 and 2.2.3.2, respectively; Two different strategies were employed to add chemically synthesized AgNSs to the PVD SERS substrate: (I) use the PVD AgNPs as seeds for the growth of AgNSs; (II) linkage of AgNSs to the original PVD SERS substrates; and (C) linker. ... 23 Figure 2. 6|Chemical structures of the functional linker... 24 Figure 2. 7|Configuration of the scheme used in the SERS assays performed in the paper SERS substrates. On
the left the letters A, B and C represents the volume added of the NPs and the numbers 1-7 on the top corresponds to the concentration of R6G dropped in the well. ... 25
Chapter 3. Characterization Techniques
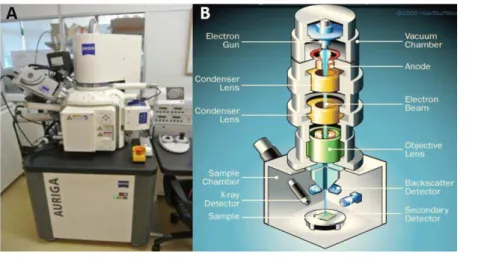
Figure 3. 1|SEM instrument. (A) Apparatus used for SERS measurements; (B) Schematic representation of the functioning of SEM. ... 28 Figure 3. 2|Micro-Raman spectrometer. (A) Apparatus used for SERS experiments; (B) schematic diagram of
typical micro-Raman setup, which uses a microscope objective for illumination and collection,
increasing the spatial resolution of the instrument (adopted from17). ... 30 Figure 3. 3|Optical microscopic images of two places where a SERS spectrum were recorded. (A) One on the
edge of a dried spot in the paper SERS substrate; (B) one local in the PVD SERS substrate – AgNPs (4 nm of thickness) deposited on Si. ... 30
Chapter 4. Presentation and Discussion of Results
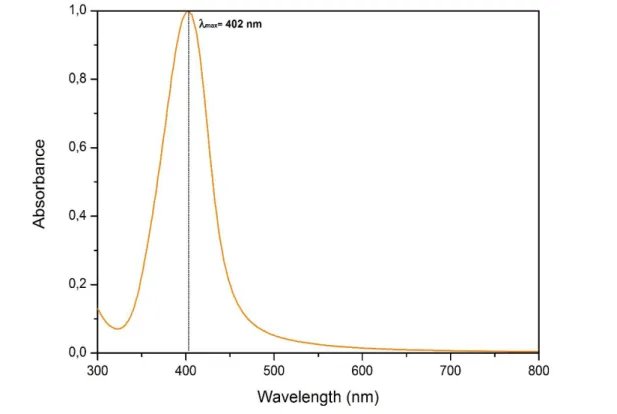
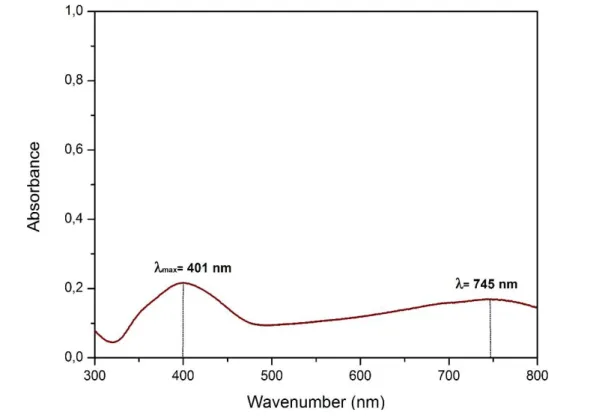
Figure 4. 1|UV-Vis spectrum after a synthesis of AgNPs according to the Bastús et al. method. The AgNPs present a LSPR band centred approximately at 402 nm. ... 32 Figure 4. 2|UV-Vis spectrum after an aggregation with NaCl (50 mM) of AgNPs. The aggregated AgNPs
present two main LSPR bands centred approximately at 401 nm (corresponding to non-aggregated species) and ≈745 nm (a very wide and broad band). ... 34 Figure 4. 3|UV-Vis spectrum of aggregated AgNPs when the pH value reaches 3 through HCl addition. AgNPs
become aggregated due to the neutralization citrate resulting in a spectrum with two main LSPR
bands. One, centred at ≈402 nm (corresponding to non-aggregated species) and a new band at ≈743
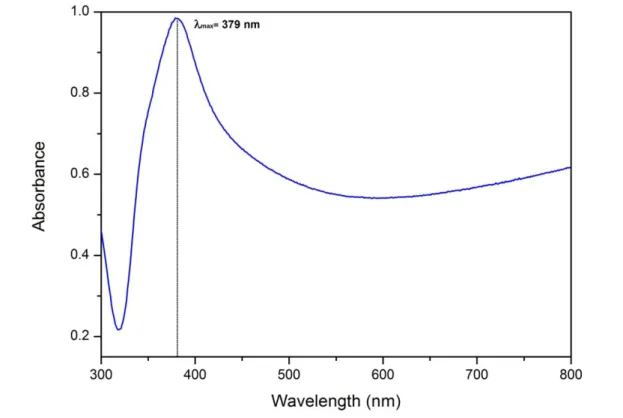
nm (a very wide and broad band). ... 35 Figure 4. 4|UV-Vis spectrum after a synthesis of AgNSs. The AgNSs present a LSPR band centred
approximately at 379 nm and an extinction background at longer wavelengths. ... 36 Figure 4. 5|SEM images of the NPs synthesized for SERS substrates and the corresponding UV-Vis spectrum
above each image. (I) UV-Vis spectrum of non-aggregated AgNPs and (A) is the corresponding SEM image; (II) the UV-Vis spectrum and (B) SEM image of aggregated AgNPs; (III) UV-Vis spectrum and (C) SEM image of AgNSs. ... 37 Figure 4. 6|Raman and SERS spectrum of R6G. (a) Raman spectrum of 10-3 M R6G aqueous solution (x10
magnified) and (b) SERS spectrum of 10-6 M R6G adsorbed on AgNSs on office paper under 632.8 nm laser excitation. Since there was not vibration shifts from the others SERS substrates (e.g. PVD SERS substrates), there were not represented. ... 38 Figure 4. 7|Optical microscopic images illustrating the consequences of not proceeding to the wax diffusion
(paper cross sections). The printing is only at the surface of the paper and to create the wells to control the NPs solution the wax diffusion needs to be promoted by a heating plate. Paper with (a), and without (b) wax diffusion... 39 Figure 4. 8|Spectral features of 10-5 M R6G as function of the irradiation laser power under stationary
xix Figure 4. 9|SEM images of AgNPs in the two types of papers: (A) Whatman no.1 and (B) office. From the top to the bottom of the figure, the volume added onto the paper well increases from (1) 100 µL, (2) 300 µL and (3) 500 µL. For higher volumes added, more NPs are observed in the paper surface regardless of the type of paper. However, for office paper, the necessary amount to cover the same area of the paper surface is much lower than for Whatman no.1 paper. ... 42 Figure 4. 10|SEM image of a well with aggregated AgNPs. It shows several salt crystals preventing their
visualization. ... 43 Figure 4. 11|EDS analysis of the paper SERS substrates. Cumulative spectra of the EDS analysis of the
Whatman no.1 paper (represented in green) and office paper (represented in blue) after deposition of AgNSs. The chemical symbols on the top of each peak represent the corresponding element identified by the EDS technique and the intensity is indicative of the relative quantity of the elements. ... 44 Figure 4. 12|SEM image of the cross section of paper SERS substrate in both papers: (A) Whatman no.1
paper and (B) office paper; and EDS analysis showing the presence of the Ag element along the thickness of the papers: (C) The Ag can be seen through all the thickness of the Whatman no.1 paper although more concentrate at the surface. (D) Conversely, the Ag is observed nearly only the surface of the office paper. ... 45 Figure 4. 13|Whatman no.1 Raman spectrum. The regions that represent cellulose bonding vibrations are in
grey colour. On the top of the grey area are indicated the type of vibrational modes. The chemical structure (chain conformation) of two unit of cellulose is display in the inset (adapted from39). ... 46 Figure 4. 14|Office paper Raman spectrum. The regions that represent cellulose bonding vibrations are
represented in grey colour and in blue colour are the chemical additives added during paper making process. The inset display the CaCO3 band. ... 47 Figure 4. 15|R6G SERS spectra in wells of 4 mm diameter with 500 µL of AgNSs drop-casted in Whatman
no.1 paper. (a) well without the R6G, i.e., 500 µL AgNSs in Whatman no.1 paper; same well conditions however, with several R6G concentrations added: (b) 10-9 M; (c) 10-8 M; (d) 10-7 M; (e) 10-6 M; (f) 10-5 M; (g) 10-4 M; and (h) 10-3 M; signal of R6G appears only starting from wells with the concentration of (d) 10-7 M. ... 48 Figure 4. 16|Increase of Raman intensity and area of the R6G bands as the amount of NPs deposited in the
well increases. The concentration 10-5 M of R6G was chosen to represent. (A) are represented the spectra of non-aggregated AgNPs and (B) the spectra obtained from aggregated AgNPs and finally (C) are the data of AgNSs. The scale of intensity in (A) and (B) is 0-14 000 a.u. and in (C) is 0-27 500 a.u. .. 50 Figure 4. 17|R6G SERS spectra in wells of 4 mm diameter with 500 µL of AgNSs drop-casted in office paper:
(a) well without the R6G, i.e., 500 µL AgNSs in Whatman no.1 paper; same well parameters and with several R6G concentrations added: (b) 10-9 M; (c) 10-8 M; (d) 10-7 M; (e) 10-6 M; (f) 10-5 M; and (g) 10-4 M; The R6G at concentration of 10-3 M could not be observed due signal saturation; ... 50 Figure 4. 18|Increase of Raman intensity and area of the R6G bands as the amount of NPs deposited in the
well increases. The concentration 10-5 M of R6G was chosen to represent. (A) are represented the spectra of non-aggregated AgNPs and (B) the spectra obtained from aggregated AgNPs and finally (C) are the data of AgNSs. The scale of intensity in (A) and (B) is 0-30 000 a.u. and in (C) is 0-60 000 a.u. .. 51 Figure 4. 19|Raman spectrum of citrate and an example of a SERS spectrum with the observed anomalous
bands. (A) Raman spectrum of SC (2.2 mM). Regions representative of citrate bonding vibrations are in grey colour. On the top of the grey area are indicated the type of vibrational modes. The chemical structure of citrate is displayed in the inset (adapted from115). (B) The anomalous bands outlined above are represented and show similar correspondence with Raman spectrum of citrate. ... 52 Figure 4. 20|AEF values from the paper SERS substrates produced: (A) in Whatman no.1 paper and (B) office
paper. The yellow histograms represent the results from non-aggregated AgNPs, in red are presented the aggregated AgNPs outcomes and finally, in blue are the AEF values from AgNSs. Each AEF value represented in the histogram is an average of three calculated values from three different locations of the SERS substrates with their respective SD. ... 54 Figure 4. 21|SERS spectra of the wells submitted to several treatments onto the paper SERS substrates with
xx Figure 4. 22|Correlation between SERS band areas and logarithmic R6G concentration. Plots of analytical area versus R6G concentration for the band at 1509 cm−1. Data is fitted using the Langmuir isotherm. Each data point represents the average value from three SERS spectra. Error bars show the SD. ... 58 Figure 4. 23|Raman spectrum of malathion. The regions that represent the main malathion vibrations are in
grey bars. On the top of the grey area are indicated the type of vibrational modes. The chemical structure of malathion is display in the inset (adapted from121). ... 59 Figure 4. 24|Malathion SERS spectra in the optimized paper SERS substrates. (a) well without malathion,
i.e., 62.5 µL AgNSs in office paper; (b) pure malathion Raman spectrum (3.72 M). Same experimental conditions with several malathion concentrations added: (c) 1.5x10⁻² M; (d) 2x10⁻² M; (e) 2.5x10⁻² M; (f) 3x10⁻² M; (g) 3.5x10⁻² M; and (h) 3x10⁻¹ M; (i) 3.72 M... 60 Figure 4. 25|Correlation between SERS band areas and malathion concentrations. Plots of analytical area
versus malathion concentration for the band at 653 cm−1. Each data point represents the average value from three SERS spectra. Error bars show the standard deviations. ... 61 Figure 4. 26|Raman spectrum of DA. The regions that represent the main DA vibrations are in grey colour.
On the top of the grey area are indicated the type of vibrational modes. The chemical structure of DA is display in the inset (adapted from58). ... 62 Figure 4. 27|SERS assay of DA on paper SERS substrate. (a) well without DA, i.e., 62.5 µL AgNSs in office
paper; (b) Raman spectrum of DA (one crystal). (c) SERS spectrum of 10-2 M DA in paper SERS substrate. The characteristic band at 1653 cm-1 was observed and the citrate bands appear in the region 1200-1400 cm-1. ... 64 Figure 4. 28|Reproducibility of paper SERS substrate. (A) Area distribution of the 1509 cm-1 band in the
spectra versus the number of batches. Each data point represents the average value from three SERS spectra measured at the vicinity of each spot. The yellow bar represents the relative standard-deviation (RSD = 1.7 %). (B) SERS spectra of 10−9 M R6G recorded from the optimized SERS substrate fabricated by three different batches of AgNSs colloidal solution. The intensity increase is represented by a colour code, from red to blue. ... 65 Figure 4. 29|Stability of SERS substrate. (A) Area distribution of the 1509 cm−1 band in the spectra versus stored time (5 weeks). Each data point represents the average value from three SERS spectra measured at the vicinity of each spot. The yellow bar shows the relative standard deviation (RSD = 7.3 %). (B) SERS spectra of 10−9 M R6G recorded from the optimized SERS substrate stored for 5 weeks under at 4
°C in a desiccator. The intensity increase is represented by a colour code, from red to blue. ... 66 Figure 4. 30|R6G SERS spectra in PVD SERS substrate. (a) Substrate without R6G, i.e., 6 nm of AgNPs (with
60 nm per particle) in crystalline silicon; same conditions and with several R6G concentrations added: (b) 10-9 M; (c) 10-8 M; (d) 10-7 M; (e) 10-6 M; (f) 10-5 M; (g) 10-4 M; and (h) 10-3 M; ... 67 Figure 4. 31|Enhancement Factor values from the PVD SERS substrates. Each AEF value represented in the
histogram is an average of three calculated areas values from three different locations of the SERS substrate with their respective SD. ... 68 Figure 4. 32|Correlation between SERS band areas and R6G concentrations. Plots of analytical area versus R6G concentration for the band at 1509 cm−1. Each data point represents the average value from three SERS spectra. Error bars show the standard deviations. ... 69 Figure 4. 33|Malathion SERS assay in PVD SERS substrate. (a) Substrate without malathion, i.e., 6 nm of
AgNPs (with 60 nm per particle) in crystalline silicon; (b) Raman spectrum of 3,72 M malathion with 660 µM of laser power. Same conditions and with several malathion concentrations added: (c) 1.5x10⁻² M; (d) 2x10⁻² M; (e) 2.5x10⁻² M; (f) 3x10⁻² M; (g) 3.5x10⁻² M; and (h) 3x10⁻¹ M; (i) 3.72 M. The characteristic band at 653 cm-1 was observed along with others distinctive bands. However, there are still slight interferences from the PVD SERS substrate. ... 70 Figure 4. 34|Correlation between SERS band areas and malathion concentrations. Plots of analytical area
versus malathion concentration for the band at 653 cm−1. Each data point represents the average value from three SERS spectra. Error bars show the SD. ... 71 Figure 4. 35|SERS assay of DA on PVD SERS substrate. (a) Substrate without DA, i.e., 6 nm of AgNPs (with 60
nm per particle) in crystalline silicon; (b) Raman spectrum of DA (one crystal). SERS spectra of (c) 10-3 M and (d) 10-2 M DA in the SERS substrate. The characteristic band at 1653 cm-1 was observed along with others distinctive bands. However, there are still slight interferences from the PVD SERS substrate. .. 72 Figure 4. 36|AEF values from PVD SERS surfaces composited by a double layer of AgNPs with 6 nm of thick
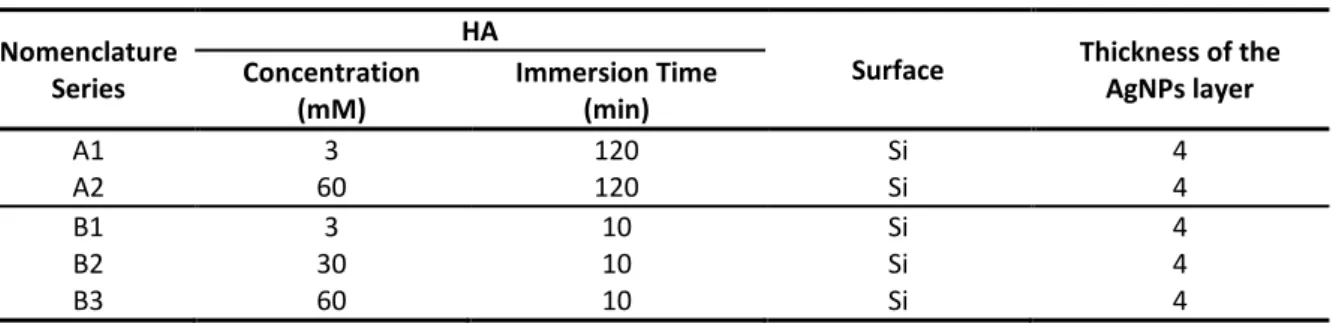
xxi AgNPs with 6 nm to serve as control of those previously referred. In yellow are represented the data obtained in cardboard packaging substrate, in blue are the substrates produced in glass and in last the data acquired from the original PVD SERS surface in green. ... 73 Figure 4. 37|AEF values from surfaces where growth of NPs fabricated by PVD method into AgNSs was
performed. In (I) the concentration of HA was tested and in (II) was the immersion time of the original PVD SERS surface in the solution of HA. Control: monolayer of AgNPs. ... 74 Figure 4. 38|Enhancement Factor values from surfaces where linkage of AgNSs to the original PVD SERS
surface was performed. In (I) the linker concentration was tested and in (II) was the AgNSs concentration deposited in the original PVD SERS surface. Control: monolayer of AgNPs. ... 75
Appendix
Figure III. 1|Comparison of absorbance peaks for silver nanoparticles obtained experimentally (black) and according with Mie theory (blue) (on the left). For determining molar concentration of spherical citrate-capped silver nanoparticles in water using nanoparticle size (on the right) (adapted from93). .. 89
Figure IV. 1|(1) Oxidation. Oxidation of the phenolic hydroxyls of TA to form quinone form. (2) Reduction. The quinone form of TA, allows a donation of two electrons for the reduction of Ag+ precursor. (3) Speciation. Production of Ag0 and further formation of Ag2+. (4) Complexation. Formation of complex between TA and the new spice, Ag2+. (5) Dimerization. This phenomenon depends on the TA concentration, higher TA concentrations leads to an increase in the complexation and consequently, the rate of nucleation slows, (6) which leads to the formation of larger Ag NPs with irregular sizes. When TA is in low concentrations (5), the reduction is fast leading to a (6) rapid nucleation and hence, to small monodisperse AgNPs (adapted from83). ... 90
Figure V. 1|UV-Vis spectra of AgNPs obtained using different NaCl concentrations. The CCC achieved was 50 mM – red spectrum. The aggregated AgNPs present two main LSPR bands centred approximately at 401 nm with a narrower bandwidth and a new and progressively broadening band at ≈743 nm.... 91 Figure V. 2|UV-Vis spectra of AgNPs obtained by different pH values. The aggregated AgNPs present two
main LSPR bands centred approximately at 401 nm with a narrower bandwidth and a new and progressively broadening band at 743 nm. ... 92
Figure VI. 1|SEM images of AgNSs in the two types of papers: Whatman no.1 (on the left) and office (on the right) paper to evaluate their distribution. From the top to the bottom of the figure, the volume added onto the paper well increases being 100 µL (on the top), 300 µL (on the middle) and 500 µL (on the bottom). The SEM images show that for higher volumes added, more NPs can be seen on the paper surface regardless of the type of paper. However, for office paper, the necessary amount to cover the same area of the paper surface is much lesser than for Whatman no.1 paper. ... 93
Figure VII. 1|SEM image of the surface morphology of paper substrates used to support the development of substrate for SERS. Due to its composition, manufacturing process and purpose, there are differences in the morphology of the two paper surfaces. The high fiber density of the office paper enables obtaining a more uniform surface and therefore an evenly distribution of NPs and over the surface. . 94
Figure VIII. 1|(A) SEM image of a well corresponding to the paper SERS substrate in Whatman no.1 paper. Results from EDS analysis of a cross section of the paper for the (B) silver; (C) carbon and (D) oxygen elements. The Ag element is observed along the thickness of the paper. The carbon and oxygen elements are the main constituents of this paper substrate, so the images display the fibers in the image of SEM.95
Figure VIII. 2|(A) SEM image of a well corresponding to the paper SERS substrate in office paper. Results from EDS analysis of a cross-section of the paper for the (B) silver; (C) carbon and (D) oxygen elements. The Ag element is observed nearly only the surface of the office paper. The carbon and oxygen elements are the main constituents of this paper substrate, so the images display the fibers in the image of SEM. ... 96
xxii Whatman no.1 paper; same well conditions and with several R6G concentrations added: (b) 10-9 M; (c) 10-8 M; (d) 10-7 M; (e) 10-6 M; (f) 10-5 M; (g) 10-4 M; and (h) 10-3 M. ... 97 Figure IX. 2|R6G SERS spectra in wells of 4 mm diameter with aggregated AgNPs: (A) 100; (B) 300 and (C) 500
µL drop-casted in Whatman no.1 paper. For all the sets of SERS spectra the corresponding legend is: (a) well without the R6G, i.e., with the 100, 300 or 500 µL of aggregated AgNPs in Whatman no.1 paper; same well conditions and with several R6G concentrations added: (b) 10-9 M; (c) 10-8 M; (d) 10-7 M; (e) 10-6 M; (f) 10-5 M; (g) 10-4 M; and (h) 10-3 M. ... 98 Figure IX. 3|R6G SERS spectra in wells of 4 mm diameter with AgNSs: (A) 100 and (B) 300 µL drop-casted in
Whatman no.1 paper. For all the sets of SERS spectra the corresponding legend is: (a) well without the R6G, i.e., with the 100 or 300 µL of AgNSs in Whatman no.1 paper; same well conditions and with several R6G concentrations added: (b) 10-9 M; (c) 10-8 M; (d) 10-7 M; (e) 10-6 M; (f) 10-5 M; (g) 10-4 M; and (h) 10-3 M. ... 99
Figure X. 1|R6G SERS spectra in wells of 4 mm diameter with non-aggregated AgNPs: (A) 100; (B) 300 and (C) 500 µL drop-casted in office paper. For all the sets of SERS spectra the corresponding legend is: (a) well without the R6G, i.e., with the 100, 300 or 500 µL of non-aggregated AgNPs in office paper; same well conditions and with several R6G concentrations added: (b) 10-9 M; (c) 10-8 M; (d) 10-7 M; (e) 10-6 M; (f) 10-5 M; (g) 10-4 M; and (h) 10-3 M. ... 100 Figure X. 2|R6G SERS spectra in wells of 4 mm diameter with aggregated AgNPs: (A) 100; (B) 300 and (C) 500
µL drop-casted in office paper. For all the sets of SERS spectra the corresponding legend is: (a) well without the R6G, i.e., with the 100, 300 or 500 µL of aggregated AgNPs in office paper; same well conditions and with several R6G concentrations added: (b) 10-9 M; (c) 10-8 M; (d) 10-7 M; (e) 10-6 M; (f) 10-5 M; (g) 10-4 M; and (h) 10-3 M. ... 101 Figure X. 3|R6G SERS spectra in wells of 4 mm diameter with AgNSs: (A) 100; (B) 300 and (C) 500 µL drop-casted in office paper. For all the sets of SERS spectra the corresponding legend is: (a) well without the R6G, i.e., with the 100, 300 or 500 µL of non-aggregated AgNSs in office paper; same well conditions and with several R6G concentrations added: (b) 10-9 M; (c) 10-8 M; (d) 10-7 M; (e) 10-6 M; (f) 10-5 M; (g) 10-4 M; and (h) 10-3 M. ... 102
Figure XI. 1|SERS spectra of malathion deposited on the wells submitted to treatments (a) 1 mM FeCl2 and (b) 2 M HCl. For both spectra the signal from malathion did not had be demonstrated. ... 102
Figure XII. 1|Reproducibility of SERS substrate (office paper with AgNSs drop-casted). (A) Area distribution of the 1509 cm-1 band in the spectra versus the number of batches. Each data point represents the average value from three SERS spectra measured at the vicinity of each spot. The yellow region shows the relative standard deviation (RSD = 4.4 %). (B) SERS spectra of 10−7 M R6G recorded from the optimized SERS substrate fabricated by three different batches of AgNSs colloidal solution. ... 103 Figure XII. 2|Reproducibility of SERS substrate (office paper with AgNSs drop-casted). (A) Area distribution
of the 1509 cm-1 band in the spectra versus the number of batches. Each data point represents the average value from three SERS spectra measured at the vicinity of each spot. The yellow region shows the relative standard deviation (RSD = 9.6 %). (B) SERS spectra of 10−8 M R6G recorded from the optimized SERS substrate fabricated by three different batches of AgNSs colloidal solution. ... 103
Figure XIII. 1|Stability of SERS substrate (office paper with AgNSs drop-casted). (A) Area distribution of the 1509 cm−1 band in the spectra versus stored time (5 weeks). Each data point represents the average value from three SERS spectra measured at the vicinity of each spot. The yellow region shows the RSD (RSD = 10.7 %). (B) SERS spectra of 10−6 M R6G recorded from the optimized SERS substrate stored over a number of weeks under at 4ᵒC in a desiccator. ... 104 Figure XIII. 2|Stability of SERS substrate (office paper with AgNSs drop-casted). (A) Area distribution of the
xxiii
Index of Tables
Chapter 1. Introduction
Table 1. 1|Examples of solid support matrix for SERS substrates with associated advantages and disadvantages.21 ... 8 Table 1. 2|Syndromes of shellfish poisoning principal features with concentration levels allowed in shellfish,
define by EU regulations. Toxicity values for DSP and NSP, both concentrations are referred to intraperitoneal administration. List of official detection methods for the most characteristic toxins. (adapted from3,55–57) ... 11
Chapter 2
.
Materials and MethodsTable 2. 1|Volumes added to each well depending on well diameter. ... 21 Table 2. 2|Summary of the treatments performed on the paper SERS substrates to remove or oxide the citrate, the capping agent of the silver NPs used in this type of substrate. ... 22 Table 2. 3|Samples analysed produced by growing AgNSs onto a monolayer of AgNPs – PVD SERS substrate. ... 24 Table 2. 4|Samples analysed produced by depositing AgNSs onto a monolayer of AgNPs – PVD SERS
substrate. ... 24
Chapter 3. Characterization Techniques
Table 3. 1|List of the samples with different conditions studied by SEM. ... 28
Chapter 4. Presentation and Discussion of Results
Table 4.1|Vibrational bands assignments for R6G.44,105 ... 39 Table 4. 2|Vibrational bands assignments for Whatman no.1 paper.109,113,114 ... 46 Table 4. 3|Summarized results from paper SERS substrates produced with Whatman no.1 paper (4 mm of
well diameter). Results obtained with different NPs volumes: 100, 300 and 500 µL; of the 3 morphology types of NPs: non-aggregated (yellow) and aggregated (red) AgNPs, and AgNSs (blue). The last table line is the corresponding set of R6G spectra. ... 49 Table 4. 4|Summarized results from paper SERS substrates produced with office paper (4 mm of well
diameter). Results obtained with different NPs volumes: 100, 300 and 500 µL; of the 3 morphology types of NPs: non-aggregated (yellow) and aggregated (red) AgNPs, and AgNSs (blue). The last table line indicates the corresponding figure of set of R6G spectra. ... 51 Table 4. 5|Vibrational bands assignments for citrate and correspondences to the observed anomalous
bands.98,118 ... 53 Table 4. 6|Summary of the treatments performed on the paper SERS substrates to remove or oxidize the
citrate, the capping agent of the AgNSs used in this type of substrate. ... 56 Table 4. 7|Vibrational bands assignments for malathion.76,124 ... 59 Table 4. 8|Raman spectroscopic data with assignments for DA.12,52,60,79 ... 63 Table 4. 9|Samples analysed produced by growing AgNSs onto a monolayer of AgNPs - PVD SERS substrate. ... 74 Table 4. 10|Samples analysed produced by depositing AgNSs onto a monolayer of AgNPs. The concentration
xxv
Abbreviations
AChE Acetylcholinesterase
AEF Analytical enhancement factor AgNO3 Silver nitrate
AgNPs Citrate capped-spherical silver nanoparticles
AgNSs Silver nanostars
Al2Si2O5(OH)4 Hydrated silicate aluminium
ASP Amnesic shellfish poisoning
CaCO3 Calcium carbonate
cAMP Cyclic Adenosine Monophosphate CCC Critical coagulation concentration
CCD Charge-couple device
CE Chemical enhancement
CIPAC Collaborative international pesticides analytical council
Cl- Chloride anion
DA Domoic acid
DCDR Drop coating deposition Raman
DLVO Derjaquian, Landau, Verwery, Overbeek
DNT Dinitrotoluene
DT Decanethiol
EBL Electron beam lithography
EDS Energy dispersive X-ray spectroscopy
EF Enhancement factor
ELISA Enzyme-linked immunosorbent assay
EM Electromagnetic enhancement
EPA Environmental Protection Agency
EU European Union
FDA Food and Drugs Administration
FeCl2 Iron chloride
FIB Focused ion beam
FON Film over nanospheres
GC-FID Gas chromatography with flame ionisation detection H2O2 Hydrogen peroxide
H2O Water
HA Neutral hydroxylamine
HAB Harmful algal bloom
HCl Hydrochloric acid
HPLC High performance liquid chromatography
IR Infrared
LC/GC.MS Liquid or gas chromatography - mass spectrometry
LOD Limit of detection
LOQ Limit of quantification
LSPR Localized surface plasmon resonance
min Minute
xxvi
MW Molecular weight
NaCl Sodium chloride
NaOH Sodium hydroxide
NIBR National Institute for Biological Resources
NMDA N-methyl-D-aspartate
NP Nanoparticle
NSL Nanosphere lithography
NSP Neurologic shellfish poisoning
OP Organophosphate
POC Point-of-care
PSP Paralytic shellfish poisoning PVD Physical vapour deposition
R6G Rhodamine 6G
ROS Reactive oxygen species
SC Sodium citrate
SEM Scanning electron microscopy
SERS Surface-enhanced Raman spectroscopy
SERRS Surface-enhanced resonance Raman spectroscopy SM-SERS Single molecule observation in SERS
STX Saxitoxin
TA Tanic acid
TaO Tantalum oxide
xxvii
Symbols
A Absorbance
Al Aluminium
Ag Silver
Au Gold
b Path length of light
c Molar concentration
C Carbon
Ca Calcium
cm Centimetres
d Diameter
E Energy
Ɛ Extinct coefficient
Ɛ(M-1cm-1) Molar extinction coefficient value
Einc Incident electric field strength
Eloc Local electric field
g Grams
h Hour
Ir Iridium
ISERS SERS intensity
KeV Kilo-electron-Volt
M Molar
mbar Milibar
min Minute
mL Militers
mM Milimolar
nm Nanometres
nM Nanomolar
O Oxygen
°C Celsius degrees
Si Silicon
s Second
ωinc - ωvib Stokes Raman shifted radiation ωinc Incident radiation
1
Chapter 1. Introduction
1.1
Surface-enhanced Raman Spectroscopy for the chemical analysis of
food
Recent food safety incidents of chemical residues in food have driven an increasing attention about food safety and human health protection. These concerns led toward the development of methods to detect those food hazards.1
The detection of food contaminants (e.g. toxins and pesticides) in real-food matrices usually involve analysis methods that may be generally divided into:
1. Biological techniques (i.e. bioassays and immunological);
2. Analytical methods (i.e. high performance liquid chromatography, HPLC).
Biological techniques such as bioassays require the use of expensive reagents, are laborious (requires a large number of cells/animals to obtain statistical significance) and, time and sample consuming making them impractical for on-site applications.2 Moreover, these methods have poor
repeatability and the animal welfare concerns have encouraged researchers to search for alternative methods of detection.3 As a possible alternative to the mouse bioassay, the immunological analysis
provides high sensitivity inherent to the affinity interactions accomplished between antibodies-antigens (e.g. Enzyme-linked immunosorbent assay, ELISA). Although ELISA allow robustness and rapid results without requiring sophisticated equipment nor skilled personnel, it is not easy to detect several types of toxins within the same group or derivative-pesticides. In spite of all these efforts, a need still remains in terms of fast, on-site quantitative analysis procedure for food contaminants.3–5
Analytical techniques include chromatographic techniques, such as, HPLC, liquid or gas chromatography-mass spectrometry (LC/GC-MS) and others couple techniques. These methods allow high sensitive detection and quantification limits below the levels concern in food and strong specificity. GC and HPLC are the gold standard analytical tools that are extensively used in food analysis. Nevertheless, these well-established methods are known as non-environmentally friendly methodologies requiring expensive equipment, expert technicians, laboratory-based processing, and the lack of suitability for large-scale screening.3,6
Seafood and crops in general have to be marketed promptly after harvesting and the tests results should be available before the shellfish and fruit are sold to public. The several limitations in detecting and properly response, only emphasize the importance of implementing innovative and reliable detection methods. Consequently, the detection tests are not routinely performed on these products sold to market.
An alternative promising technique in chemical quantitative detection is the surface-enhanced Raman spectroscopy (SERS). This methodology has been recently applied in food analysis due the need for a rapid sensitive tool for the detection of food contaminants. The potential of SERS can be readily seen by a comparison between SERS and HPLC, where SERS achieved a higher sensitivity. Moreover, most used chemical methods for food hazards detection require prior separation from proteins and many other potential interfering substances, which tends to increase the cost and time of analysis.2,7 Furthermore, although progress is needed to obtain reproducible results, SERS is
2
1.2
Surface-Enhanced Raman Spectroscopy
In the early 20th century two vibrational spectroscopy methods appear, infrared (IR) and Raman.
Both techniques developed as rapid and nondestructive tools in material identification. IR spectroscopy is based on vibrational transitions induced by absorption of light in the IR spectral region. Raman spectroscopy consists in the scattering of photons by molecules rather than on the absorption of photons. More precisely, in an inelastic scattering of a photon from a molecule in which the frequency changes precisely matching the difference in vibrational energy levels (Figure 1. 1).8
Figure 1. 1|Energy diagram representing the (from left to right) IR absorption, elastic Rayleigh scattering and the inelastic anti-Stokes (left) and Stokes (right) Raman scattering with 𝝎𝒊𝒏𝒄 , 𝝎𝒊𝒏𝒄± 𝝎𝒗𝒊𝒃 and 𝝎𝒗𝒊𝒃 reffering to the frequencies of the incident light, the Raman scattered light, and the molecular vibration, respectively (adapted from8,9).
Raman spectroscopy has less interference from water10 making it a great approach for
biological molecules. However, it yields very weak signals, where only 1 in 106–1010 photons will be
inelastically scattered at frequencies related to the vibrational energies within the analyte molecule.11 Hence, Raman allows a sensitive qualitative or quasi-quantitative analysis and the
structural characterization for trace analyte.12 Also, Raman spectroscopy has fluorescence
interference, and the high cost of equipment makes it less widely used.1
The disadvantageous aforementioned were surpassed by the phenomenon of SERS first reported in 1974 by Fleischmann et al..10 This event was observed in a pyridine adsorbed on a
roughened silver (Ag) electrode. The increase in the Raman cross-section of the molecule, was due to an electromagnetic environment in electrochemically roughened surfaces, and not caused by higher surface area for the pyridine adsorb.13,14 Afterwards, in 1997 the single molecule observation
in SERS (SM-SERS) owed to the demonstration of a strong signal of Raman scattering was the most prominence event.15,16
The SERS phenomenon consist in a surface-selective effect in which the scattering of molecules near metal nanostructures generate high local electric fields that are responsible for the extensively increased signal strength observed in SERS, presenting an advantage to the normal Raman scattering.9
3
1.2.1
Electromagnetic enhancement effect
The interaction between light and metal nanostructures involves a resonant elastic light scattering of a metal nanostructure leading to an increased local electric field in the vicinity of the metal particle. In more detail, the electromagnetic wave, at a certain angular frequency, excite resonantly the delocalized conduction electrons in a metal - named plasmas oscillations. These plasmons, are considered a quasiparticle in which the dielectric functions of the metal and the surrounding medium are among the parameters that influences the resonance frequency. Resonant excitation leads to a charge separation or, in other words, to a dipolar localized surface plasmon resonance (LSPR) (Figure 1. 2). The polarizability of the metal sphere and the incident electric field strength can determine the magnitude of the induced dipole, altering periodically the sign in congruence with the angular frequency of the incoming electromagnetic wave. Consequently, the nanostructure can emit radiation at the same frequency, acting as an antenna.9
Figure 1. 2|Illustration of the LSPR effect. LSPR consists in a collective oscillation of conduction electrons in a coinage metal nanoparticle (NP) which is in resonance with the frequency of incident light.9,17
1.2.2
Chemical Enhancement
CE originates from the direct interaction between the adsorbed molecule and the metal surface, resulting in a charger transfer. It is attributed to the increase in the probability of a Raman transition when the local electric field at the surface of the metal sphere leads to a dipole in the molecule near this surface. The vibrating molecule with angular eigenfrequency has Rayleigh, Stokes and anti-Stokes Raman scattering as dipole components. This mechanism is limited to the first layer of adsorbed moleculesdue to the required direct adsorbate-surface interaction, therefore the smaller enhancement compared to the EM.18
The frequency-shifted radiation at Stokes Raman scattering in the molecule can excite a LSPR of the metal colloid and, in turn, the metal sphere emits radiation by elastic light scattering. To occur the SERS enhancements, the incoming radiation at 𝜔𝑖𝑛𝑐 and the Stokes Raman shifted radiation at
𝜔𝑖𝑛𝑐− 𝜔𝑣𝑖𝑏, have to be in resonance with the plasmon peak of the metal nanostructure.9
In short, SERS intensity (𝐼𝑆𝐸𝑅𝑆) depends in the incident (𝐸𝑖𝑛𝑐(𝜔𝑖𝑛𝑐)), and in the outgoing field (𝐸(𝜔𝑖𝑛𝑐− 𝜔𝑣𝑖𝑏)):
𝐼𝑆𝐸𝑅𝑆 = 𝐼𝑖𝑛𝑐(𝜔𝑖𝑛𝑐)𝐼(𝜔𝑖𝑛𝑐− 𝜔𝑣𝑖𝑏) = |𝐸𝑖𝑛𝑐(𝜔𝑖𝑛𝑐)|2 |𝐸(𝜔𝑖𝑛𝑐− 𝜔𝑣𝑖𝑏)|2≈ |𝐸|4 (Equation 1.1)
4
1.2.3
SERS enhancement Factor and hot spots
The increased signal strength observed in SERS comparative to normal Raman scattering is a consequence of high local electric fields.
SERS enhancement factor (EF) is used to quantifying the overall signal enhancement by comparing two signals: (1) average SERS signal for the adsorbed molecule on metal surface; (2) normal Raman signal of the same molecule but in solution. The two signals are normalized to the corresponding number of molecules on the surface (1) and in solution (2).19
It was verified that when the nanogap between two particles is decreased in a strict control, the SERS signal increases, and it can be observed extremely strong EFs (>109) enabling the detection
of trace analytes. Hence, SERS is a highly distance-dependent phenomenon, and these intensely localized regions, named hot spots can occur not only in the gap of two spheres, but also at sharps and tips (which led to the development of TERS) (Figure 1. 3). However, besides the geometric form of the particles, the probability of finding a molecule in a hot spot is very diminutive being more likely to detect a molecule experiencing moderate enhancements (≈103) on the surface of one
particle. When N spheres are surrounding a single central sphere, the number of hot spots is linear with the total number of spheres (i.e. N+1).9
Figure 1. 3|The EM enhancement for dimer configurations of two spheres with a separation of 1 nm (from the left). octagonal star (from the right). The colour scale from dark blue to dark red is logarithmic (adopted from20,21).
Notwithstanding the molecules between hot spots experiences the highest enhancements, the molecules at colder sites also contribute to the overall signal. Through plasma etching it was possible to isolate the SERS signal contribution arising from molecules located in an individual hot spot from the ones that are not. The EF value could then be estimate with accuracy. Consequently, a slight reduction in SERS intensity was observed. Thus, the major contribution to the overall SERS signal emerges from the molecules located in the hot spots. Fang and colleagues estimated that 61% of 1 million molecules at sites with moderate EF contribute to 4% to the overall SERS intensity, while 63 molecules of the total at hot spots leads to 24% of SERS signal.9
The SERS signal also show polarization dependency, being much more intense when the laser polarization is aligned parallel to the dimer axis. As the laser polarization takes others orientations, the SERS intensity decreases. The minimal intensity is when a perpendicular orientation is established. In this case the molecules in the hot spots do not contribute to the overall SERS signal.9