Revista Brasileira de
Engenharia Agrícola e Ambiental
Campina Grande, PB, UAEA/UFCG – http://www.agriambi.com.br
v.22, n.11, p.758-763, 2018
Nitrous oxide emission in response to N application in irrigated sugarcane
DOI: http://dx.doi.org/10.1590/1807-1929/agriambi.v22n11p758-763
Alzeneide da S. Lopes
1, Aderson S. de Andrade Júnior
2, Luís H. Bassoi
3,
Josiane F. Silva
4, Edson A. Bastos
2& Vitória de F. Paulo
5A B S T R A C T
The objective of this study was to compare the emissions of nitrous oxide (N2O) resulting
from the application of nitrogen (N) and potassium (K) doses in fertigated sugarcane, in comparison to emissions from conventional fertilizer application. The study was conducted in the experimental area of Embrapa Mid-North, Teresina, Piauí state, Brazil, from August 2014 to January 2015. The experimental design was in randomized blocks, analyzed in a (2 x 2) +1 factorial scheme, with four replicates. The treatments consisted of the combination
of two doses of N and K2O (60-120 and 120-180 kg ha-1, respectively) and two methods
of application (in soil and fertigation), and a control. The use of fertigation reduced the
emissions of N2O in sugarcane compared with the crop under conventional fertilization.
Increase in N dose from 60 to 120 kg ha-1 applied through fertigation did not affect N
2O
emissions, while 60 and 120 kg ha-1 applied in the soil led to 40.6 and 50.2% increases in
N2O emissions, respectively. The application of 60 and 120 kg ha-1 of N in the soil led to
higher N2O emission factor, being 1.39 and 2.08% higher than in the crop fertigated with
60 and 120 kg ha-1 of N, respectively.
Emissão de óxido nitroso em resposta à aplicação
de N em cana-de-açúcar irrigada
R E S U M O
Objetivou-se neste estudo comparar as emissões de óxido nitroso (N2O) decorrentes
da aplicação de doses de nitrogênio (N) e potássio (K) em cana-de-açúcar fertirrigada, comparando-as às emissões provenientes da adubação convencional. O estudo foi conduzido na área experimental da Embrapa Meio Norte, Teresina, PI, de agosto de 2014 a janeiro de 2015. O delineamento utilizado foi o de blocos ao acaso, analisado em esquema fatorial (2 x 2) +1, com quatro repetições. Os tratamentos consistiram na
combinação de duas doses de N e K2O (60-120 e 120-180 kg ha-1, respectivamente) e duas
formas de aplicação (via solo e fertirrigação) e uma testemunha. O uso da fertirrigação
reduziu as emissões de N2O em cana-de-açúcar em comparação ao cultivo fertilizado
de forma convencional. O aumento da dose de N de 60 para 120 kg ha-1 aplicado via
fertirrigação não afetou as emissões de N2O, enquanto que a aplicação de 60 e 120 kg ha-1
via solo proporcionou aumento de 40,6 e 50,2% nas emissões de N2O, respectivamente.
A aplicação de 60 e 120 kg ha-1 de N via solo obtiveram maior fator de emissão de N
2O,
sendo superior em 1,39 e 2,08% ao registrado no cultivo fertirrigado com 60 e 120 kg ha-1
de N, respectivamente.
Key words:
Saccharum officinarum
nitrogen GHG
Palavras-chave:
Saccharum officinarum
nitrogênio GEE
1 Universidade Federal do Vale do São Francisco/Programa de Pós-Graduação em Engenharia Agrícola. Juazeiro, BA. E-mail: [email protected]
(Corresponding author) - ORCID: 0000-0002-6086-3567
2 Empresa Brasileira de Pesquisa Agropecuária/Centro de Pesquisa Agropecuária do Meio-Norte. Teresina, PI. E-mail: [email protected] -
ORCID: 0000-0002-0619-1851; [email protected] - ORCID: 0000-0002-6910-8162
3 Empresa Brasileira de Pesquisa Agropecuária/Centro Nacional de Pesquisa e Desenvolvimento de Instrumentação Agropecuária. São Carlos, SP. E-mail:
[email protected] - ORCID: 0000-0001-9469-8953
4 Universidade Federal do Piauí/Centro de Ciência Agrárias/Unidade Acadêmica de Engenharia Agronômica. Teresina, PI. E-mail: [email protected] -
ORCID: 0000-0003-4866-0043
5 Universidade Federal do Piauí/Centro de Ciência da Natureza/Unidade Acadêmica de Biologia. Teresina, PI. E_mail: [email protected]
- ORCID 0000-0003-0125-3897
Introduction
Nitrous oxide (N2O) is an important greenhouse gas (GHG). Despite its low concentration in the atmosphere, 324 ppb (IPCC, 2013), it stands out for permanence time (approximately 114 years) and high global warming potential (GWP). The GWP of the N2O is 298 times greater than that of CO2. In Brazil, it is estimated that 93% of the N2O released into the atmosphere every year comes from agricultural activity (MCTI, 2013).
The amount of N2O emitted by the use of nitrogen fertilizers, according to the estimate of IPCC (2006), is 1% of the N applied (variation from 0.03 to 3%). However, in practice, different amounts of N2O are emitted, depending on fertilizer, adopted management, type of soil, and environmental conditions. Crutzen et al. (2008) have questioned the methodology adopted and the values proposed by the IPCC, claiming that they underestimate N2O emissions. These authors proposed that the amount of N2O for nitrogen fertilizers in agricultural systems should be 3 to 5% of the N applied.
Sugarcane is a crop of great importance in global agriculture, due to the demand for renewable fuels such as ethanol, which is less polluting and less costly than fossil fuels (Oliveira et al., 2016). Because of that, it is important to conduct research aiming to reduce the environmental impacts caused by the use of nitrogen fertilizers throughout crop cycle, seeking management practices which aim to reduce N2O emissions caused by the use of these fertilizers.
Several studies have evaluated the effect of N doses on N2O emissions in sugarcane (Barbosa, 2014; Carmo et al., 2013; Signor et al., 2013). However, there are no studies in Brazil on N2O emission associated with fertigated sugarcane. Therefore, the present study was carried out to compare N2O emission resulting from the application of N doses in sugarcane under subsurface drip fertigation with emissions from conventional fertilization (in the soil).
Material and Methods
The experiment was carried out in an experimental area of Embrapa Mid-North, cultivated with sugarcane, variety RB 92579, in the plant-cane crop, in Teresina, PI, Brazil (5° 05' S; 42° 29' W; 72 m). According to Köppen’s classification,
the local climate is Aw. Average annual temperature is 28.2 °C and average annual rainfall is 1,343.4 mm, and the rains in this region are susceptible to large oscillations (Bastos & Andrade Júnior, 2014). The soil of the area is a dystrophic Red Yellow Argisol, with sandy loam texture (Melo et al., 2014).
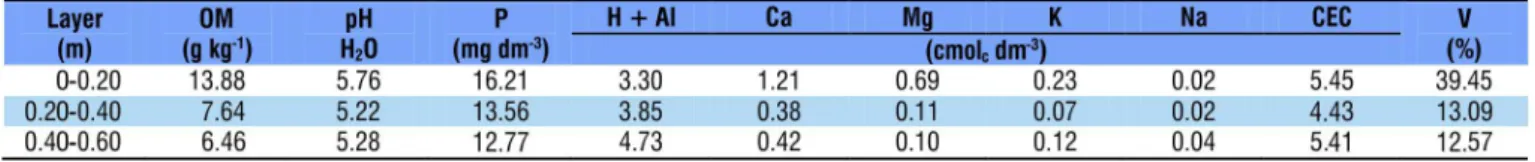
Prior to sugarcane planting, the area had been cultivated with jatropha for seven years. After jatropha was removed, this experiment began, soil samples were collected for chemical analysis (Silva, 2009) (Table 1), and 2 Mg ha-1 of limestone (RNV = 90%) were applied. Soil tillage consisted of plowing, harrowing and opening of planting furrows. Sugarcane was manually planted in June 2014, at 0.3 m depth, with six cuttings, containing three buds each, per linear meter. Plots consisted of three 10-m-long double rows at spacing of 1.5 x 0.5 x 2.0 m.
The experimental design was randomized blocks, analyzed in (2 x 2) +1 factorial scheme, with four replicates. Treatments consisted of the combination of two doses of N and K2O, respectively (60-120; 120-180 kg ha-1) and two methods of application (in the soil and fertigation), plus a control: T1 - Control; T2 - Fertigated (60 -120 kg ha-1 of N and K2O); T3 - Fertigated (120-180 kg ha-1 of N and K
2O); T4 - Conventional fertilization (60-120 kg ha-1 of N and K
2O); and T5 - Conventional fertilization (120-180 kg ha-1 of N and K2O). All plots of the treatments were irrigated, regardless of fertilizer application method.
Fertilizations with other nutrients were uniform in all plots. Phosphorus (P2O5) was applied in the amount of 100 kg ha-1, as follows: 30% at planting (TSP – triple superphosphate) and 70% by fertigation (monoammonium phosphate), in monthly applications. In treatments with soil fertilization, P was entirely applied at planting, as TSP. The micronutrients B, Zn, Mn, Cu and Mo were applied by fertigation, split into six applications in all treatments, monthly performed.
In fertigated treatments, N and K2O applications were split into 24 portions along six months of the crop cycle (Table 2), with 7 day interval between applications, and the first one was carried out 60 days after planting (DAP). In treatments with soil fertilization, N and K2O fertilizations were conventionally applied in two steps, 50% at 68 DAP and 50% at 144 DAT (Andrade Júnior et al., 2012).
N and K2O were simultaneously applied, using urea as N source and white potassium chloride as K2O source. Urea and potassium chloride were diluted in a 50 L tank and injected
Table 1. Chemical characteristics of the soil before the experiment
*30% of K2O dose was applied at planting for treatment of fertilization in soil and by fertigation
into the irrigation system by a positive displacement hydraulic pump (TBM pump).
In treatments with soil fertilization, urea and potassium chloride were homogeneously applied in furrows (0.05 m deep) opened on the sides of the planting rows, which were subsequently closed. After that, to ensure soil moistening, 2 L of water were applied per meter of furrow. This measure was adopted because we believed the wet bulb, formed from the subsurface drip system, would not reach the fertilizer furrows, which were situated beside the double row, since the irrigation line was located in the center of the double row.
Irrigation depth was uniform and applied based on reference evapotranspiration (ETo), estimated by the Penman-Monteith method and crop coefficients (Kc) for sugarcane, determined in the region (Andrade Júnior et al., 2017), on a daily basis. Regarding the application frequency, irrigation was performed on the following days of the week: Mondays, Wednesdays and Fridays. A subsurface drip irrigation system was used (85% efficiency), with 2 m between drip lines (drippers spaced by 0.60 m, flow rate of 2.3 L h-1, 200 kPa pressure), buried at 0.25 m depth, in the center of the double rows.
N2O fluxes were quantified by the static closed-chamber method. The chambers consisted of one metal base partially buried in the soil (0.05 m deep), installed at the beginning of the experiment and kept fixed until the final period of evaluation, and one PVC base, which was fitted onto the other during sample collection, containing an upper hole to attach the syringe used in the collections. To quantify the fluxes on the collection day, three samples of N2O were collected per chamber: immediately after the chamber was closed (time zero); at 10 min (time 10) and at 30 min (time 30). The samples were collected in the morning (between 7 h 30 min and 10 h a.m.), stored in hermetically sealed flasks and sent to analysis. N2O concentration was determined using a gas chromatograph (TraceTM 1310 GC) with ECD1 detector at 350 °C (nitrogen at 20 mL min-1 as make-up gas), and helium as carrier gas.
In fertigated and control treatments, the chamber base was installed in the center of the experimental plot, between the double rows, above the drip line. In treatments of conventional fertilization, the base was installed in the center of the experimental plot, in the interrows, above the fertilizer furrow. N2O emissions were estimated using one static chamber per replicate, totaling 20 chambers in the test.
In fertigated treatments, N2O emission evaluations were carried out at 83, 104, 146, 186 and 230 DAP, one day after fertigation, in a total of 5 evaluations. In treatments of conventional fertilization, the collections were made at 69, 70, 73 and 145, 146 and 147 DAP to quantify the emissions resulting from the 1st and 2nd top-dressing fertilizations, respectively, totaling 6 evaluations.
Variations of N2O concentrations in the samples as a function of the time after chamber closing (0, 10 and 30 min), associated with the data of chamber volume, chamber area and soil temperature, were used to calculate the N2O flux in µg m-2 h-1 (Jantalia et al., 2008) shown in Eq.1.
where:
F - N2O flux;
∆c/∆t - change in gas concentration inside the chamber within the time interval during the collection;
V - chamber volume, L;
A - soil area covered by the chamber, m²;
M - molecular mass of N atoms in the N2O molecule; and,
Vm - molar volume of the gas at temperature of sampling (22.4 µL µmol-1, under normal temperature and pressure - NTP).
During the collection period, soil temperature and moisture were monitored. Soil moisture was obtained by gravimetric method using soil samples (0-0.1 m) collected beside the chamber during the collection. Soil temperature was measured using a thermometer, which was inserted at 0.10 m depth during the collection.
Daily N2O fluxes were entered in an electronic worksheet. After that, the emission accumulated in the period was obtained by trapezoid integration of the daily fluxes over time. Cumulative N2O emission was used to calculate the emission factors (EF) for each N dose applied. This calculation was carried out following the methodology proposed by IPCC (2006), Eq. 2.
F C
T V
A M
Vm = ∆ × ×
∆
EF Ex Eo
N
x = −
×100
where:
EFx - N2O emission factor for each N dose applied, %; Ex - total N2O flux for each N dose, kg ha-1;
Eo - total N2O emission for the control treatment, kg ha-1; and,
N - quantity of N applied through fertilizer, kg ha-1.
Analysis of residues of the total N2O emission was carried out. The differences between cumulative N2O emissions were statistically assessed by variance analysis. Based on the t-test, contrasts of interest between two means of cumulative emission and the N2O emission factor were estimated. All analyses were carried out using the statistical program SAS 14.1 (SAS Institute, 2015).
Results and Discussion
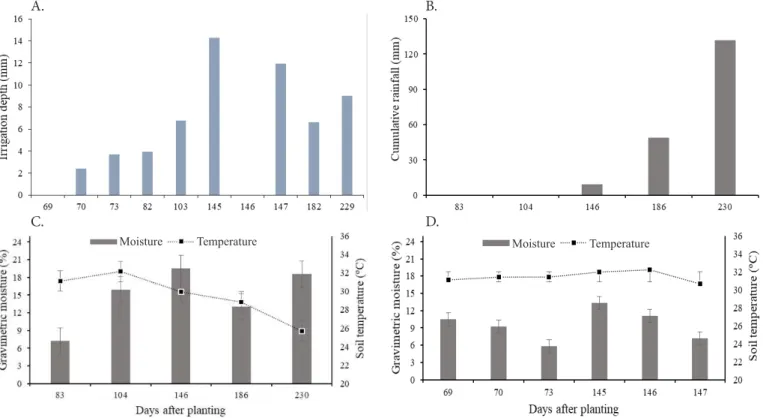
The irrigation depths applied one day before collections and rainfall accumulated along the evaluation period are presented in Figures 1A and B. Lowest soil temperature was recorded at 230 days after planting (DAP) during the measurements in treatments with fertigation (Figure 1C). In this period, the crop was already fully established with the leaves completely expanded, shading the soil and preventing the incidence of solar radiation directly on soil surface. In addition, the beginning of the rainy period in the region contributed to the reduction in soil temperature.
In treatments with conventional fertilization, the mean soil temperature did not vary between collection days (Figure 1D). (2)
Vertical bars indicate the standard error of the mean (n = 4)
Figure 1. Irrigation depths (A), cumulative rainfall (B), soil moisture and soil temperature along the experimental period in sugarcane under subsurface drip fertigation (C) and fertilization in soil (D)
A. B.
C. D.
Soil temperature has a strong influence on N2O fluxes because it interferes with the basic functions of soil microorganisms. Since temperature is a limiting factor in the nitrification process, it is estimated that the optimal maximum temperature for nitrification is 35 to 37 °C (Stark, 1996).
Highest soil moisture percentage occurred at 146 DAP in fertigated treatments, when the largest water volume was applied (Figure 1C). However, in treatments with conventional fertilization, highest soil moisture percentage was observed at 145 DAP (Figure 1D), when gas samples relative to the second top dressing fertilization were collected.
Among fertigated treatments, the highest N2O fluxes were determined at 146 DAP (Figure 2A). The mean values of soil moisture (19.5%) and temperature (30 °C at 0.1 m depth) may have contributed to increasing the N2O emission measured one day after fertigation with N.
Besides soil temperature and moisture, N availability in the soil is another important factor for N2O emissions because it favors the biological processes of nitrification and denitrification (Smith et al., 2003). At 146 DAP, 60% of the N dose had already been applied in each treatment.
Several studies with conventional fertilization reported increases in N2O fluxes after nitrogen fertilization, whether mineral or organic, in sugarcane (Carmo et al., 2013; Signor et al., 2013; Paredes et al., 2014; Soares et al., 2015), corroborating the results observed here. At 83 DAP, negative N2O flux was observed in the control treatment (T1), which may have been favored by the low N availability in the soil, especially in the form of NO3- (Chapuis-Lardy et al., 2007) and the low moisture percentage (7.3%).
In treatments of conventional fertilization, maximum N2O flux relative to the 1st top dressing fertilization was observed in
Vertical bars indicate the standard error of the mean (n = 4)
Figure 2. N-N2O flux in sugarcane crop under subsurface drip fertigation (A) and conventional fertilization (B)
A.
B.
T5 (108.33 µg N m-2 h-1) one day after fertilizer application (69 DAP). In T4, the flux of 53.50 µg N m-2 h-1 was quantified on the third day after fertilization (73 DAP). On the other hand, in
the collections relative to the second top dressing fertilization, the maximum N2O was determined in T4 (141.59 µg N m-2 h-1) at 146 DAP and two days after fertilization (Figure 2B).
In general, highest N2O fluxes occurred in the treatments of conventional fertilization (Figures 2A and B), which is due to the higher percentage of fertilizer applied per fertilization (two applications). Conversely, split fertilizer application may have reduced the denitrification rates and consequent emission of N2O (Tan et al., 2009), in fertigated treatments. In addition, application in subsurface (0.25 m depth by fertigation) tends to reduce the emission of N2O, as it increases the possibility of its oxidation to N2 (Chapuis-Lardy et al., 2007).
Comparing treatments of fertigation and fertilization in soil with the control, there was significant differences between N doses and the control, and between the methods of fertilizer application (Table 3).
The average effect of cumulative emission of T2 vs T4 (60 kg ha-¹ of N) and T3 vs T5 (120 kg ha-¹ of N) was significant between these treatments that received the same N dose, but through different methods of application, indicating that the form of application of this nutrient, even at low doses, have effect on total N2O emission.
Treatments fertigated with 60 and 120 kg ha-1 of N showed reductions of 40.6 and 50.2%, respectively, in the cumulative N2O emission along the cycle in comparison to their correspondents of fertilization in soil, minimizing atmospheric pollution and reducing N losses in the production system (Barbosa, 2014).
N2O emissions are lower when the fertilizer is applied at 0.10 m depth in comparison to the application on soil surface or at 0.05 m depth. Application at 0.10 or 0.25 m depths increases the residence time of N2O in the soil, also increasing the probability of its reduction to N2 (Chapuis-Lardy et al., 2007).
The average effect of T4 vs T5 caused significant difference between these treatments, because T5 led to a 30.4% increase in cumulative N2O emission compared with T4. Such increase was possibly due to the higher N dose applied in T4, providing more N to the biological processes of nitrification and denitrification, resulting in higher N2O emission in this treatment.
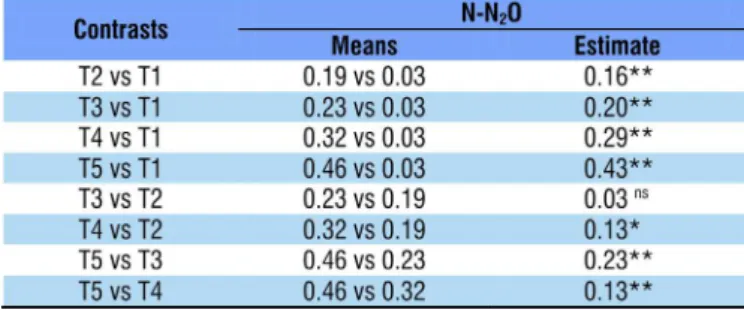
In treatments fertilized by fertigation, the proportion of N lost with N2O was significantly inferior to those of their correspondents under conventional fertilization (Table 4).
The average effect of T2 versus T4 and T3 versus T5 was significant, indicating that for the application of 60 and 120 kg ha-1 of N, by conventional fertilization, N losses in the form of N2O were 1.39 and 2.08% higher, respectively, than their correspondents under fertigation. The application of 120 kg ha-1 of N by fertigation showed lower EF (1.69%), value close to that established by IPCC (2006), which is 1%, and below those found by Signor et al. (2013), applying 90, 120 and 180 kg N ha-1 in the cycle of second ratoon of sugarcane under rainfed conditions, in Piracicaba-SP, equal to 3.59, 6.67 and 4.31%, respectively.
On the other hand, conventional application of 60 kg ha-1 of N led to EF of 4.26%, which is above that established by IPCC (2006) and that found by Lisboa et al. (2011) in a literature review on this factor in sugarcane, EF of 3.87%. Signor et al. (2013), applying urea as source of N (60 kg ha-1), observed EF above the value indicated by IPCC (2006), 2.85%. Carmo et al. (2013), applying the same N dose, obtained EF close to that indicated by IPCC (2006), 1.1%.
All emission factors found in the present study exceed the value proposed by IPCC, although some of them are within the uncertainty range. It is important to point out that the data serving as reference to estimate the impact of agricultural practices on GHG emissions provided by IPCC are based on the available literature, which mostly come from regions of temperate climate, with edaphoclimatic conditions greatly different from those observed in tropical regions. Because of that, it has been currently reported that many of the EFs proposed by IPCC do not completely apply to tropical conditions (Urquiaga et al., 2010). Therefore, it becomes necessary to conduct more studies to improve the estimates of N2O emissions, relative to the application of N doses by fertigation, in sugarcane cultivation systems under tropical and subtropical conditions.
Conclusions
1. The use fertigation reduced N2O emissions in sugarcane compared with its cultivation under conventional fertilization in the soil and can be considered as an option for the reduction of N2O emissions.
2. The increase in N dose from 60 para 120 kg ha-1,applied by fertigation, did not affect N2O emissions, whereas the application of 60 and 120 kg ha-1 of N in the soil led to increases of 40.6 and 50.2% in N2O emissions, respectively.
3. Application of 60 and 120 kg ha-1 of N in the soil led to higher N2O emission factor, being 1.39 and 2.08% higher than that observed in the cultivation fertigated with 60 and 120 kg ha-1 of N, respectively.
T1- Control; T2 (60-120 kg ha-1 of N and K
2O) and T3(120-180 kg ha
-1 of N and K 2O) – Fertigated treatments; T4 (60-120 kg ha-1 of N and K
2O) and T5 (120-180 kg ha -1 of N and
K2O) – Treatments of conventional fertilization; nsNot significant (p ˃ 0.05); *Significant at (0.05 ≥ p ˃ 0.01); and, **Significant at (p ≤ 0.01), by t-test
Table 3. Differences between treatment means relative to the cumulative emission of N-N2O (g m-2) as a function of different doses of N and K2O (kg ha-1) in sugarcane under subsurface drip fertigation and conventional fertilization
Table 4. N2O emission factor (EF) associated with N doses (kg ha-1) applied in sugarcane by fertigation versus conventional fertilization
Literature Cited
Andrade Júnior, A. S.; Bastos, E. A.; Ribeiro, V. Q.; Duarte, J. A. L.; Braga, D. L.; Nolêto, D. H. Níveis de água, nitrogênio e potássio por gotejamento subsuperficial em cana-de-açúcar. Pesquisa Agropecuária Brasileira, v.47, p.78-84, 2012. https://doi. org/10.1590/S0100-204X2012000100011
Andrade Júnior, A. S.; Nolêto, D. H.; Bastos, E. A.; Moura, M. S. B.; Anjos, J. C. R. Demanda hídrica da cana-de-açúcar, por balanço de energia, na microrregião de Teresina, Piauí. Agrometeoros, v.25, p.217-226, 2017.
Barbosa, E. A. A. Sustentabilidade ambiental da produção de cana-de-açúcar irrigada com esgoto doméstico tratado via gotejamento subsuperficial. Campinas: UNICAMP, 2014. 135p. Tese Doutorado Bastos, E. A.; Andrade Júnior, A. S. Boletim agrometeorológico de
2013 para o município de Teresina, Piauí. Teresina: Embrapa Meio Norte, 2014. 38p.
Carmo, J. B. do; Filoso, S.; Zotelli, L. C.; Sousa Neto, E. R. de; Pitombo, L. M.; Duarte Neto, P. J.; Vargas, V. P.; Andrade, C. A.; Gava, G. J. C.; Rossetto, R.; Cantarella, H.; Elia Neto, A.; Martinelli, L. A. Infield greenhouse gas emissions from sugarcane soils in Brazil: Effects from synthetic and organic fertilizer application and crop trash accumulation. Global Change Biology Bioenergy, v.5, p.267-280, 2013. https://doi.org/10.1111/j.1757-1707.2012.01199.x Chapuis-Lardy, L.; Wrage, N.; Metay, A.; Chotte, J.; Bernoux, M. Soil, a
sinkfor? A review. Global Change Biology Bioenergy, v.13, p.1-17, 2007. https://doi.org/10.1111/j.1365-2486.2006.01280.x Crutzen, P. J.; Mosier, A. R.; Smith, K. A.; Winiwarter, W. N2O release
from agro bio-fuel production negates global warming reduction by replacing fossil fuels. Atmospheric Chemistry and Physics, v.8, p.389-395, 2008.
IPCC - Intergovernmental Panel on Climate Change. Guidelines for national greenhouse gas inventory: Agriculture, forestry and other land use. Cambridge: Cambridge University Press, 2006. 113p. IPCC - Intergovernmental Panel on Climate Change. Climate Change
2013: The physical science basis. Contribution of working group I to the fifth assessment report of the Intergovernmental Panel on Climate Change. Cambridge: Cambridge University Press, 2013. Jantalia, C. P.; Santos, H. P.; Urquiaga, S.; Boddey, R. M.; Alves, B. J. R. Fluxes of nitrous oxide from soil under different crop rotations and tillage systems in the south of Brazil. Nutrient Cicling in Agroecosystems, v.82, p.161-173, 2008. https://doi.org/10.1007/ s10705-008-9178-y
Lisboa, C. C.; Butterbach-Bahl, K.; Mauder, M.; Kiese, R. Bioethanol production from sugarcane and emissions of greenhouses gases: Known and unknowns. Global Change Biolog y Bioenergy, v.3, p.277-292, 2011. https://doi.org/10.1111/j.1757-1707.2011.01095.x
MCTI - Ministério da Ciência, Tecnologia e Inovação. Estimativas anuais de emissões de gases de efeito estufa no Brasil. Brasília: MCTI, 2013. 76p.
Melo, F. B.; Andrade Júnior, A. S.; Pessoa, B. L. O. Levantamento, zoneamento e mapeamento pedológico detalhado da área experimental da Embrapa Meio Norteem Teresina, PI. Teresina: Embrapa Meio Norte, 2014. 47p.
Oliveira, A. R.; Braga, M. B.; Santos, B. L. S.; Walker, A. M. Análise biométrica de cultivares de cana-de-açúcar cultivadas sob estresse hídrico no vale do Submédio São Francisco. Energia na Agricultura, v.31, p.48-58, 2016. https://doi.org/10.17224/ EnergAgric.2016v31n1p48-58
Paredes, D. S.; Lessa, A. C. R.; Sant’Anna, S. A. C.; Boddey, R. M.; Urquiaga, S.; Alves, B. J. R. Nitrous oxide emission and ammonia volatilization induced by vinasse and N fertilizer application in a sugarcane crop at Rio de Janeiro, Brazil. Nutrient Cicling in Agroecosystems, v.98, p.41-55, 2014. https://doi.org/10.1007/s10705-013-9594-5
SAS Institute. SAS/STA® 14.1 User’s Guide. Cary: SAS Institute, 2015. Disponível em: <http://supporthttp://support.sas.com/ documentation/cdl/en/statug/68162/PDF/default/statug.pdf>. Access on: Jan. 2016.
Signor, D.; Cerri, C. E. P.; Conant, R. N2O emissions due to nitrogen fertilizer applications in two regions of sugarcane cultivation in Brazil.Environmental Research Letters, v.8, p.1-9, 2013. https:// doi.org/10.1088/1748-9326/8/1/015013
Silva, F. C. da. Manual de análises químicas de solo, plantas e fertilizantes. 2.ed. Brasília: Embrapa Informação Tecnológica, 2009. 20p.
Smith, K. A.; Ball, T.; Conen, F.; Dobbie, K. E.; Massheder, J.; Rey, A. Exchange of greenhouse gases between soil and atmosphere: Interactions of soil physical factors and biological processes. European Journal of Soil Science, v.54, p.779-791, 2003. https:// doi.org/10.1046/j.1351-0754.2003.0567.x
Soares, J. R.; Cantarella, H.; Vargas, V. P.; Carmo, J. B.; Martins, A. A.; Sousa, R. M.; Andrade, C. A. Enhanced-efficiency fertilizers in nitrous oxide emissions from urea applied to sugarcane. Journal of Environmental Quality, v.44, p.423-430, 2015. https://doi. org/10.2134/jeq2014.02.0096
Stark, J. M. Modeling the temperature response of nitrification. Biogeochemistry, v.35, p.433-445, 1996. https://doi.org/10.1007/ BF02183035
Tan, I. Y. S.; Es, H. M.; Duxbury, J. M.; Melkonian, J. J.; Schindelbeck, R. R.; Geohring, L. D.; Hively, W. D.; Moebius, B. N. Single-event nitrous oxide losses under maize production as affected by soil type, tillage, rotation, and fertilization. Soil and Tillage Research, v.102, p.19-26, 2009. https://doi.org/10.1016/j.still.2008.06.005 Urquiaga, S.; Alves, B. J. R.; Jantalia, C. P.; Boddey, R. M. Variações