www.atmos-chem-phys.net/8/2351/2008/ © Author(s) 2008. This work is distributed under the Creative Commons Attribution 3.0 License.
Chemistry
and Physics
Biogenic nitrogen oxide emissions from soils – impact on NO
x
and
ozone over West Africa during AMMA (African Monsoon
Multidisciplinary Experiment): modelling study
C. Delon1, C. E. Reeves2, D. J. Stewart2, D. Serc¸a1, R. Dupont1, C. Mari1, J.-P. Chaboureau1, and P. Tulet3
1Laboratoire d’A´erologie, Universit´e de Toulouse and CNRS, Toulouse, France 2School of Environmental Sciences, University of East Anglia, Norwich, UK 3CNRM/GMEI, M´et´eo-France, Toulouse, France
Received: 9 October 2007 – Published in Atmos. Chem. Phys. Discuss.: 19 October 2007 Revised: 4 April 2008 – Accepted: 4 April 2008 – Published: 6 May 2008
Abstract. Nitrogen oxide biogenic emissions from soils are driven by soil and environmental parameters. The relation-ship between these parameters and NO fluxes is highly non linear. A new algorithm, based on a neural network calcula-tion, is used to reproduce the NO biogenic emissions linked to precipitations in the Sahel on the 6 August 2006 during the AMMA campaign. This algorithm has been coupled in the surface scheme of a coupled chemistry dynamics model (MesoNH Chemistry) to estimate the impact of the NO emis-sions on NOx and O3 formation in the lower troposphere for this particular episode. Four different simulations on the same domain and at the same period are compared: one with anthropogenic emissions only, one with soil NO emissions from a static inventory, at low time and space resolution, one with NO emissions from neural network, and one with NO from neural network plus lightning NOx. The influence of NOxfrom lightning is limited to the upper troposphere. The NO emission from soils calculated with neural network re-sponds to changes in soil moisture giving enhanced emis-sions over the wetted soil, as observed by aircraft measure-ments after the passing of a convective system. The subse-quent enhancement of NOxand ozone is limited to the low-est layers of the atmosphere in modelling, whereas measure-ments show higher concentrations above 1000 m. The neural network algorithm, applied in the Sahel region for one par-ticular day of the wet season, allows an immediate response of fluxes to environmental parameters, unlike static emission inventories. Stewart et al. (2008) is a companion paper to this one which looks at NOxand ozone concentrations in the boundary layer as measured on a research aircraft, examines
Correspondence to:C. Delon ([email protected])
how they vary with respect to the soil moisture, as indicated by surface temperature anomalies, and deduces NOxfluxes. In this current paper the model-derived results are compared to the observations and calculated fluxes presented by Stew-art et al. (2008).
1 Introduction
Tropospheric oxidation of VOCs (Volatile Organic Com-pounds) in the presence of NOx (NO+NO2) and sunlight leads to the formation of ozone in the troposphere. NO emissions from soils, among other sources, directly influ-ence NOx concentrations; the emitted NO is quickly oxi-dised to NO2. Changes in NO sources will consequently modify the rate of ozone production. Estimating biogenic emissions of NO is relatively uncertain compared to anthro-pogenic sources, due to a lack of data. Soil emission pro-cesses have been studied in temperate and tropical regions, showing that the main controlling factors are surface soil temperature and moisture, associated with nitrogen deposi-tion and nitrogen content in the soil (Ludwig et al., 2001; Pilegard et al., 2006). Emissions are produced by microbial processes (nitrification/denitrification), and the upscaling of these emissions implies that some simplifications and gen-eralisations are made in the description of the emission pro-cesses.
response of the emission to surface moisture and tempera-ture at the regional scale. Williams et al. (1992) proposed a regional inventory of biogenic NO emissions in the United States, based on the surface temperature evolution. This al-gorithm has been improved (taking into account soil mois-ture and type of biome) and adapted at the global scale by Yienger and Levy (1995), leading to a global budget of 5.5 TgN/yr. Based on this approach, and on field measurements, Yan et al. (2005) have proposed a different algorithm, includ-ing different determininclud-ing parameters (pH, climate, soil or-ganic carbon content, land cover type, nitrogen input), giving a 4.97 TgN/yr budget at the global scale. The calculation of the Canopy Reduction Factor of the Yienger and Levy (1995) algorithm has been adapted and improved by Ganzeveld et al. (2002), and the resulting global budget was 12 TgN/yr. The majority of current chemistry transport models use the Yienger and Levy inventory for biogenic NO initialisation.
More recently, biogeochemical models have been elaborated, combining the description of nitrifica-tion/denitrification processes with climatic evolution of soil parameters (Butterbach-Bahl et al., 2001; Kiese et al., 2005; Kesik et al., 2005), but the application of such models remains only possible in regions where detailed field studies have been conducted. Inverse modelling from satellite mapping (Jaegle et al., 2004) provides emissions from soils at the global scale, but does not give information on the relationship between emissions and soil parameters.
Delon et al. (2007) have proposed an original approach for the estimation of NO emissions from soils, based on a neural network calculation. The main advantage of this approach, compared to regional or global existing inventories, is its im-mediate response to environmental parameters change.
The AMMA (African Monsoon Multidisciplinary Anal-ysis) experiment took place in 2005–2006 and provided a unique dataset over West Africa. AMMA is an international program, with the objective to provide a better understanding of the African Monsoon mechanisms in terms of dynamics, hydrology, chemistry, and social impacts on local population (Redelsperger et al., 2006; Mari and Prospero, 2005). The Special Observation Periods of the AMMA field campaign took place during the year 2006, in January during the dry season, in June around the monsoon onset and in July and August during the wet season. In particular, several flights and ground based measurements were dedicated to the study of NOxoriginating from soils. In this study, we will focus on one particular episode to test the sensitivity of ozone forma-tion to soil NOxemission. This study is closely associated with the companion paper by Stewart et al. (2008). Both studies determine fluxes of NOxfrom soil over West Africa, which are compared. Stewart et al. (2008) employ a top-down approach using NOx concentrations measured in the boundary layer on the BAe-146 aircraft, whilst this current study employs a bottom-up approach by incorporating an ar-tificial neural network (ANN), constrained by previous field studies, into a 3-D mesoscale, coupled chemistry-dynamics
model and compares the resulting NOxconcentrations with those measured on the BAe-146. In the Stewart et al study the variation of NOxand ozone in the boundary layer is exam-ined with respect to the soil moisture, as indicated by surface temperature anomalies. In this current paper the ability of the model to capture these observed features is examined.
2 Model description
2.1 MesoNH-Chemistry
The model used is MesoNH-Chemistry, jointly developed by Meteo-France (Toulouse, France) and the CNRS. A full description of the model is given on http://mesonh.aero. obs-mip.fr/ (Lafore et al., 1998). The horizontal grid con-sists of 100 by 100 points, with a 20 km grid spacing. The centre of the domain is close to Niamey (Niger). 52 levels are used, from the surface to 28-km height, with 30 levels from 0 to 2000 m. The structure and evolution of the boundary layer is determined with an eddy diffusivity turbulent scheme with 1.5 order closure for prognostic turbulent kinetic energy (Cuxart et al., 2000). The time step is 30 s. The simulation runs from 5th August 2006 00:00 UTC, to 7 August 2006 00:00 UTC. Only the results for the second day are discussed here. A one-day spin-up has been shown to be sufficient for the triggering of mesoscale convective systems as shown by Chaboureau et al. (2007). The MesoNH meteorology is con-strained every 6h at its boundaries by the large scale dynamic forcing from ECMWF (European Centre for Medium range Weather Forecast) analyses. The physics of the model in-cludes a parameterization of deep convection based on mass-flux calculation (Bechtold et al., 2001). This scheme has been adapted by Mari et al. (2006) in order to quantify the amount of lightning NOx (LiNOx) produced in deep con-vective clouds. Surface fluxes of energy are provided by the ISBA model (Interactions between Soil Biosphere Atmo-sphere, Noilhan and Planton, 1989). Biogenic NO emissions from soils, as derived from the neural network approach (De-lon et al., 2007) are fully coupled with the model surface scheme (see Sect. 2.2 for details). Anthropogenic emissions come from the GEIA database (Global Emissions Inventory Activity, www.geiacenter.org), and take into account traffic, industries, and fossil fuel emissions. Biogenic emission of isoprene and monoterpenes come from the POET database, available at monthly temporal and 1◦/1◦ spatial resolution (Granier et al., 2005).
and the associated distributions of ozone and its precursors over West Africa. Starting from these profiles, the sensi-tivity runs from the 3-D MesoNH model, studied here, are shown 39 h after the beginning of the simulation (6 Au-gust 15:00 UTC). Methane is initialized to a typical back-ground value of 1700 ppbv. All other species were set to very low values (≤0.001 ppbv). While looking at the evolu-tion of chemical compounds in the whole simulaevolu-tion domain, this study is focused on chemical processes occurring in the northern part of the domain, the Saunois et al. (2008) initial profiles were therefore averaged between 13 and 15N, and the whole simulation domain receives the same initial val-ues.
The general resistance parameterisation for dry deposi-tion velocities of Wesely and Hicks (1977) has been intro-duced into Meso-NH-C (Tulet et al., 2003). The surface re-sistance incorporates both the physical and biological sur-face characteristics together with the solubility of deposited species (Baer and Nester, 1992). For vegetated surfaces (Wesely, 1989), one further considers the relative contribu-tions of stomata, mesophyllic tissues, and cuticle whereas for liquid surfaces, the parameterisation of Erisman and Bal-docchi (1994) is used. These parameterisations have been included in ISBA and coupled with the 255 surface classi-fication types of Meso-NH. ISBA calculates such evolving parameters as aerodynamical, quasi-laminar, stomatal resis-tances, and drag coefficients for different vegetation types. So chemical dry deposition velocities evolve at each time step together with surface wind, turbulent conditions and chemical parameters (Henry’s law solubility constant, bio-logical reactivity Wesely, 1989).
The deposition velocity calculation is of course applied to NO2. The NOx concentration in the above canopy air is deduced from the net canopy emission, minus the above canopy deposition flux. The deposition of NO2has already been described, and the net canopy emission is a fraction of the upward NO flux from soils. This fraction has been roughly evaluated in MesoNHC, and is assumed to be a lin-ear function of LAI (Leaf Area Index) and derived from em-pirical relationships between LAI and NO emission (Yienger and Levy (1995) and references therein, Ganzeveld et al., 2002). The CRF equation is expressed as follows (while us-ing Yienger and Levy (1995) data, it is different from the one developed in their paper), and is valid in a range of LAI from 0 to 8 m2.m−2.
CRF= −0.0917×LAI+0.9429 (1)
This equation does not take into account either the in-canopy turbulence, or the leaf resistance to NO2and O3, mentioned as important parameters in forested areas Jacob and Bakwin, 1992. Our choice to simplify this equation leads of course to an approximation of emissions to the atmosphere, but the at-tenuation is most efficient in rain forests where the canopy is dense, which is not the case in our domain. In our simulation
domain, the LAI does not exceed 3.5 m2m−2(Fig. 1c), lead-ing to a decrease in NO flux reachlead-ing 40% at the most. It is important to note here that this study is not focused on CRF parameterisation, hence our choice for a simple approach. Furthermore, the focus of this study is in the Sahel region (north of 13◦N), where the vegetation cover (deduced from the ECOCLIMAP database Masson et al., 2003) is below 20%.
2.2 Surface parameters used in the emissions calculation The calculation of NO emissions with the Artificial Neural Network (ANN) algorithm needs some additional soil pa-rameters, such as pH and fertilisation rate, not included in the default version of MesoNH-C. The other parameters (sur-face moisture, sur(sur-face and deep soil temperature, and wind speed) are provided by the surface scheme ISBA (or by the atmospheric scheme for the wind speed) at each time step of the simulation. Sand percentage (Fig. 1b) is obtained from the ECOCLIMAP database. The pH map is obtained from IGBP-DIS (1998, http://www.sage.wisc.edu/atlas) soil database, and is shown in Fig. 1a. The latitudinal variation of pH (low values in the south of the simulation domain) will be a determining factor for NO emissions. Indeed, Serc¸a et al. (1994) have shown a negative correlation between NO emis-sions and soil pH in tropical soils of Central Africa, corrob-orated by Yan et al. (2005) in their statistical model.
Quantifying nitrogen fertilization in West Africa is a rather difficult task since mineral fertilizers are rarely used in that region and not documented. The fertilisation rate provided to the model is a constant value in space but not in time, based on organic fertilisation provided by cattle dung. We have es-timated the manure input, and assumed assimilation with an exponential decay. This calculation is deduced from Schlecht et al. (1997). Although rough, this estimate has the advantage of providing an estimate of nitrogen content, as the ANN al-gorithm needs this information. A detailed map of organic fertilisation based on cattle population would certainly bring an improvement in NO flux estimate. This solution will be investigated in future work.
2.3 Artificial Neural Network Algorithm
Fig. 1. (a)pH values,(b)sand percentage (%), and(c)LAI m2.m−2in the simulation domain.
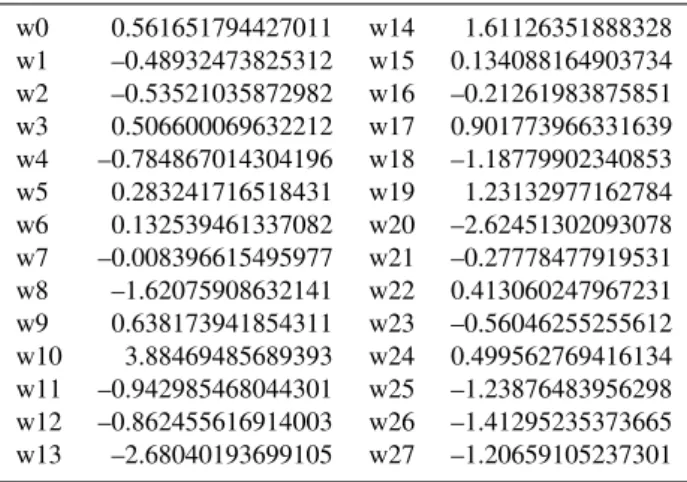
Table 1. Weights for NO flux modelling with neural network pa-rameterization, to be used in equation 1.
w0 0.561651794427011 w14 1.61126351888328 w1 –0.48932473825312 w15 0.134088164903734 w2 –0.53521035872982 w16 –0.21261983875851 w3 0.506600069632212 w17 0.901773966331639 w4 –0.784867014304196 w18 –1.18779902340853 w5 0.283241716518431 w19 1.23132977162784 w6 0.132539461337082 w20 –2.62451302093078 w7 –0.008396615495977 w21 –0.27778477919531 w8 –1.62075908632141 w22 0.413060247967231 w9 0.638173941854311 w23 –0.56046255255612 w10 3.88469485689393 w24 0.499562769416134 w11 –0.942985468044301 w25 –1.23876483956298 w12 –0.862455616914003 w26 –1.41295235373665 w13 –2.68040193699105 w27 –1.20659105237301
have appeared as alternatives to classical statistical mod-elling, and are particularly useful for non-linear phenom-ena. Networks are designed to be able to learn how to
repre-sent complex information, and are used to find the best non-linear regression between a number of selected parameters. In our study, an ANN has been used to find the relation be-tween seven parameters or inputs (surface temperature, sur-face WFPS (Water Filled Pore Space, deep soil temperature (20–30 cm), pH, sand percentage, fertilisation rate, and wind speed) and the output (NO emission fluxes). To be able to represent different situations, the neural network needs to be supplied with data issued from diverse types of climates and soils. For this purpose, the databases used in this algorithm contain data from temperate and tropical climates. The ap-plication of the algorithm onto tropical or temperate climate conditions is therefore possible, but is restricted to the range of the input data given in the database. The resulting equa-tion is given in Eq. 2:
NOfluxnorm=w24+w25tanh(S1)
where NOfluxnormis the normalized NO flux, and S1 =w0+P7i=1 wixj,norm
S2 =w8+P15i=8 wixj,norm S3 =w16+P23i=17 wixj,norm withj =1→7
(3)
wherex1tox7correspond to the seven inputs (surface WFPS, surface soil temperature, deep soil temperature, fertilisation rate, sand percentage, pH and wind speed respectively). pH values used in Delon et al. (2007) have been updated in the tropical part of the database, implying a whole new set of weights (see Table 1).
The microbial activity in the soil, responsible for NO emis-sions throughout the soil layer, is influenced by the physical properties of the soil, which affect substrate diffusion and oxygen supply (Skopp et al., 1999). The choice of these seven parameters as inputs has been made to give an insight into these microbial processes, without describing them in detail, but by trying to highlight the different physical pro-cesses favouring this microbial activity. The network was initially run with soil surface temperature and WFPS as in-puts, because of their well known and fundamental influence on NO emissions, reported in all of the literature on the sub-ject, cited in the introduction of this paper. Soil temperature at depth was included due to the effect it has on oxygen dif-fusion and N mineralization into the soil (Butterbach-Bahl et al., 2004). Fertilisation rate gives the amount of nitrogen input (natural and/or anthropogenic), in part responsible for the rate of gaseous emission at the surface (Sanhueza et al., 1990). Sand percentage is an important feature for emissions through its link with water diffusion (Roelle at al., 2001). pH conditions can influence NO emissions via chemical or bio-logical processes (Serc¸a et al., 1994). Wind speed is used to represent the state of the atmosphere at a given time (Delon et al., 2007).
2.4 Numerical experiments
In the following, in order to test the short term sensitivity of ozone formation to the soil NOxemission, 4 simulations are discussed, and summarised in Table 2:
– CTRL run: with anthropogenic emissions only, without biogenic NO emission from soils, without LiNOx.
– YL95 run: with biogenic NO emissions from the GEIA database (Yienger and Levy, 1995), including CRF (Canopy Reduction Factor), monthly temporal resolu-tion, 1◦/1◦ spatial resolution, with LiNOx.
– SOILNOX run: with NO emissions from soils calcu-lated on-line with the ANN algorithm, including CRF, without LiNOx.
– ALLNOX run: with ANN NO emissions from soils and CRF, with LiNOx.
Fig. 2. (a) Biogenic NO emissions from soil (1010molec cm−2.s−1) in August, provided by GEIA database, from Yienger and Levy (1995) inventory, (b) biogenic emis-sions from soils (1010molec cm−2s−1) provided by the on line ANN algorithm, 2006/08/06 15:00 UTC, and (c) soil moisture (%),2006/08/06 15:00 UTC. Red circles highlight the correspon-dence between strong moisture and high emissions.
Anthropogenic emissions are included in all simulations. Biomass burning emissions are not included as fires dur-ing the wet season are rare and are mostly located in the southern hemisphere. Intrusions of southern hemispheric fire plumes in the middle and lower troposphere are limited to the Guinean coast (Mari et al., 2008).
3 Experimental data: NOxand O3concentrations from
the UK BAe-146, flight B227
In this study, we will focus on a particular flight during the wet season (flight B227), where chemistry measurements were made. A mesoscale convective system (MCS) formed over the eastern Niger late in the evening of the 5 of August. It reached Niamey early in the morning of the 6 August. In the afternoon of the 6 August, the FAAM (Facility for Air-borne Atmospheric Measurements, http://www.faam.ac.uk/) UK BAe-146 Atmospheric Research Aircraft performed a post convective flight (B227) along the MCS track, north-east of Niamey (13.5–17.5◦N, 2.3–6.5◦E, between 13:00 and 17:00 UTC).
Data used in this study concern NOx and O3 concentra-tions. NOx measurements were made using the University of East Anglia (UEA) NOxy, which measures NO by chemi-luminescence and NO2by photolytic conversion of NO2to NO. Detection limits of the UEA NOxy are∼3 pptv for NO and∼15 pptv for NO2with a 10-s integration. Details of this instrument can be found in Brough et al. (2003).
Table 2.Simulation configurations.
Run name CTRL YL95 SOILNOX ALLNOX
Biogenic NO emissions No Yienger and Levy (1995) Delon et al. (2007) Delon et al. (2007)
Canopy Reduction Factor No Yes Yes Yes
Lightning NOx(LiNOx) No Mari et al. (2006) No Mari et al. (2006)
addition of a drier. The inlet from the port air sample pipe is pumped via a buffer volume to maintain the inlet air at near surface pressure. All surfaces in contact with the sample in-cluding the pump are of Polytetrafluoroethylene (PTFE) or PFA. The instrument has a range of 0–2000 ppbv, a detection limit of 2 ppbv, and a linearity of 5%±2pptv (as stated by the manufacturer).
4 Sensitivity analysis of biogenic NO sources
The majority of Chemistry Transport Models (CTM) use the Yienger and Levy (1995) inventory to provide biogenic NO emissions from soils. However, in some parts of the world like West Africa, few in situ measurements are available, leading to inaccurate estimates of emissions, and these emis-sions give an underestimate of concentrations in the lower troposphere (Jaegle et al., 2005).
Figure 2 shows a comparison between biogenic NO emis-sions from Yienger and Levy (1995), at monthly and 1◦/1◦ resolution (Fig. 2a), NO emissions calculated from the ANN on 2006/08/06, 15:00 UTC (Fig. 2b), and surface moisture at the same time (Fig. 2c). Emissions from YL95 range from 1 to 4×10¹⁰molec cm−2s−1, and ALLNOX emissions range from 1 to 15×1010molec cm−2s−1.
The spatial distribution is rather different between the 2 figures, partly due to the difference in spatial resolution of the emissions (1◦/1◦ for YL95, and 20 km/20 km for ANN). The emissions in the ANN case are linked to environmental parameters, and specifically to surface moisture, as shown in Figs. 2b and 2c. Indeed, mean surface moisture is higher in the southern part of the domain where the vegetation is more dense and precipitation events more intense, implying stronger emissions in those regions. In the northern part of the domain, emission is more linked to individual precipita-tion events, inducing higher emissions of NO (for example into the red circles on Fig. 2b and 2c). When surface mois-ture decreases in the north, due to the drying of soils after the rain event, emissions decrease as well, whereas they re-main stable in the south during the diurnal cycle because of the less variable values of surface moisture. Indeed, the dry-ing of soils in the Sahel is around 1–2 days (Taylor and Ellis, 2006). NO emissions from sandy soils have been found to decrease rapidly, over 2–3 days after wetting (Scholes et al., 1997; Johansson et al., 1988). This moisture effect and the
latitudinal distribution of pH values, (lower in the south, as shown in Fig. 1a), lead to the higher emissions in the south.
Furthermore, strong emissions in the south are also linked to the sand percentage (Fig. 1b) which ranges from 40 to 90% in the domain, with the highest emissions associated with values around 52%. This result has been verified in a field campaign in Hombori (Mali) in July 2004, where the strongest fluxes (30 gN ha−1d−1) were found from a soil where sand percentage was 57% and pH was 6, compared to Sahelian soils which typically are 92% sand, with a pH around 7, where fluxes ranged between 2–15 gN ha−1d−1 (Delon et al., 2007). High sand percentage results in a higher evaporation rate and so the water content of the soil does not remain high enough to favour the microbial processes re-sponsible for NO emission. Indeed, soil microbial activity is influenced by soil water content and by soil physical prop-erties (regulating aeration-dependant microbial activities im-portant to nutrient cycling, Skopp et al., 1999).
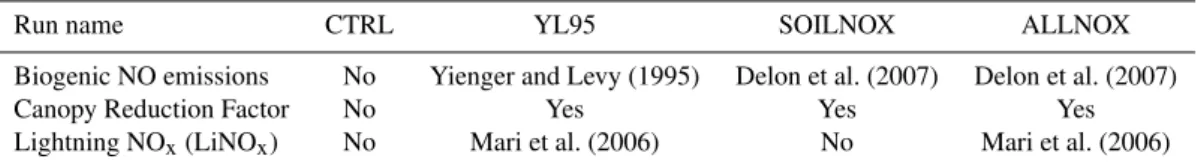
Fig. 3. Differences in NOxconcentrations (ppt), from surface to 2000 m, on a North South transect at 4◦E, for the 4 simulations detailed in the text: (a)YL95–CTRL,(b)SOILNOX-CTRL,(c) ALLNOX-YL95. 2006/08/06 15:00 UTC.
Fig. 4. Differences in O3 concentrations (ppb), from surface to 2000 m, on a North South transect at 4◦E, for the 4 simulations detailed in the text: (a)YL95–CTRL,(b)SOILNOX-CTRL,(c) ALLNOX-YL95, 2006/08/06 15:00 UTC.
5 Short term impact of soil and lightning NO emissions on NOx and O3 concentrations in the lower
tropo-sphere
Figure 3 shows the comparison between the 4 simulations previously described, at 15:00 UTC between 0 and 2 km al-titude, on a vertical cross section at 4◦E, from 21 to 7◦N. 15:00 UTC corresponds to the maximum dispersion of sur-face emitted species as this is when the boundary layer is deepest. Note that the transect between 7 and 21◦N covers a large spectrum of vegetation, through mosaic forest, crop-land, grassland and desert. Figure 3a, (YL95-CTRL) shows the impact of soil NOxemissions from the YL95 inventory, compared to anthropogenic emission only. The YL95
inven-Fig. 5. Differences in(a)NOxconcentration and(b)O3 concen-tration between ALLNOX and SOILNOX simulations. 2006/08/06 21:00 UTC.
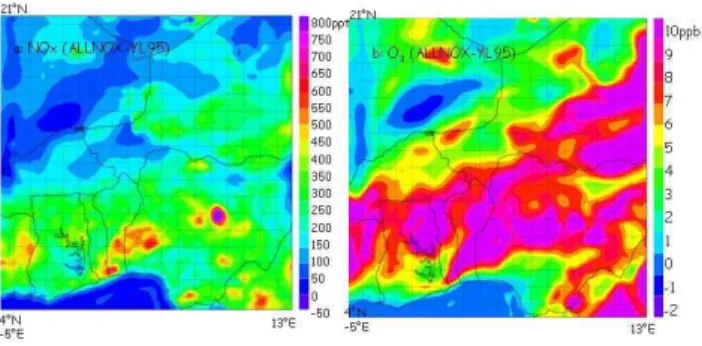
tory gives an increase in NOxranging from 50 ppt to 250 ppt. Figure 3b gives the concentration difference between SOIL-NOX and CTRL simulations, showing that the introduction of ANN on-line emissions increases the NOxconcentrations in the lower troposphere by up to 900 ppt. The impact of ANN emissions (ALLNOX) compared to YL95 emissions, is given in Fig. 3c (ALLNOX-YL95), showing a difference in NOxconcentrations up to 800 ppt in the south, 300 ppt in the north.
As NOxis one of the principal precursors of tropospheric ozone, the impact of NO emissions from soils also has an in-fluence on ozone concentration. Fig.4 shows ozone concen-tration differences between the 4 simulations. The difference between CTRL (anthropogenic emissions only) and YL95 reaches 10 ppb (Fig.4a). The difference is greater when com-paring CTRL with SOILNOX (biogenic ANN emissions, Fig. 4b). The ozone is simulated to increase at all latitudes, showing that even a moderate increase in NOx concentra-tion leads to dramatic changes in O3 formation, which is characteristic of a NOx-limited regime. The introduction of on-line ANN NO emissions leads to a large increase of O3 concentrations near the surface and up to 1km (Fig.4b, up to 14 ppb between 0 and 2 km. Comparison between YL95 and ALLNOX (Fig.4c) simulations (LiNOx in both of them) shows a broader increase of O3in ALLNOX (difference up to 13 ppb).
Fig. 6. The track (latitude vs. longitude) of flight B227 of the BAe-146, 2006/08/06.
while all continental regions have an afternoon peak (13:00– 15:00 LT) in deep convection for non-MCS events, Africa’s MCS convective intensity rises to a maximum level between 19:00 and 05:00 LT (Nesbitt and Zipser, 2003). Here the simulated convective event is the most intense at 21:00 UTC (NOxdifferences range from 0 to 2 ppb around 9–14 km alti-tude, whereas the maximum O3difference is located around 6–8 km, and reaches up to 9 ppb). Once produced inside the convective cloud, NO is redistributed by updrafts and down-drafts. Ozone is also transported, which could explain why the maximum in ozone change is not at the same altitude as the maximum in NOxconcentration change. NO concentra-tions have been measured up to 12 km height by the DLR Fal-con F20 during the AMMA campaign, and range from 0.1 to 1.5 ppb, between 10 and 12 km (H. Schlager, personal com-munication). Furthermore, Saunois et al. (2008) and Sauvage et al. (2007) from their analysis of the data obtained from the MOZAIC program in West Africa state that the average NOx concentrations in the upper troposphere is∼0.95 ppb in this region. The concentrations obtained in the simulation are consistent with these measurements.
6 Validation of simulation results with aircraft observa-tions
The comparison between measurements and model is made with the ALLNOX and YL95 simulation results, in order to find which of the two methods of emission calculation gives the more realistic results in terms of NOxand O3atmospheric concentrations.
As mentioned in section 2.3, ozone and NOx concentra-tions were measured in August 2006 onboard the UK BAe aircraft. The B227 flight track (6 August) is presented in Fig. 6. During the flight, the aircraft performed a series of legs around 500 m between 15 and 17◦N, 4 and 5◦E, and 15:00–16:30 UTC, to sample NOxconcentrations above
re-Fig. 7. NOxconcentrations in ppt from the UK BAe data between 450 and 650 m ASL, flight B227 (in blue), from the ALLNOX sim-ulation (full purple line), and from the YL95 simsim-ulation (dotted pur-ple line) at 500 m ASL
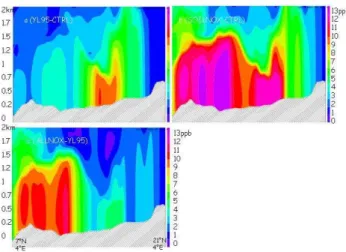
Fig. 8. Vertical cut of NOxconcentrations in ppt (4.0◦E, from 7 to 21◦N), ALLNOX simulation, from 0 to 2000 m. 2006/08/06 15:00 UTC
Fig. 9.O3concentrations from the UK BAe data between 450 and 650 m ASL, flight B227 (in blue) at 500-m height above sea level, from ALLNOX simulation (full purple line) and YL95 simulation (dotted purple line) at 15:00 UTC, 6 August, on the low level B227 flight track.
from soils calculated with ANN responds to changes in soil moisture (Fig. 2b) giving enhanced emissions over the wet-ted soil within the red circle. These enhanced emissions then lead to elevated concentrations of NOx (between 450 and 500 ppt) in the lower layers of the model in the location of flight track of B227 (14–16◦N) (Fig. 7) and as illustrated by the cross section along 4◦E (Fig. 8). This demonstrates that the model is capturing the response of the soil to the storm on the 5 August leading to enhanced concentrations of NOxin the boundary layer as observed during B227 (shown in Fig. 7). The increase in the model is not as high as in the observations (nearly 450 pptv and 800 pptv respectively), suggesting that the modelled emission from the soil is not sufficient to reach the high measured concentrations. Alter-natively the dynamical structure of the lower layers of the troposphere in the model is also likely to be responsible for the lack of vertical mixing of the compounds (this point will be discussed below). However, the ANN algorithm gives the model the ability to approach observed concentrations of NOx over wetted soils, whereas YL95 gives a weaker and smoother signal, not connected to enhanced soil moisture.
Figure 9 shows the comparison between YL95, ALLNOX simulations and observations for ozone, at the coordinates of the low level flight tracks (same as in Fig.7, but for ozone). ALLNOX gives a better representation of the observed ozone concentrations. Both model runs underpredict the concen-trations of ozone with ALLNOX giving values of between 30 and 34 ppb and YL95 values of between 28 and 30 ppb whilst the observed are 37 and 44 ppb. However the ALL-NOX simulation reproduced more accurately the enhance-ment of ozone over the wetted patch as seen in the observa-tions. This is further illustrated by the good correlation co-efficient of 0.74 between NOxand O3concentrations in the
Fig. 10. NOxconcentrations in ppb from the UK BAe data below 700 m, all flights (purple), and from the ALLNOX simulation (blue) at 500 m ASL.
ALLNOX run between 13 and 18◦N compared to 0.6 in the YL95 case (a slight increase of 1ppb of ozone is connected to a slight increase of 50ppt in NOx). NOxdata measured below 700 m during all flights between 5 and 18◦N, extending from 3◦W to 6◦E, and between 5 to 17 August, together with sim-ulated NOx at 4.5◦E (6 August 15:00 UTC), are illustrated in Fig. 10 and provide a regional view of the NOxlatitudinal distribution. Measured NOxdata range from 100 to 800 ppt between 5 and 18◦N, with means for 0.5 latitude bins mostly being below 400 ppt. Note that the higher measured concen-trations around 7◦N are from anthropogenic sources around Lagos. The higher simulated concentrations do not corre-spond to the measured ones. The concentrations around 400-800 ppt north of 14◦N are mostly related to recently wet-ted soils which were observed in this region (Stewart et al., 2008), and are reproduced by the model for 6 August as de-scribed above. The disagreement south of 13◦N could be due to several reasons: the pH effect on NO emissions is overes-timated in the south of the domain, and the CRF effect is not strong enough, due to an underestimate of vegetation cover. Further work is planned on these two issues to improve the spatial repartition of NO fluxes.
Fig. 11. Differences between ALLNOX and YL95 simulations at 200 m above ground level (corresponds to∼450 m above sea level in the region of Niamey) for(a)NOxconcentration and(b)ozone concentration. 2006/08/06 15:00 UTC.
layers of the atmosphere in the model is different from that observed. A mixed layer from surface up to 4000 m is sug-gested by the observed data (as stated by the B227 mission report), whereas the model shows a strong stratification be-tween the boundary layer and the layer above. These differ-ences in dynamical structures lead to differdiffer-ences in the trans-port and mixing and processing of chemical species emitted at the surface. This could be a beginning of an explanation for the underestimate of ozone concentrations. Further in-sight into the dynamical behaviour of the boundary layer for this particular episode is needed to improve the understand-ing of the vertical distribution of chemical species.
Figure 11 gives an idea of the difference of the impacts between YL95 and ALLNOX simulations, over the whole domain, at 200 m height above ground level (∼450 m above sea level in the Niamey region). The ALLNOX simulation gives higher levels of NOxand ozone than the YL95 simula-tion. Differences in NOxconcentrations at this altitude reach 700 ppt (ALLNOX>YL95, Fig. 11a), and the ozone differ-ence ranges between –2 and +10 ppb, with most being posi-tive values (posiposi-tive difference means that ALLNOX>YL95, Fig. 11b). The ANN model is an improvement on YL95 in the region where it is applied, but there is still further work that can be done to understand the too weak influence on ozone formation.
7 Summary and conclusion
The influence of soil biogenic NO emissions on ozone and NOx concentrations over West Africa is assessed in the framework of the AMMA campaign. A specific algorithm of emission has been processed by a neural network, and has been incorporated on-line in the model MesoNH-Chemistry. It is compared to the Yienger and Levy inventory (monthly and 1◦/1◦ resolution) through the influence on NOxand O3 atmospheric concentrations. The neural network emissions are distributed differently in space (with stronger emissions
in the south of the simulation domain), and follow the evolu-tion of environmental parameters, specifically surface mois-ture, at the time step of the model.
The results of 4 different 48 h simulations are compared to assess the impact of these different soil emission scenar-ios along with emissions from lightning. The influence of LiNOx is mostly around 10 km altitude, and not significant near the surface. The influence of the neural network emis-sions on NOx and ozone concentration is stronger than the YL95 emissions, and in places involves an increase of 2 to 15 ppb of ozone in the lower troposphere (0–2000 m). The main advantage of the neural network algorithm is its im-mediate connection to surface temperature and moisture, key parameters in tropical climate for biogenic NO emissions. Static inventories do not allow this immediate response of emissions to surface properties.
Acknowledgements. Based on a French initiative, AMMA was built by an international scientific group and is currently funded by a large number of agencies, especially from France, the United Kingdom, the United States, and Africa. It has been the beneficiary of a major financial contribution from the European Community Sixth Framework Research Programme. Detailed information on scientific coordination and funding is available on the AMMA International Web site at www.amma-international.org. This work was funded by the EU and by the UK Natural Environment Research Council through the AMMA-UK Consortium grant and the National Centre for Atmospheric Science.
Edited by: J. Williams
References
Baer, M. and Nester, K.: Parametrization of trace gas dry depo-sition velocities for a regional mesoscale diffusion model, Ann. Geophys., 10, 912–923, 1992,
http://www.ann-geophys.net/10/912/1992/.
Baker B., Bai, J. H., Johnson, C., Cai, Z. T., Li, Q. J., Wang, Y. F., Guenther, A., Greenberg, J., Klinger, L., Geron, C., Rasmussen, R.: Wet and dry season ecosystem level fluxes of isoprene and monoterpenes from a southeast Asian secondary forest and rub-ber tree plantation, Atmos. Env. 39, 381–390, 2005.
Bechtold, P., Bazile, E., Guichard, F., Mascart, P., and Richard, E.: A mass flux convection scheme for regional and global models, Q. J. R. Meteorol. Soc., 127(573), 869–886, 2001.
Bradshaw J., Davis, D., Grodzinsky, G., Smyth, S., Newell, R., Sandholm, S., and Liu, S.: Observed distributions of nitrogen oxides in the remote free troposphere from the NASA global tro-pospheric experiment programs, Rev. Geophys., 38(1), 61–116, 2000.
Brough, N., Reeves, C. E., Penkett, S. A. Stewart, D. J., Dewey, K., Kent, J., Barjat, H., Monks, P. S., Ziereis, H., Stock, P., Huntrieser, H., and Schlager, H.: Intercomparison of aircraft instruments on board the C-130 and Falcon 20 over southern Germany during EXPORT 2000, Atmos. Chem. Phys., 3, 1–12, 2003,
http://www.atmos-chem-phys.net/3/1/2003/.
Butterbach-Bahl, K., Stange, F., Papen, H., and Li, C: Regional in-ventory of nitric oxide and nitrous axide emissions for forest soils of southeast Germany using the biogeochemical model PnET-N-DNDC, J. Geophys. Res., 106, 34 155–34 166, 2001.
Butterbach-Bahl, K., Kock, M., Willibald, G., Hewett, B., Buha-giar, S., Papen, H., and co-authors: Temporal variations of fluxes of NO,NO2, N2O, CO2 and CH4 in a tropical rain forest ecosystem, Glob. Biogeochem. Cy., 18, GB3012, doi:10.1029/2004GB002243, 2004.
Crassier, V., Suhre, K., Tulet, P., and Rosset, R.: Development of a reduced chemical scheme for use in mesoscale meteorological models, Atmos. Env., 34(16), 2633–2644, 2000.
Cuxart J., Bougeault, P., and Redelsperger, J. L.: A turbulene scheme allowing for mesoscale and large eddy simulations, Q. J. R. Meteorol. Soc., 126, 1–30, 2000.
Chaboureau J.-P., Tulet, P., and Mari, C.: Diurnal cycle of dust and cirrus over West Africa as seen from Meteosat Second Gener-ation satellite and a regional forecast model, G. R. L., 34(2), L02822, doi:10.1029/2006GL027771, 2007.
Davidson E. A. and Kingerlee, W.: A global inventory of nitric ox-ide emissions from soils, Nutrient Cycling of Agroecosystems, 48, 37–50, 1997.
Delon C., Serc¸a, D., Boissard, C., Dupont, R., Dutot, A., Laville, P., de Rosnay, P., and Delmas, R.: Soil NO emissions modelling using artificial neural network, Tellus B, 59B, 502–513, 2007. Erisman, J. and Baldocchi, D.: Modelling dry deposition of so2,
Tellus, Ser.B, 46, 159–171, 1994.
Ganzeveld, L. N., Lelieveld, J., Dentener, F. J., Krol, M. C., Bouwman, A. J. and Roelofs, G. J.: Global soil-biogenic NOx emissions and the role of canopy processes, J. Geophys. Res., 107(D16), 4298, doi:10.1029/2001JD001289, 2002.
Granier, C., Lamarque, J. F., Mieville, A., Muller, J. F., Olivier, J., Orlando, J., Peters, J., Petron, G., Tyndall, G., and Wal-lens, S.: POET, a database of surface emissions of ozone pre-cursors, available on internet at http://www.aero.jussieu.fr/projet/ ACCENT/POET.php, 2005.
Guenther, A., Hewitt, C., Erickson, D., Fall, R., Geron, C., Graedel, T., Harley, P., Klinger, L., Lerdau, M., McKay, W., Pierce, T., Scholes, B., Steinbrecher, R., Tallamraju, R., Taylor, J., Zimmer-man, P.: A global model of natural volatile organic compound emissions, J. Geophys. Res., 100, 8873–8892, 1995.
Jacob, D. J. and Bakwin, P. S.: Cycling of NOx in tropical forest canopies. In:W.B.Whitman (Editor), Microbial Production and consumption of greenhouse gases, American Soc. of Microbiol-ogy, Washington, D.C., 237–253, 1992.
Jaegle, L., Martin, R. V., Chance, K., Steinberger, L., Kurosu, T. P., Jacob, D. J., Modi, A. I., Yobou´e, V., Sigha-Nkamdjou, L., and Galy-Lacaux, C.: Satellite mapping of rain-induced ni-tric oxide emissions from soils, J. Geophys. Res., 109, D21230, doi:10.1029/2003JD004406, 2004.
Jaegle, L., Steinberger, L., Randall, V., and Chance, K.: Global Par-titioning of NOx sources using satellite observations: Relative role of fossil fuel combustion, biomass burning and soil emis-sions, Faraday Discuss., 130, 407–423, 2005.
Johansson C., Rhode, H., and Sanhueza, E.: Emission of NO in a tropical savanna and a cloud forest during the dry season, J. Geophys. Res., 93(D6), 7180–7192, 1988.
Kesik, M., Ambus, P., Baritz, R., Br¨uggemann, N., Butterbach-Bahl, K., Damm, M., Duyser, J., Horvath, L., Kiese, R., Kitzler, B., Leip, A., Li, C., Pihlatie, M., Pilegaard, K., Seufert, G., Simp-son, D., Skiba, U., Smiatek, G., Vesala, T., and Zechmeister-Boltenstern, S.: Inventories of N2O and NO emissions from Eu-ropean forest soils, Biogeosciences, 2, 353–375., 2005. Kiese, R., Li, C., Hilbert, D. W., Papen, H., and Butterbach-Bahl,
K.: Regional application of PnET-N-DNDC for estimating the N2O source strength of tropical rainforests in Wet Tropics of Australia, Global Change Biol., 11(1), 128–144, 2005.
Lafore, J.-P., Stein, J., Asencio, N., Bougeault, P., Ducrocq, V., Duron, J., Fischer, C., Hereil, P., Mascart, P., Pinty, J.-P., Re-delsperger, J.-L., Richard, E., and Vila-Guerau de Arellano, J.: The Meso-NH Atmospheric simulation system, I. Adiabatic for-mulation and control sifor-mulations, Ann. Geophys., 16, 90–109, 1998,
http://www.ann-geophys.net/16/90/1998/.
1987.
Ludwig, J., Meixner, F. X., Vogel, B., and F¨orstner J.: Soil-air ex-change fo nitric oxide: An overview of processes, environmental factors, and modelling studies, Biogeochemistry, 52, 225–257, 2001.
Mari, C. and Prospero, J.: African Monsoon Multidisciplinary Analysis-Atmospheric Chemistry (AMMA-AC): a new IGAC task; IGACtivities Newsletter, 31, 2–13, 2005.
Mari, C., Chaboureau, J.-P., Pinty, J.-P., Duron, J., Mascart, P., Cammas, J.-P., Gheusi, F., Fehr, T., Schlager, H., Roiger, A., Lichtenstein, M., and Stock, P.: Regional lightning NOxsources during the TROCCINOX experiment, Atmos. Chem. Phys., 6, 3487–3503, 2006,
http://www.atmos-chem-phys.net/6/3487/2006/.
Mari, C. H., Cailley, G., Corre, L., Saunois, M., Attie, J. L., Thouret, V., and Stohl, A.: Tracing biomass burning plumes from the Southern Hemisphere during the AMMA 2006 wet sea-son experiment, Atmos. Chem. Phys. Discuss., 7, 17 339–17 366, 2008
Masson, V., Champeaux, J.-L., Chauvin, F., Meriguet, C., and La-caze, R.: A global database of land surface parameters at 1-km resolution in meteorological and climate models, J. Climate, 16(9), 1261–1282, 2003.
Meyer-Arnek, J., Ladst¨atter-Weissenmayer, A., Richter, A., Wit-trock, F., and Burrows, J.: A study of the trace gas columns of O3, NO2and HCHO over Africa in September 1997, Faraday Discuss., 130, 387–405, doi:10.1039/b502106p, 2005.
Nesbitt, S. W. and Zipser, E. J.: The diurnal cycle of rainfall and convective intensity according to three years of TRMM measure-ments, J. Climate, 16, 1456–1475, 2003.
Noilhan J. and Planton, S.: A simple parameterization of land sur-face processes for meteorological models, Mon. Weather Rev., 117, 536–549, 1989.
Otter, L. B., Yang, W. X., Scholes, M. C., and Meixner, F. X.: Nitric oxide emissions from a Southern African Savanna, J. Geophys. Res., 104, 18 471–18 485, 1999.
Pickering, K. E., Thompson, A. M., Dickerson, R. R., Luke, W. T., McNamara, D. P., Greenberg, J., and Zimmermann, P. R.: Model calculations of tropospheric ozone production potential follow-ing observed convective events, J. Geophys. Res., 95, 14 049– 14 062, 1990.
Pickering, K. E., Wang, Y., Tao, W. K., Price, C., and M¨uller, J. F.: Vertical distributions of lightning NOxfor use in regional and global chemical transport models, J. Geophys. Res., 103, 31 203– 31 216., 1998.
Potter, C. S., Matson, P. A., Vitousek, P. M., and Davidson, E. A.: Process modelling of controls on nitrogen trace gas emissions from soils worldwide, J. Geophys. Res., 101, 1361–1377, 1996. Pilegaard, K., Skiba, U., Ambus, P., Beier, C., Br¨uggemann, N.,
Butterbach-Bahl, K., Dick, J., Dorsey, J., duyzer, J., Gallagher, M., Gasche, R., Horvath, L., Kitzler, B., Leip, A., Pihlatie, M. K., Rosenkranz, P., Seufert, G., Vesala, T., Westrate, H., and Zechmeister-Boltenstern, S.: Factors controlling regional differ-ences in forest soil emission of nitrogen oxides (NO and N2O), Biogeosciences, 3, 651–661, 2006,
http://www.biogeosciences.net/3/651/2006/.
Redelsperger J.-L., Thorncroft, C. D., Diedhiou, A., Lebel, T., Parker, D. J. and Polcher, J.: African Monsoon Multidisciplinary Analysis: An International Research Project and Field
Cam-paign, Bull. Amer. Meteor. Soc., 87, 1739–1746, 2006. Roelle, P. A., Aneja, V. P., Gay, B., Geron, C., and Pierce, T.:
Bio-genic nitric oxide emissions from cropland soils, Atmos. Envi-ron., 35, 115–124, 2001.
Sanhueza, E., Hao, W. M., Scharffe, D., Donoso, L., and Crutzen, P. J.: (NO and N2O) emissions from soils of the Northern part of the Guyana Shield, Venezuela, J. Geophys. Res. 95, 22 481– 22 488, 1990.
Saunois, M., Mari, C., Thouret, V., Cammas, J. P., Peyrille, P., Lafore, J. P., Sauvage, B., Volz-Thomas, A., Nedelec, P., and Pinty, J. P: An idealized two-dimensional model approach to study the impact of the West African monsoon on the meridional gradient of tropospheric ozone, J. Geophys. Res.,113, D07306, doi:10.1029/2007JD008707, in press, 2008.
Sauvage, B., Thouret, V., Cammas, J.-P., Brioude, J., Ned-elec, P., and Mari, C.: Meridional ozone gradients in the African upper troposphere, Geophys. Res. Lett. 34(3), 03817, doi:10.1029/2006GL028542, 2007.
Schlecht, E., Fernandez-Rivera, S., and Hiernaux, P.: Timing, size and nitrogen concentration of faecal and urinary excretions in cattle, sheep and goats: Can they be exploited for better ma-nuring of cropland?, Soil Fertility Management in West African Land Use Systems, edited by: Renard, G., Neef, A., Becker K., and von Oppen, M., Niamey, Niger, Margarf Verlag, Weiker-sheim, Germany, 1997.
Scholes, M. C., Martin, R., Scholes, R. J., Parsons, D., and Win-stead, E.: NO and N2O emissions from savanna soils following the first simulated rains of the season, Nutrient Cycling in Agroe-cosystems, 48, 115–122, 1997.
Serc¸a, D., Delmas, R., Jambert, C., and Labroue, L.: Emissions of nitrogen oxides from equatorial rain forest in central Africa: origin and regulation of NO emissions from soils, Tellus 46B, 243–254, 1994.
Skopp, J., Jawson, M. D., and Doran, J. W.: Steady state aerobic microbial activity as a function of soil water content, Soil Sci. Soc. Am. J., 54, 1619–1625, 1990.
Stewart, D. J., Taylor, C. M., Reeves, C. E., and McQuaid, J. B.: Biogenic nitrogen oxide emissions from soils. Impact on NOx and ozone over West Africa during AMMA (African Monsoon Multidisciplinary Analysis): Observational study, Atmos. Chem. Phys. Discuss., 7, 16 253–16 282, 2008.
Suhre, K., Crassier, V., Mari, C., Rosset, R., Johnson, D. W., Os-borne, S., Wood, R., Andreae, M. O., Bandy, B., Bates, T. S., Businger, S., Gerbig, C., Raes, F., Rudolph, J.: Chemistry and aerosols in the marine boundary layer: 1-D modelling of the three ACE-2 Lagrangian experiments, Atmos. Env., 34, 5079– 5094, 2000.
Taylor, C. M. and Ellis, R. J.: Satellite detection of soil moisture impacts on convection at the mesoscale, Geophys. Res. Lett., 33, L03404, doi:10.1029/2005GL025252, 2006.
Tulet, P., Crassier, V., Solmon, F., Guedalia, D., and Rosset, R.: De-scription of the Mesoscale Nonhydrostatic Chemistry model and application to a transboundary pollution episode between north-ern France and southnorth-ern England, J. Geophys. Res., 108, 4021, doi:10.1029/2000JD000301, 2003.
Wesely, M.: Parametrizations of surface resistance to gaseous dry deposition in regional scale, numerical models, Atmos. Environ., 23, 1293–1304, 1989.
rates of sulfur dioxide and similar gases on vegetation, J. Air Control Assoc., 27, 1110–1116, 1977.
Williams, E. J., Guenther, A., and Fehsenfeld, F. C.: An inventory of nitric oxide emissions from soils in the United States, J. Geo-phys. Res., 97, 7511–7519, 1992.
Yan, X., Ohara, T., and Akimoto, H.: Statistical modelling of global soil NOxemissions, Glob. Biogeochem. Cy., 19, GB3019, doi:10.1029/2004GB002276, 2005.
Yang, W. X. and Meixner, F. X.: Laboratory studies on the release of nitric oxide from sub-tropical grassland soils: The effect of soil temperature and moisture, in: Gaseous Nitrogen Emissions from Grasslands, edited by: Jarvis, S. C. and Pain, B. F., 67–70, CAB International, Wallingford, New York, 1997.