1
Corresponding author:
E-mail: [email protected]
Received:September 16, 2016.
Accepted : March 28, 2017.
Copyright: All the contents of this journal, except where otherwise noted, is licensed under a Creative Commons Attribution License.
Parametric and non-parametric indexes applied in the
selection of sour passion fruit progenies
Edinéia Zulian Dalbosco
1, Willian Krause
2, Leonarda Grillo Neves
3, Dejânia Vieira de Araújo
2,
Kemely Mara Ramalho Hiega
1, Cintia Graciele da Silva
1Abstract - Several traits must be observed in the selection of sour passion fruit progenies. For such, selection indices could be used for gradually increasing the frequency of favorable genotypes for the set of the traits of interest. This study aimed to compare parametric and non-parametric selection indices to be used in the selection of passion fruit progenies and identify the best economic
weights. Thus, 118 full-sib families and three controls were assessed for days regarding flowering,
productivity in kg ha-1 year, fruit mass in g, number of fruits, average length of fruits in mm,
average fruit diameter in mm, fruit shape, average shell thickness in mm, pulp yield, pulp color, total soluble solids, titratable acidity and SS/ATT ratio. The non-parametric selection indexes used to obtain genetic gains were Mulamba and Mock, genotype-ideotype distance, multiplicative and Elston. Smith and Hazel, Williams and Pesek and Baker parametric indexes were used, with different economic weights attributed. The Mulamba and Mock, genotype-ideotype distance non-parametric selection indexes and the Williams non-parametric index showed satisfactory and balanced
gains. The genetic variation coefficient, genetic standard deviation and random weight economic
weights provided higher gains for non-parametric selection indexes. Similar gains were obtained for parametric indexes, regardless of assigned weight, except for Pesek and Baker, whose genetic standard deviation provided the highest gain.
Index terms: Genetic gains, recurrent selection, Passiflora edulis.
Índices paramétricos e não paramétricos aplicados na
seleção de progênies de maracujazeiro-azedo
Resumo – Na seleção de progênies de maracujazeiro-azedo, várias características devem ser observadas. Uma alternativa é o uso de índices de seleção que visem a melhorar gradativamente as frequências de genótipos favoráveis para o conjunto de características de interesse. O objetivo deste trabalho foi comparar índices de seleção paramétricos e não paramétricos na seleção de progênies
de maracujazeiro-azedo e identificar os melhores pesos econômicos. Desta forma, 118 famílias de irmãos completos e três testemunhas foram avaliadas para dias para o florescimento, produtividade
em kg ha-1 ano, massa de frutos em g, número de frutos, comprimento médio dos frutos em mm,
diâmetro médio de frutos em mm, formato de fruto, espessura média de casca em mm, rendimento de polpa, coloração da polpa, teor de sólidos solúveis totais, acidez total titulável e ratio. Os índices de seleção não paramétricos empregados para a obtenção dos ganhos genéticos foram Mulamba e Mock, distância genótipo ideótipo, multiplicativo e Elston, e os índices paramétricos foram de
Smith e Hazel, Williams e Pesek e Baker, com a atribuição de diferentes pesos econômicos. Os
índices de seleção não paramétricos de Mulamba e Mock, distância genótipo ideótipo e o índice
paramétrico de Williams apresentaram ganhos satisfatórios e equilibrados. Os pesos econômicos coeficiente de variação genético, desvio-padrão genético e peso aleatório proporcionaram maiores
ganhos para os índices de seleção não paramétricos; para os índices paramétricos, os ganhos foram semelhantes, independentemente do peso atribuído, exceto para o índice de Pesek e Baker, em que o desvio-padrão genético proporcionou o maior ganho.
Termos para indexação: Ganhos genéticos, seleção recorrente, Passiflora edulis.
1Graduate Program in Genetics and Plant Breeding, Centro de Pesquisas, Estudos e Desenvolvimento Agro-ambientais, Universidade do Estado de Mato Grosso. E-mail: [email protected], [email protected], [email protected]
2Teacher Program in Genetics and Plant Breeding, Centro de Pesquisas, Estudos e Desenvolvimento Agro-ambientais, Universidade do Estado de Mato Grosso. E-mail: [email protected], [email protected]
Introduction
Intra-population recurrent selection has been applied in passion fruit genetic breeding (GONÇALVES et al., 2007; KRAUSE et al., 2012). One of its steps is the selection of progenies. At that stage, in addition to productivity, several fruit physical and chemical characteristics important for the fresh market and industry (MEDEIROS et al., 2009; ABREU et al., 2009; FERREIRA et al., 2010; GRECO et al., 2014) should be considered for selection. Although the direct selection of a trait is faster, easier and provides higher gain, it may cause favorable or unfavorable changes in other traits (CRUZ, 2006).
Thus, the use of selection indexes is a promising alternative to obtain genotypes that bring together all favorable traits simultaneously, present higher performance and meet market demands (CRUZ et al., 2012). According to Neves et al. (2011), the selection index is a multivariate technique that combines information on the various traits of agronomic interest with the genetic attributes of the population evaluated. In the selection index theory, a numerical value is obtained, which serves as an additional character, resulting from the combination of certain traits chosen for the performance of simultaneous selection. Therefore, the gain for a certain trait is reduced, but this reduction is compensated by the better distribution of gains in the set of traits (CRUZ et al., 2014).
There are several selection indexes, which can be
classified into parametric and non-parametric. Genetic
gains for parametric selection indexes are obtained by maximizing the correlation between the genotypic value and the index, aiming to achieve maximum selection
efficiency and, particularly, gradual improvement of the
frequency of favorable genotypes to the set of important traits (CRUZ, 2006). These indexes require matrixes of variances and genetic and phenotypic covariances related to the various traits evaluated. The classical Smith (1936) and Hazel (1943), Pesek and Baker (1969) and Williams (1962) stand out among indexes.
Non-parametric indexes, also known as
non-linear indexes, are aimed at the simple classification
of genotypes, and include those free of weights and parameters (ELSTON, 1963), multiplicative (SUBANDI et al., 1973), genotype-ideotype distance (CRUZ, 2006) and rank of sums (MULAMBA and MOCK, 1978). Several studies have demonstrated that the rank sum index is the most suitable for simultaneous selection in sour passion fruit (FREITAS et al., 2012; ROSADO et al., 2012; ASSUNÇÃO et al., 2015).
In addition to indexes of variances and genetic and phenotypic covariances, the economic weights of traits assessed are necessary for the estimation of parametric selection indexes. Economic weights are also used in some non-parametric indexes, such as the genotype-ideotype distance index (CRUZ, 2006) and the sum of ranks index (MULAMBA and MOCK, 1978). Lin (1978) reported
that the use of economic weights affects the selection gains, increases or decreases gains and its use is limiting in selection indexes. Cruz (2006) suggests using data to estimate economic weights, and the use of the genetic
variation coefficient is recommended. Several studies
on sour passion fruit growing have evaluated economic weights using different selection indexes (OLIVEIRA et al., 2008; NEVES et al., 2011; SILVA; VIANA, 2012).
Therefore, this study aimed to compare parametric and non-parametric selection indexes in the selection of sour passion fruit progenies and to identify the best economic weights for these indexes.
Material And Methods
The experiment was conducted at the experimental area of the State University of Mato Grosso, municipality of Tangará da Serra, MT (14º39’latitude, and 57º25’ longitude and altitude of 321 m a.s.l.), with tropical climate
and well defined dry and rainy seasons, average annual
rainfall ranging from 1300 to 2000 mm year-¹, annual temperature ranging from 16 to 36 ° C (MARTINS et al.,
2010). The soil is classified as Dystroferric Red Latosol
and the relief is plan to slightly wavy (EMBRAPA, 2006). Planting was carried out in September 2014, arranged in a randomized block design, with three replicates and three plants per plot, with spacing of 3.0 m between plants and 3.0 m between rows, so as to allow the use of machinery within the experiment. A vertical support structure was used to conduct plants, with 2.5 m
concrete posts, spacing of 6.0 m and flat wire number 12
at least 2.0 m from the ground. During the experiment, manual pollination was performed twice a week. Manual pollination was carried between noon and 05:00 pm,
in the period where flowers are open. With the aid of fingers, pollen grains were transported from flowers of one plant and to the flowers of another. At first, fingers were impregnated with pollen from various flowers of various plants. Then, with fingers full of pollen, the stigma of the flower to be pollinated was firstly touched, and then the pollen was removed from the anther of the same flower and carried to the next flower where the same process was
conducted. Zig zag pollination was performed.
One hundred and eighteen full-sib families (FIC) and three additional controls were assessed. One genotype was obtained from the UNEMAT sour passion fruit breeding program, called UNEMAT S30 population, as well as FB 200 and BRS Rubi do Cerrado commercial cultivars.
Trait productivity and number of fruits were
assessed only in the first year of cultivation as Cavalcante
(2015). The chemical and physical characteristics of fruits were assessed from May to September 2015.
The following traits were assessed: days for
flowering (DFL), productivity (Prod) in kg ha-1 year, fruit
fruits in mm (CF), average fruit diameter in mm (DF), fruit shape (FF), average shell thickness in mm (EC), pulp yield (RP), pulp color (CP), total soluble solids (SS), titratable acidity (ATT) and SS/ATT ratio.
Analysis of variance was performed for each trait using the Genes software system (CRUZ, 2013) and matrixes of averages and genotypic and phenotypic covariances were generated. The mean square values obtained through the analysis of variance were used to estimate genetic parameters.
Selection was simultaneously conducted for NF, Prod, MF, CF, DF, FF, RP, CP, SS and SS/ATT ratio traits aiming at increase and for DFL, EC and ATT traits, aiming at decrease.
Economic weights were the estimates of genetic
variation coefficient (CVg), genetic standard deviation (DPg), heritability (h2) and random weights (PA). Random
weights 20, 100, 10 were used, respectively, for NF, Prod and MF main traits. For the other traits, considered secondary, value equal to 1 was adopted.
In the genotype-ideotype distance index (CRUZ, 2006), the selection limit established was the highest mean of NF, Prod, MF, CF, DF, FF, RP, CP, SS and SS/ATT ratio traits; and the lowest mean of DFL, EC and ATT traits. The Elston index (1963) used the means of the traits under analysis and the selection criterion for NF, Prod, MF, CF, DF, FF, RP, CP, SS and SS/ATT ratio above ki; and DFL, EC and ATT below ki .
The rank sum index of Mulamba and Mock (1978)
involved the classification of genotypes for each of the
traits in an favorable order. Thus, we have: Ii = ∑ pjrij; where: Ii = index of the i-th FIC; pj = economic weight attributed to the j-th trait; rij = rank of the i-th FIC in the j-th trait.
In the Elston’s index free of weight and parameter (1963), the procedure was performed using the average traits as the cutoff point, given by the expression:
IEi = log ∏ (xij - kj) = log [xil - k1)(xi2 - k2) ... x
in - kn)]
Where: IEi = index free of weight and parameter in the i-th FIC; xij = average i-th FIC in the j-th trait; kj = the lowest value accepted for selection: n = the
FIC number, and min.xij and max.xij were, respectively, the lowest and highest average trait j.
Multiplicative Subandi et al. index (1973) - this index was calculated by the multiplication of standardized values of each trait for each FIC, as follows: Where: yj = refers to the average trait j; kj = 1, if the direct relation of the index with the variable is considered; and kj = -1, if the inverse relation of the index with the variable is considered.
The optimal values for each variable were defined for
the genotype-ideotype distance index (CRUZ, 2006), as well as the range of values considered favorable for
fruit growing. Mean, maximum and minimum values were calculated for each variable. Xij was considered as the average phenotypic value of the i-th genotype in relation to the j-th trait and also the Yij value, which is the mean phenotypic transformed value, and Cj is a constant related to the depreciation of the mean genotype, since it is not within standards desired by passion fruit growers. Therefore, we have: LIj = lower limit to be presented by the genotype related to trait j, according to standard desired by passion fruit growers. LSj = higher limit to be presented by the genotype; and VOj = optimal value to be presented by the genotype under selection. If LIj ≤ Xij ≤ LSj, then Yij = Xij; If Xij < LIj, Yij = Xij + VOj – LIj – Cj; If Xij > LSj, Yij = Xij + VOj – LSj +Cj. The procedure was considered Cj = LSj – LIj. The Cj value guarantees that Xij value within the interval variation around the optimal value resulted in Yij value with magnitude close to the optimal value (VOj), in opposition to Xij values outside this interval. Thus, Xij transformation was conducted to ensure the depreciation of phenotypic values outside the interval. The Yij values obtained by the transformation were eventually standardized and weighed by th weights attributed to each trait, which provided Yij values according to the following
specifications: where: S(Yj) = standard
deviation of the mean phenotypic values and the economic weight of traits. The calculation also demanded the standardization and weighing of VOj, as specified by. The values of the genotype-ideotype distance
index, expressed by the distances between genotypes and the ideotype, were calculated as follows: .
Smith (1936) and Hazel (1943) classic index is the linear combination of several traits of economic
importance, where the weighting coefficients are estimated
so as to maximize the correlation between the index and the genotypic aggregate. The aggregate consisted of another linear combination, including the genetic values, which are weighed by the respective weighting
coefficients, estimated by the expression:
H= a1g1+a2g2+...angn = ∑n
i=0 aigi=g’a and I=b1y1 + b2y2 +
...bnyn = ∑n
i=0 b1y1 = y’b, where: H = genotypic aggregate
or linear combination of unknown genotypic values; I = selection index to be estimated; n = number of traits in the index; g’= vector (1 x n) of unknown genetic values of n traits considered; y’ = vector (1 x n) of the means; a = vector (n x 1) of economic weights (or values) previously established by passion fruit growers; and b = vector (n x
1) of the weighting coefficient of the index. Let it be: P =
matrix (n x n) of phenotypic variances and covariances; and G = matrix (n x n) of genetic covariances obtained at the level of mean families. Thus, vector b was estimated by: The expected gain in trait i when the selection was
performed on the index was expressed by: ∆g j (I) d = DS j (I)h2 j.
m
For the index based on the desired gains (PESEK and BAKER, 1969), the economic weights were replaced by the desired gains for the trait. The construction of the index involved knowledge on the expression of the expected gain of various traits, given by: Δg Gbi/σI
Δg = gain estimated by the index; G = matrix of n x n dimension of genetic variances and covariances among traits; b = vector of 1 x n dimension of the weighting
coefficients of the selection index to be estimated; i =
selection differential in standard deviation units of the index I; I = standard deviation of index I. By replacing
Δg by Δgd, which was the vector of desired gains, and
estimating b by the expression, b= G-1∆g
dσI/i where: σI/i
does not affect the proportionality of b , it is possible to estimate b simply by using: , where: b = estimate; = Vector of desired gains.
The base index of Williams (1962) was used to estimate an index given by the linear combination of the average phenotypic values of traits, which were directly weighted by their respective economic weight, that is, the following index was used as the selection criterion: H= a1y1+a2y2+...anyn = ∑n
i=0 aiyi=y’ , where: y = average
j-th trait for certain individual or family; and a = economic weight attributed by the user to the j-th trait.
The estimates of gains per selection obtained by using selection indexes were based on the selection of 25% of families. The best 30 full-sib families were selected. The analyses of the non-parametric and parametric selection indexes were performed using the Gene software system (CRUZ, 2013).
The coincidence index was carried out for the 30 FIC selected by selection indexes. The Hamblin and Zimmermann (1986) method was used to estimate the coincidence index, by the expression:
, where: A = is the number of FIC that coincides in two selection indexes; B = is the number of selected FIC, in this case, 30; and C = number of coincidences attributed to randomness; in this case, 10% of B was adopted.
Results and Discussion
The evaluation of PA (random weight), h2
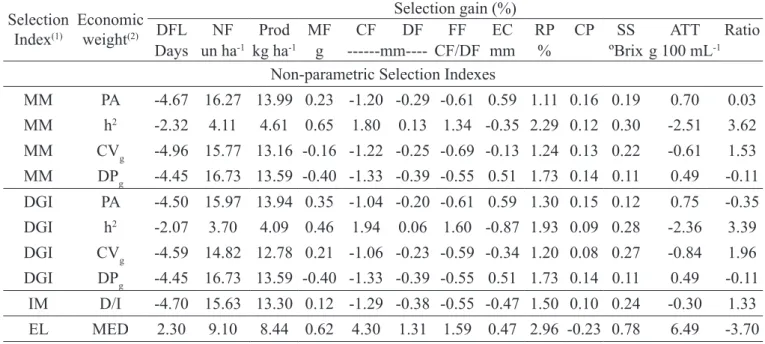
(heritability), CVg (genetic variation coefficient) and DPg (genetic standard deviation) economic weights for the non-parametric selection indexes sum of ranks of Mulamba and Mock (MM) and genotype-ideotype distance index (DGI) showed that PA and DPg provided higher and balanced gains for both selection indexes (Table 1). It was observed that PA provided gains of 16.27 and 13.99% for NF and Prod traits, respectively, in the Mulamba and Mock index. On the other hand, PA obtained gains of 15.97 and 13.94% for NF and Prod, respectively, in the genotype-ideotype distance index. It means that there was little variation in gains among indexes, given the same weight.
Oliveira et al. (2008) observed the highest gains in sour passion fruit in the DGI index for fruit weight, pulp
yield, fruit length, fruit width, fruit shape and number of fruit per plant traits when random weights of 2, 1, 1, 1, 1, 2, respectively, were assigned. Neves et al. (2011) adopted the genetic standard deviation, female genetic variation
coefficient, ratio between female genetic variation and experimental variation coefficient for the MM index
values as economic weights. However, the weights randomly obtained by attempts provided the satisfactory total gains.
Economic weights h2, CV
g and DPg presented the
highest gain for NF trait, 16.73%. Prod trait obtained gain of 13.97% using PA (Table 1), when the parametric Williams selection index (WI) was used. However, it was also observed that, for WI index, gains were similar to main traits, NF and Prod, considering the different economic weights. With the use of PA, in addition to considerable gains for NF (16.60%) and Prod (13.97%) traits, MF trait stood out for its stability in relation to the other economic weights, which obtained negative gains.
Economic weights PA, h2, CV
g and DPg attributed
to the parametric selection index of Smith and Hazel (SH) showed similar gains. It must be highlighted that, for h2 and CV
g, the gains obtained in traits assessed were
the same (Table 1). Regarding EC trait, where selection is performed for reduction purposes, when all economic weights were used in the SH index, gains were negative, since it is a desirable gain for sour passion fruit growing for providing higher pulp yield.
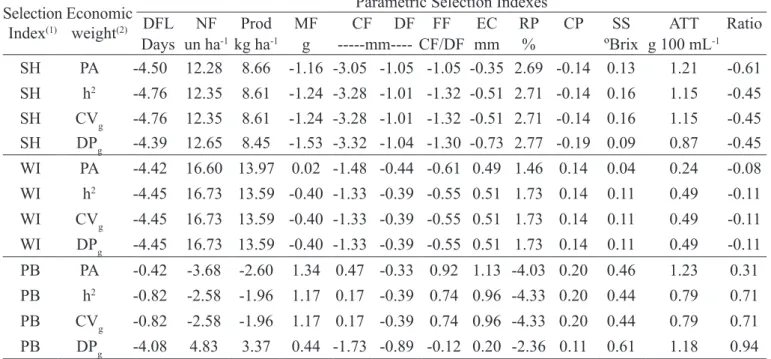
In the attribution of all economic weights in the parametric selection index of Pesek and Baker (PB), gains were negative for NF and Prod traits, except when DPg was used with genetic gains for NF (4.83%) and Prod (3.37%). In addition, for DPg, traits presenting predicted genetic gains favorable to sour passion fruit growing did not reach desired levels. Similar gains were also observed when h2
and CVg values were used as economic weights. Therefore, the use of this index in association with economic weights did not provide desirable gains for the traits studied.
Silva and Viana (2012) used the PB ratio in passion fruit, and CVg, h2, in addition to the random weight (1, 200,
200, 200, 1, 1, 1, 200, 1000, 1000, 1000) were attributed as
economic weights for number of days for flowering, fruit
weight, fruit length, fruit width, shell thickness, content of total soluble solids, pulp color, pulp weight, total number of fruits, total production, average fruit weight traits, respectively. These authors also observed negative genetic gains in almost all traits. Oliveira et al. (2008) obtained gains only for pulp yield trait for sour passion fruit, when the PB selection index was used, considering the genotypic standard deviation as economic weight. The results found by these authors corroborate those obtained in the present work.
Thus, it was observed that the economic weights applied in this work provided different gains in each selection index, which may contribute to increase selection gain. It demonstrates the need for using the appropriate economic weight in association with selection indexes.
^
^
^ ^
The MM, DGI, IM and EL non-parametric selection indexes showed positive gains, mainly for MM and DGI, which met the objectives of this work and reached gains of 16.27% and 16.73% for NF trait, and 13.94% and 13.99% for Prod, respectively (Table 1). The IM and EL indexes
show little flexibility because they do not use economic
weights. However, they showed positive gains for the main traits; (15.63%) and (9.10%) for NF; and (13.30%) and (8.44%) for Prod, respectively (Table 1).
For SH, WI and PB parametric selection indexes, different results were achieved in gains. WI achieved the highest gain for NF and Prod traits, 16.73% and 13.97%, respectively. The SH index showed median positive gains, 12.65% for NF and 8.66% for Prod. The PB index
obtained negative or little significant gains in the main
traits of interest.
The selection indexes used showed different principles for obtaining gains. Thus, the non-parametric selection indexes sum of ranks of Mulamba and Mock and genotype-ideotype distance and the parametric selection index of Williams showed satisfactory gains and were considered viable in the simultaneous improvement of various traits and suitable for the selection of sour passion fruit progenies via recurrent selection.
Gonçalves et al. (2007) selected sour passion fruit progenies and found that the Mulamba and Mock selection index provided better results when compared to the other indexes. Krause et al. (2012) selected superior progenies from the sour passion fruit intrapopulation breeding program and observed positive genetic gains using the
Mulamba and Mock selection index. Silva and Viana (2012) assessed MM and DGI non-parametric indexes and the Smith and Hazel and Pesek and Baker parametric indexes. They found that the predicted percentage gains for the MM selection index showed the best gains for number of fruits, total production and average fruit weight traits, simultaneously. However, Neves et al. (2011) compared different selection indexes to optimize gains from the simultaneous selection of sour passion fruit traits and concluded that the results were satisfactory for the Smith and Hazel, Pesek and Baker and Williams indexes.
Among the 30 FIC selected by the selection indexes, the highest coincidence was observed among (MM DPg x DGI DPg, WI h2, WI CV
g andWI DPg), (DGI
DPg, WI h2, WI CV
g and WI DPg), (SH h
2 x SH CV g) and
(PB h2 x PB Cv
g) indexes, which account for 100% (Table
2). However, the lowest coincidence in the reported indexes was 0% (MM DPg x PB PA) and (WI h2, WI CV
g
and WI DPg x PB PA) (Table 2).
The Elston index was not submitted to assessment in the coincidence index because the methodology selected only three FIC. The same was observed by Rosado et al. (2012) while selecting 20% of sour passion fruit progenies. The difference in the number of families selected is explained by the fact that the Elston index is multiplicative, and assigns zero to the highest or lowest multiplicative index from the cutoff point according to the selection orientation (ROSADO et al., 2012). According to Pedrozo et al. (2009), the higher the coincidence index between two indexes, the higher the agreement of the
Table 1.Estimates of percentage gains via non-parametric and parametric selection indexes of days for flowering
(DFL), number of fruits (NF), productivity (Prod), fruit mass (MF), fruit length (CF) fruit diameter (DF), fruit shape (FF), shell thickness (EC), pulp yield (RP), pulp color (CP), soluble solids (SS), total titratable acidity (TTA) and ratio traits of 118 full-sib sour passion fruit families. Tangará da Serra -MT, 2015
Selection Index(1)
Economic weight(2)
Selection gain (%)
DFL NF Prod MF CF DF FF EC RP CP SS ATT Ratio Days un ha-1 kg ha-1 g ---mm---- CF/DF mm % ºBrix g 100 mL-1
Non-parametric Selection Indexes
MM PA -4.67 16.27 13.99 0.23 -1.20 -0.29 -0.61 0.59 1.11 0.16 0.19 0.70 0.03 MM h2 -2.32 4.11 4.61 0.65 1.80 0.13 1.34 -0.35 2.29 0.12 0.30 -2.51 3.62
MM CVg -4.96 15.77 13.16 -0.16 -1.22 -0.25 -0.69 -0.13 1.24 0.13 0.22 -0.61 1.53 MM DPg -4.45 16.73 13.59 -0.40 -1.33 -0.39 -0.55 0.51 1.73 0.14 0.11 0.49 -0.11 DGI PA -4.50 15.97 13.94 0.35 -1.04 -0.20 -0.61 0.59 1.30 0.15 0.12 0.75 -0.35 DGI h2 -2.07 3.70 4.09 0.46 1.94 0.06 1.60 -0.87 1.93 0.09 0.28 -2.36 3.39
DGI CVg -4.59 14.82 12.78 0.21 -1.06 -0.23 -0.59 -0.34 1.20 0.08 0.27 -0.84 1.96 DGI DPg -4.45 16.73 13.59 -0.40 -1.33 -0.39 -0.55 0.51 1.73 0.14 0.11 0.49 -0.11
IM D/I -4.70 15.63 13.30 0.12 -1.29 -0.38 -0.55 -0.47 1.50 0.10 0.24 -0.30 1.33 EL MED 2.30 9.10 8.44 0.62 4.30 1.31 1.59 0.47 2.96 -0.23 0.78 6.49 -3.70
selection results between them.
Continuation Table 1…
Selection Index(1)
Economic weight(2)
Parametric Selection Indexes
DFL NF Prod MF CF DF FF EC RP CP SS ATT Ratio Days un ha-1kg ha-1 g ---mm---- CF/DF mm % ºBrix g 100 mL-1
SH PA -4.50 12.28 8.66 -1.16 -3.05 -1.05 -1.05 -0.35 2.69 -0.14 0.13 1.21 -0.61 SH h2 -4.76 12.35 8.61 -1.24 -3.28 -1.01 -1.32 -0.51 2.71 -0.14 0.16 1.15 -0.45
SH CVg -4.76 12.35 8.61 -1.24 -3.28 -1.01 -1.32 -0.51 2.71 -0.14 0.16 1.15 -0.45 SH DPg -4.39 12.65 8.45 -1.53 -3.32 -1.04 -1.30 -0.73 2.77 -0.19 0.09 0.87 -0.45 WI PA -4.42 16.60 13.97 0.02 -1.48 -0.44 -0.61 0.49 1.46 0.14 0.04 0.24 -0.08 WI h2 -4.45 16.73 13.59 -0.40 -1.33 -0.39 -0.55 0.51 1.73 0.14 0.11 0.49 -0.11
WI CVg -4.45 16.73 13.59 -0.40 -1.33 -0.39 -0.55 0.51 1.73 0.14 0.11 0.49 -0.11 WI DPg -4.45 16.73 13.59 -0.40 -1.33 -0.39 -0.55 0.51 1.73 0.14 0.11 0.49 -0.11 PB PA -0.42 -3.68 -2.60 1.34 0.47 -0.33 0.92 1.13 -4.03 0.20 0.46 1.23 0.31 PB h2 -0.82 -2.58 -1.96 1.17 0.17 -0.39 0.74 0.96 -4.33 0.20 0.44 0.79 0.71
PB CVg -0.82 -2.58 -1.96 1.17 0.17 -0.39 0.74 0.96 -4.33 0.20 0.44 0.79 0.71 PB DPg -4.08 4.83 3.37 0.44 -1.73 -0.89 -0.12 0.20 -2.36 0.11 0.61 1.18 0.94
(1)Mulamba and Mock (MM); Genotype-ideotype distance (DGI); Multiplicative (IM); Elston (EL); Smith and Hazel (SH); Williams (WI); Pesek and Baker (PB). (2) Random weights attributed by trials (PA) (1, 20, 100, 10, 1, 1, 1, 1, 1, 1, 1, 1, 1); heritability (h2); genetic variation coefficient (CVg); genetic standard deviation (DPg); direct or inverse (D/I); averages (MED).
Table 2. Coincidence Index of 30 full-sib sour passion fruit families selected by non-parametric and parametric selection indexes. Tangará da Serra-MT, 2015.
IS(1) MM
h2
MM CVg
MM DPg
DGI PA
DGI h2
DGI CVg
DGI DPg IM
SH PA
SH h2
SH CVg
SH DPg
WI PA
WI h2
WI CVg
WI DPg
PB PA
PB h2
PB CVg
PB DPg MM PA 37.0 81.9 85. 96.3 29.6 81.9 88.9 85.2 44.4 40.7 40.7 37.0 92.6 85.2 85.2 85.2 3.7 3.7 3.7 22.2 MM h2 - 48.2 29.6 37.0 92.6 51.9 33.3 48.2 11.1 14.8 14.8 7.4 33.3 25.9 25.9 25.9 7.4 11.1 11.1 18.5
MM CVg - - 74.1 88.9 44.4 92.6 81.5 92.6 44.4 40.7 40.7 37.0 81.5 81.5 81.5 81.5 37.0 7.4 7.4 22.2 MM DPg - - - 92.6 33.3 70.4 100 77.8 51.9 55.6 55.6 51.9 92.6 100 100 100 0 37.0 37.0 22.2 DGI PA - - - - 33.3 81.5 88.9 85.2 40.7 44.4 44.4 40.7 92.6 88.9 88.9 88.9 37.0 37.0 37.0 18.5 DGI h2 - - - - - 48.2 29.6 40.7 11.1 14.8 14.8 11.1 22.2 25.9 25.9 25.9 18.5 14.8 14.8 22.2
DGI CVg - - - 70.4 92.6 40.7 40.7 40.7 37.0 77.8 74.1 74.1 74.1 7.4 11.1 11.1 29.6 DGI DPg - - - 77.8 48.1 55.5 55.5 51.9 92.6 100 100 100 37.0 37.0 37.0 22.2 IM - - - 48.1 48.1 48.1 40.7 77.8 77.8 77.8 77.8 7.4 11.1 11.1 25.9 SH PA - - - 96.3 96.3 88.9 40.7 55.6 55.6 55.6 7.4 14.8 14.8 33.3 SH h2 - - - - - - - - - - 100 92.6 48.2 51.9 51.9 51.9 11.1 11.1 11.1 33.3
SH CVg - - - 92.6 48.2 55.6 55.6 55.6 11.1 11.1 11.1 37.0 SH DPg - - - 40.7 51.9 51.9 51.9 7.4 7.4 7.4 33.3 WI PA - - - 92.6 92.6 92.6 3.7 3.7 3.7 22.2 WI h2 - - - - - - - - - - - - - - 100 100 0 3.7 3.7 22.2
WI CVg - - - 100 0 3.7 3.7 22.2 WI DPg - - - 0 3.7 3.7 22.2 PB PA - - - 96.3 96.3 77.8 PB h2 - - - - - - - - - - - - - - - - - - 100 77.8
PB CVg - - - 77.8
(1)Selection Index (IS): Mulamba; Mock (MM); Genotype-ideotype distance (DGI); Multiplicative (IM); Smith; Hazel (SH); Williams (WI); Pesek and Baker (PB); random weight (PA); heritability (h2); genetic variation coefficient (CV
Conclusions
The non-parametric selection indices of Mulamba and Mock, genotype-ideotype distance and the parametric selection index of Williams showed satisfactory and balanced genetic gains.
The highest genetic gains were observed when the
genetic variation coefficient, genetic standard deviation
and random weight were attributed as economic weight for non-parametric selection indexes. For the parametric indexes, gains were similar, regardless of assigned weight, except for the Pesek and Baker index, in which the genetic standard deviation provided the highest gain.
Acknowledgements
FAPEMAT for the financial support provided to
the research project and CAPES / FAPEMAT for the scholarship granted.
References
ABREU, S. de P.M.; PEIXOTO, J. R.; JUNQUEIRA, N.T.V.; SOUSA, M.A. de F. Características físico-químicas de cinco genótipos de maracujazeiro-azedo cultivados no Distrito Federal. Revista Brasileira Fruticultura, Jaboticabal, v.31, n.2, p.487-491, 2009. (1)
ASSUNÇÃO, M.; KRAUSE, W.; DALLACORT, R.; SANTOS, P.R.J. dos; NEVES, L.G.Seleção individual de plantas de maracujazeiro azedo quanto à qualidade de frutos via REML/BLUP. Revista Caatinga, Mossoró, v.28, n.2, p.57-63, 2015. (1)
CAVALCANTE, N.R. Seleção precoce e avaliação de genótipos melhorados de maracujazeiro azedo. 2015. 88f. Dissertação (Mestrado em genética e melhoramento de plantas) - Centro de Pesquisa, Estudos e Desenvolvimento Agro-Ambiental, Universidade do Estado de Mato Grosso, Tangará da Serra, 2015. (4)
CRUZ, C.D. Genes – a software package for analysis in experimental statistics and quantitative genetics. Acta Scientiarum Agronomy, Maringá, v.35, n.3, p.271-276, 2013. (1)
CRUZ, C.D. Programa genes – biometria. Viçosa: UFV, 2006. 668p. (2)
CRUZ, C.D.; CARNEIRO, P.C.S.; REGAZZI, A.J.
Modelos biométricos aplicados ao melhoramento genético. Viçosa: UFV, 2014. 668p. (2)
CRUZ, C.D.; REGAZZI, A.J.; CARNEIRO, P.C.S.
Modelos biométricos aplicados ao melhoramento genético. Viçosa: UFV, 2012. 514p. (2)
ELSTON, R.C. A weight-free index for the purpose of ranking or selection with respect to several traits at a time.
Biometrics, Alexandria, v.19, n.1, p.85-97, 1963. (1)
EMBRAPA. Sistema brasileiro de classificação de solos. Rio de Janeiro: Embrapa Solos, 2006. 306p. (2)
FERREIRA, F.M.; NEVES, L.G.; BRUCKNER, C.H.; VIANA, A.P.; CRUZ, C.D.; BARELLI, M.A.A. Formação de supercaracteres para seleção de famílias de maracujazeiro amarelo. Acta Scientiarum Agronomy, Maringá, n.32, v.2, p. 247-254, 2010. (1)
FREITAS, J.P.X. de; OLIVEIRA, E.J. de; JESUS, O.N. de; NETO, A.J. da C.; SANTOS, L.R. dos. Formação de população base para seleção recorrente em maracujazeiro-amarelo com uso de índices de seleção.
Pesquisa Agropecuária Brasileira, Brasília, DF, v.47, n. 3, p.393-401, 2012. (1)
GONÇALVES, G.M.; PIO VIANA, A.; BEZERRA NETO, F.V.; PEREIRA, M.G.; PEREIRA, T.N.S. Seleção e herdabilidade na predição de ganhos genéticos em maracujá-azedo. Pesquisa Agropecuária Brasileira, Brasília, DF, v.42, n.2, p.193-198, 2007. (1)
GRECO, S.M.L.; PEIXOTO, J.R.; FERREIRA, L.M. Avaliação física, físico-química e estimativas de parâmetros genéticos de 32 genótipos de maracujazeiro azedo cultivados no Distrito Federal. Bioscience Journal,
Uberlândia, v.30, n.3, p.360-370, 2014. (1)
HAMBLIN, J.; ZIMMERMAN, M.J.O. Breeding common bean for yield mixtures. Plant Breeding Reviews, New York, v.4, p.245-272, 1986. (1)
HAZEL, H.N. The genetic basis for constructing selection indexes. Genetics, Menasha, v.28, n.6, p.476-490, 1943.
(1)
KRAUSE, W.; NEVES, L.G.; VIANA, A.P.; ARAÚJO, C.A.T.; FALEIRO, F.G. Produtividade e qualidade de frutos de cultivares de maracujazeiro-amarelo com ou sem
polinização artificial. Pesquisa Agropecuária Brasileira, Brasília, DF, v.47, n.12, p.1737-1742, 2012. (1)
MARTINS, J.A.; DALLACORT, R.; INOUE, M.H.; SANTI, A.; KOLLING, E.M.; COLETTI, A.J. Probabilidade de precipitação para a microrregião de Tangará da Serra, Estado do Mato Grosso. Pesquisa Agropecuária Tropical, Goiânia, v.40, n.3, p.291-296, 2010. (1)
MEDEIROS, S.A.F. de; YAMANISHI, O.K.; PEIXOTO, J.R.; PIRES, M.C.; JUNQUEIRAS, N.T.; RIBEIRO, J.G.B.L. Caracterização físico-química de progênies de maracujá-roxo e maracujá-azedo cultivados no Distrito Federal. Revista Brasileira Fruticultura, Jaboticabal, v.31, n.2, p.492-499, 2009. (1)
MULAMBA, N.N.; MOCK, J.J. Improvement of yield potential of the Eto Blanco maize (Zea mays L.) popula-tion by breeding for plant traits. Egypitian Journal of Genetics and Cytology, Alexandria, v.7, p.40-51, 1978.
(1)
NEVES, L.G.; BRUCKNER, C.H.; CRUZ, C.D.; VIANA, A.P.; BARELLI, M.A.A. Predição de ganhos, com diferentes índices de seleção, para características de frutos do maracujazeiro-amarelo. Revista Brasileira de Fruticultura, Jaboticabal, v.33, n.4, p.1322-1330, 2011. (1)
OLIVEIRA, E.J.; SANTOS, V.S.; LIMA, D.S.; MACHADO, M.D.; LUCENA, R.S.; MOTTA, T.B.N.; CASTELLEN, M.S. Seleção em progênies de maracujazeiro-amarelo com base em índices multivariados.
Pesquisa Agropecuária Brasileira, Brasília, DF, v. 43, n.11, p.1543-1549, 2008. (1)
PEDROZO, C.A.; BENITES, F.R.G.; BARBOSA,
M.H.P.; RESENDE, M.D.V.; SILVA, F.L. Eficiência de
índices de seleção utilizando a metodologia REML/BLUP no melhoramento da cana-de-açúcar. Scientia Agrária, Curitiba, v.10, n.1, p.31-36, 2009.
PESEK, J.; BAKER, R.J. Desired improvement in relation to selected indices. Canadian Journal of Plant. Science, Ottawa, v.49, n.1, p.803-804, 1969. (1)
ROSADO.L.D.S.; SANTOS, C.E.M.dos; BRUCKNER, C.H.; NUNES, E.S.; CRUZ, C.D. Simultaneous selection in progenies of yellow passion fruit using selection indices. Revista Ceres, Viçosa, MG, v.59, n.1, p.95-101, 2012. (1)
SILVA, M.G. de M.; VIANA, A.P. Alternativas de seleção em população de maracujazeiro-azedo sob seleção recorrente intrapopulacional. Revista Brasileira de Fruticultura, Jaboticabal, v.34, n.2, p.525-531, 2012. (1)
SMITH, H.F. A discriminant function for plant selection. Annals of Eugenics, London, v.7, p.240-250, 1936. (1)
SUBANDI, W.; COMPTON, A.; EMPIG, L.T. Comparison
of the efficiencies of selection indices for three traits in
two variety crosses of corn. Crop Science, Madison, v.13, n.1, p.184-186, 1973. (1)
WILLIAMS, J. S. The evaluation of a selection index.