Associations of maternal obesity and excessive weight gain during
pregnancy with subcutaneous fat mass in infancy
Varsha V. Jharap
a,b,c, Susana Santos
a,d, Eric A.P. Steegers
e, Vincent W.V. Jaddoe
a,b,c, Romy Gaillard
a,b,c,⁎
a
The Generation R Study Group, Erasmus MC, University Medical Center, Rotterdam, The Netherlands
bDepartment of Epidemiology, Erasmus MC, University Medical Center, Rotterdam, The Netherlands c
Department of Pediatrics, Erasmus MC, University Medical Center, Rotterdam, The Netherlands
d
EPI-Unit, Institute of Public Health, University of Porto, Porto, Portugal
e
Department of Obstetrics and Gynecology, Erasmus MC, University Medical Center, Rotterdam, The Netherlands
a b s t r a c t
a r t i c l e i n f o
Article history:
Received 8 December 2016
Received in revised form 10 March 2017 Accepted 14 March 2017
Background: Not much is known about the associations of maternal obesity and excessive gestational weight gain with body fat in infancy.
Objective: To examine the associations of maternal pre-pregnancy body mass index and gestational weight gain with infant subcutaneous fat.
Methods: In a population-based prospective cohort study among 845 mothers and their infants, we obtained ma-ternal pre-pregnancy body mass index and measured mama-ternal weight during pregnancy. At 1.5, 6 and 24 months, we estimated infant total subcutaneous fat (sum of biceps, triceps, suprailiacal and subscapular skinfold thicknesses) and central-to-total subcutaneous fat ratio (sum of suprailiacal and subscapular skinfold thicknesses/total subcutaneous fat).
Results: Maternal body mass index was positively associated with higher infant body mass index from 6 months onwards. Maternal body mass index was not associated with infant subcutaneous fat measures at 1.5 or 6 months. A 1-standard deviation scores (SDS) higher maternal body mass index was associated with a 0.09 (95% Confi-dence Interval 0.01, 0.17) SDS higher infant total subcutaneous fat at 24 months, but not with central-to-total subcutaneous fat ratio. No associations were present for maternal total or period-specific gestational weight gain with infant fat.
Conclusion: Maternal body mass index was positively associated with infant body mass index and total subcuta-neous fat in late infancy. Maternal total and period-specific gestational weight gain were not associated with infant body fat mass measures.
© 2017 Elsevier B.V. All rights reserved.
Keywords: Obesity Weight gain Infancy Subcutaneous fat Skinfolds 1. Introduction
Maternal pre-pregnancy obesity and excessive weight gain during pregnancy are associated with an increased risk of obesity in childhood
[1,2]. Body mass index is a suboptimal measure of body fat mass and provides no information about body fat distribution[3]. Several studies have shown that compared to body mass index, central fat distribution is more strongly associated with an adverse cardiovascular risk profile
[4]. Previously, we reported that maternal obesity and excessive weight gain especially in early-pregnancy seem to be associated with an ad-verse body fat distribution, such as higher android-to-gynoid fat mass ratio, at 6 years[5,6]. We have also shown that maternal pre-pregnancy
body mass index tended to be more strongly associated with childhood total and abdominal fat than paternal body mass index, suggesting that intra-uterine mechanisms might be involved[6]. Thus far, previous studies did not assess the associations and explore the underlying mechanisms of maternal obesity and excessive weight gain during pregnancy with detailed offspring fat mass measures already from early infancy onwards, which is a well-known critical period for adipos-ity development in later life[7]. Skinfold thickness is a valid measure-ment of total and regional subcutaneous fat mass in infancy[8]. We have previously shown that subcutaneous fat mass measured by skinfolds tends to track throughout infancy and is positively associated with cholesterol levels at school-age children[9,10].
Therefore, we examined in a population-based prospective cohort study among 845 parents and their infants, the associations of maternal pre-pregnancy body mass index and weight gain in different periods of pregnancy with subcutaneous fat mass measures throughout infancy.
⁎ Corresponding author at: The Generation R Study Group (Na29-15), Erasmus MC, University Medical Center, PO Box 2040, 3000 CA Rotterdam, The Netherlands.
E-mail address:[email protected](R. Gaillard).
http://dx.doi.org/10.1016/j.earlhumdev.2017.03.006
0378-3782/© 2017 Elsevier B.V. All rights reserved.
Contents lists available atScienceDirect
Early Human Development
We also compared the strength of the associations of maternal and pa-ternal body mass index with infant fat mass measures to obtain further insight in the underlying mechanisms.
2. Methods 2.1. Study design
This study was embedded in the Generation R Study, a population-based prospective cohort study from early pregnancy onwards among 9778 mothers and their children living in Rotterdam, the Netherlands
[11]. The local Medical Ethical Committee approved the study. Written informed consent was obtained from parents. Additional detailed as-sessments of growth and development were conducted in a subgroup of Dutch mothers and their children from late pregnancy onwards. Of all approached women, 80% agreed to participate. From the total of 1205 mothers and their singleton children participating in the subgroup study, 1033 mothers had information about pre-pregnancy body mass index. Missing information about pre-pregnancy body mass index was mainly because of later enrolment in the study and nonparticipation in thefirst questionnaire. Body mass index or skinfold thicknesses mea-sured at the age of 1.5, 6 or 24 months were available in 845 children (Flow chart is given in Supplemental Fig. S1). Missing body fat mass measurements during infancy were due to loss to follow-up or crying behavior.
2.2. Parental anthropometrics
As previously described, maternal pre-pregnancy weight was ob-tained by questionnaire at enrolment[11]. Maternal height (cm) and paternal height (cm) and weight (kg) were measured without shoes and heavy clothing at enrolment. Body mass index (kg/m2) was calcu-lated. Maternal and paternal body mass index were categorized into 4
categories (underweight (b20 kg/m2), normal weight (20–
24.9 kg/m2), overweight (25–29.9 kg/m2
), and obese (≥30 kg/m2 )). We measured maternal weight without shoes and heavy clothing at median 12.8 (95% range 9.9,17.0), 20.4 (95% range 18.6,22.7) and 30.4 (95% range 28.5,32.5) weeks of gestation. In a subgroup of 509 mothers, information about maximum weight during pregnancy was assessed by questionnaire 2 months after delivery. Based on the timing of maternal weight measurements within our study cohort, we defined early-, mid-and late-pregnancy weight, using self-reported mid-and measured maternal weight data, as: at 13 weeks of gestation (median 12.8, 95% range 9.9,18.9); at 26 weeks of gestation (median 29.9, 95% range 20.4,31.6); and at 40 weeks of gestation (median 39.0, 95% range 32.6,42.0), respectively. Using this method, information about early-, mid- and late-pregnancy weight was available for 762, 824 and 493 mothers, respectively. Among the subgroup of mothers with maximum weight during pregnancy available, we defined excessive gestational weight gain in relation to maternal pre-pregnancy body mass index ac-cording to the Institute of Medicine (IOM) guidelines[12].
2.3. Body fat measurements during infancy
We measured weight to the nearest gram in naked infants at the age of 1.5 and 6 months by using an electronic infant scale and at 24 months by using a mechanical personal scale (SECA, Almere, The Netherlands). Body length at the age of 1.5 and 6 months was measured in supine po-sition to the nearest millimeter by using a neonatometer and body height at 24 months was measured in standing position by using a Harpenden stadiometer (Holtain Limited, Dyfed, UK). Body mass index (kg/m2) was calculated. We measured skinfold thicknesses at the ages of 1.5, 6 and 24 months on the left side of the body at the biceps, triceps, suprailiacal and subscapular area by using a skinfold caliper (Slim Guide, Creative Health Products)[9]. We calculated total subcuta-neous fat mass from the sum of all four skinfold thicknesses, and central
subcutaneous fat mass from the sum of suprailiacal and subscapular skinfold thicknesses[13]. Measurements of body fat quantity and distri-bution require appropriate adjustment for body size or total fat mass, respectively, in order to undertake informative comparisons between children and within children over time. To create total subcutaneous fat mass independent of length or height and central subcutaneous fat mass independent of total subcutaneous fat mass, we estimated the op-timal adjustment by log-log regression analyses[14]. Based on these analyses, total subcutaneous fat mass was only weakly correlated with length at 1.5 and 6 months or height at 24 months, and was not adjusted for it. A central-to-total subcutaneous fat mass ratio was calculated as central divided by total subcutaneous fat mass.
2.4. Covariates
Information on maternal and paternal age, educational level and parity was obtained at enrolment[11]. Information on maternal smoking was assessed by questionnaires during pregnancy. First tri-mester maternal nutritional information was obtained by food frequen-cy questionnaire. Information about pregnanfrequen-cy complications, mode of delivery, child's sex, gestational age and weight at birth was obtained from medical records[15]. Information about breast feeding duration and timing of introduction of solid foods was obtained by question-naires in infancy.
2.5. Statistical analysis
First, we examined differences in subject characteristics between maternal body mass index categories with 1-way ANOVA tests andχ2 tests. Next, we examined the associations of maternal and paternal body mass index with infant subcutaneous fat mass measures at each time period using linear regression models. We also used repeated mea-surement regression models to assess the associations of parental pre-pregnancy overweight with the repeatedly measured infant fat mass measures. These models take the correlation between repeated mea-surements of the same subject into account, and allow for incomplete outcome data. Third, we examined the associations of maternal maxi-mum gestational weight gain and excessive gestational weight gain ac-cording to the IOM criteria with infant subcutaneous fat mass measures using linear regression models. Since maternal weight measurements throughout pregnancy are strongly correlated, we performed condition-al linear regression ancondition-alyses to assess the independent associations of maternal pre-pregnancy weight and early-, mid- and late-pregnancy weight gain with infant subcutaneous fat mass measures. We obtained standardized residuals for each weight measurement from the regres-sion of maternal weight at a specific time point on prior maternal weight measurements. These weight variables are statistically indepen-dent from each other, and can be simultaneously included in the regres-sion models[16].
Models were adjusted for maternal and childhood socio-demo-graphic and lifestyle-related characteristics. Covariates were included based on associations with the exposures and outcomes of interest in previous studies, or a change in effect estimatesN 10%. We constructed SDS ((observed value− mean) / SD) for parental body mass index and gestational weight gain and infant fat mass measures to enable compar-ison of effect estimates. Since no significant interactions between paren-tal body mass index or maternal gestational weight gain and child's sex in the associations with infant subcutaneous fat mass measures were present, no further stratified analyses were performed. Missing values in covariates were multiple-imputed, by using Markov chain Monte Carlo approach. Five imputed datasets were created and analyzed to-gether. All statistical analyses were performed using the Statistical Pack-age of Social Sciences version 21.0 for Windows (SPSS Inc., Chicago, IL, USA).
3. Results
3.1. Subject characteristics
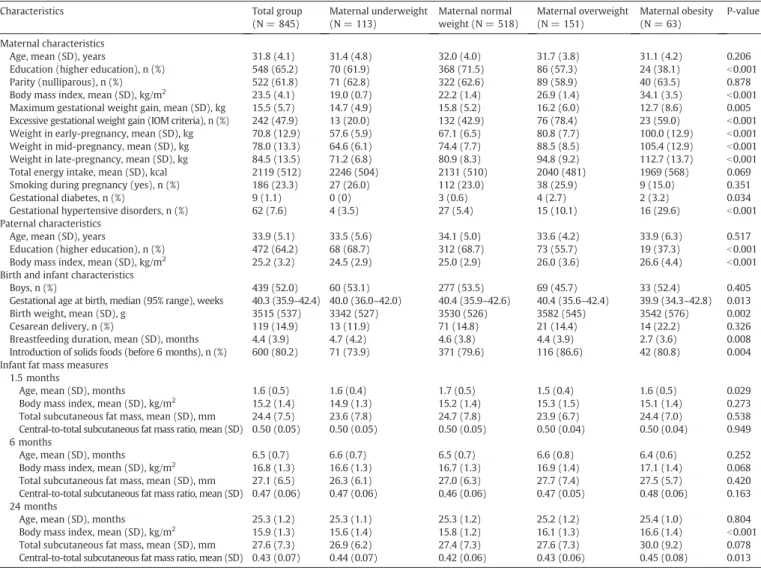
Characteristics of included mothers, fathers and their children are given inTable 1. Non-response analyses showed that as compared to mothers who did not participate in the follow-up studies, those who did participate were slightly older, had a higher educational level and their children were breastfed for a longer period (pb 0.05), but no dif-ferences were observed regarding maternal and paternal body mass index and maternal weight gain during pregnancy (Supplemental Table S1).
3.2. Parental body mass index and infant body fat
Table 2shows the associations of maternal and paternal body mass index with infant subcutaneous fat mass measures. We observed no as-sociations of maternal pre-pregnancy body mass index with infant body fat mass measures at 1.5 months. A higher maternal pre-pregnancy body mass index was associated with higher infant body mass index from 6 months onwards (difference at 6 and 24 months: 0.09 (95% Con-fidence Interval (CI) 0.01,0.17) SDS, 0.17 (95% CI 0.09,0.26) SDS per 1-SDS higher maternal body mass index, respectively). A higher maternal pre-pregnancy body mass index was also associated with higher infant
total subcutaneous fat mass at 24 months (difference: 0.09 (95% CI 0.01, 0.17) SDS per 1-SDS higher maternal body mass index), but not with in-fant central-to-total subcutaneous fat mass ratio. A higher paternal body mass index was only associated with higher infant body mass index at 1.5 and 24 months (p-valuesb 0.05). Including both maternal and pa-ternal body mass index in the same model did not change the effect es-timates for infant fat mass measures at 1.5, 6 and 24 months.
Supplemental Fig. S2 shows that maternal pre-pregnancy over-weight was associated with higher infant body mass index growth from 6 months onwards, resulting in higher body mass index at 24 months (all p-valuesb 0.05). Maternal pre-pregnancy overweight also tended to be associated with higher total subcutaneous fat mass and central-to-total subcutaneous fat mass ratio at 24 months (differ-ence: 0.09 (95% CI 0.01,0.17) SDS, 0.08 (95% CI−0.01,0.17) SDS for ma-ternal pregnancy overweight as compared to mama-ternal pre-pregnancy normal weight, respectively). No associations of paternal overweight with infant body fat mass measures were present. 3.3. Maternal gestational weight gain and infant body fat
Table 3shows no consistent associations for maternal maximum and excessive gestational weight gain with infant body mass index and sub-cutaneous fat mass measures at 1.5, 6 and 24 months. Excessive mater-nal gestatiomater-nal weight gain was only associated with higher infant body
Table 1
Characteristics of mothers, fathers and their children.a
Characteristics Total group
(N = 845) Maternal underweight (N = 113) Maternal normal weight (N = 518) Maternal overweight (N = 151) Maternal obesity (N = 63) P-value Maternal characteristics
Age, mean (SD), years 31.8 (4.1) 31.4 (4.8) 32.0 (4.0) 31.7 (3.8) 31.1 (4.2) 0.206 Education (higher education), n (%) 548 (65.2) 70 (61.9) 368 (71.5) 86 (57.3) 24 (38.1) b0.001 Parity (nulliparous), n (%) 522 (61.8) 71 (62.8) 322 (62.6) 89 (58.9) 40 (63.5) 0.878 Body mass index, mean (SD), kg/m2
23.5 (4.1) 19.0 (0.7) 22.2 (1.4) 26.9 (1.4) 34.1 (3.5) b0.001 Maximum gestational weight gain, mean (SD), kg 15.5 (5.7) 14.7 (4.9) 15.8 (5.2) 16.2 (6.0) 12.7 (8.6) 0.005 Excessive gestational weight gain (IOM criteria), n (%) 242 (47.9) 13 (20.0) 132 (42.9) 76 (78.4) 23 (59.0) b0.001 Weight in early-pregnancy, mean (SD), kg 70.8 (12.9) 57.6 (5.9) 67.1 (6.5) 80.8 (7.7) 100.0 (12.9) b0.001 Weight in mid-pregnancy, mean (SD), kg 78.0 (13.3) 64.6 (6.1) 74.4 (7.7) 88.5 (8.5) 105.4 (12.9) b0.001 Weight in late-pregnancy, mean (SD), kg 84.5 (13.5) 71.2 (6.8) 80.9 (8.3) 94.8 (9.2) 112.7 (13.7) b0.001 Total energy intake, mean (SD), kcal 2119 (512) 2246 (504) 2131 (510) 2040 (481) 1969 (568) 0.069 Smoking during pregnancy (yes), n (%) 186 (23.3) 27 (26.0) 112 (23.0) 38 (25.9) 9 (15.0) 0.351 Gestational diabetes, n (%) 9 (1.1) 0 (0) 3 (0.6) 4 (2.7) 2 (3.2) 0.034 Gestational hypertensive disorders, n (%) 62 (7.6) 4 (3.5) 27 (5.4) 15 (10.1) 16 (29.6) b0.001 Paternal characteristics
Age, mean (SD), years 33.9 (5.1) 33.5 (5.6) 34.1 (5.0) 33.6 (4.2) 33.9 (6.3) 0.517 Education (higher education), n (%) 472 (64.2) 68 (68.7) 312 (68.7) 73 (55.7) 19 (37.3) b0.001 Body mass index, mean (SD), kg/m2
25.2 (3.2) 24.5 (2.9) 25.0 (2.9) 26.0 (3.6) 26.6 (4.4) b0.001 Birth and infant characteristics
Boys, n (%) 439 (52.0) 60 (53.1) 277 (53.5) 69 (45.7) 33 (52.4) 0.405 Gestational age at birth, median (95% range), weeks 40.3 (35.9–42.4) 40.0 (36.0–42.0) 40.4 (35.9–42.6) 40.4 (35.6–42.4) 39.9 (34.3–42.8) 0.013 Birth weight, mean (SD), g 3515 (537) 3342 (527) 3530 (526) 3582 (545) 3542 (576) 0.002 Cesarean delivery, n (%) 119 (14.9) 13 (11.9) 71 (14.8) 21 (14.4) 14 (22.2) 0.326 Breastfeeding duration, mean (SD), months 4.4 (3.9) 4.7 (4.2) 4.6 (3.8) 4.4 (3.9) 2.7 (3.6) 0.008 Introduction of solids foods (before 6 months), n (%) 600 (80.2) 71 (73.9) 371 (79.6) 116 (86.6) 42 (80.8) 0.004 Infant fat mass measures
1.5 months
Age, mean (SD), months 1.6 (0.5) 1.6 (0.4) 1.7 (0.5) 1.5 (0.4) 1.6 (0.5) 0.029 Body mass index, mean (SD), kg/m2 15.2 (1.4) 14.9 (1.3) 15.2 (1.4) 15.3 (1.5) 15.1 (1.4) 0.273
Total subcutaneous fat mass, mean (SD), mm 24.4 (7.5) 23.6 (7.8) 24.7 (7.8) 23.9 (6.7) 24.4 (7.0) 0.538 Central-to-total subcutaneous fat mass ratio, mean (SD) 0.50 (0.05) 0.50 (0.05) 0.50 (0.05) 0.50 (0.04) 0.50 (0.04) 0.949 6 months
Age, mean (SD), months 6.5 (0.7) 6.6 (0.7) 6.5 (0.7) 6.6 (0.8) 6.4 (0.6) 0.252 Body mass index, mean (SD), kg/m2
16.8 (1.3) 16.6 (1.3) 16.7 (1.3) 16.9 (1.4) 17.1 (1.4) 0.068 Total subcutaneous fat mass, mean (SD), mm 27.1 (6.5) 26.3 (6.1) 27.0 (6.3) 27.7 (7.4) 27.5 (5.7) 0.420 Central-to-total subcutaneous fat mass ratio, mean (SD) 0.47 (0.06) 0.47 (0.06) 0.46 (0.06) 0.47 (0.05) 0.48 (0.06) 0.163 24 months
Age, mean (SD), months 25.3 (1.2) 25.3 (1.1) 25.3 (1.2) 25.2 (1.2) 25.4 (1.0) 0.804 Body mass index, mean (SD), kg/m2
15.9 (1.3) 15.6 (1.4) 15.8 (1.2) 16.1 (1.3) 16.6 (1.4) b0.001 Total subcutaneous fat mass, mean (SD), mm 27.6 (7.3) 26.9 (6.2) 27.4 (7.3) 27.6 (7.3) 30.0 (9.2) 0.078 Central-to-total subcutaneous fat mass ratio, mean (SD) 0.43 (0.07) 0.44 (0.07) 0.42 (0.06) 0.43 (0.06) 0.45 (0.08) 0.013
a
Values are observed data and represent means (SD), medians (95% range) or numbers of subjects (valid %). Total subcutaneous fat mass = biceps + triceps + suprailiacal + subscapular skinfold thicknesses. Central-to-total subcutaneous fat mass ratio = (suprailiacal + subscapular skinfold thicknesses) / total subcutaneous fat mass. SD, standard deviation. IOM criteria, Institute of Medicine criteria.
mass index at 6 months (difference: 0.30 (95% CI 0.11,0.48) SDS for ex-cessive maternal weight gain as compared to non-exex-cessive weight gain). No associations were observed for maternal weight gain mea-sured until 30 weeks of gestation with infant body fat mass measures (Supplemental Table S2). In Supplemental Fig. S3, early-pregnancy weight gain was associated with higher total subcutaneous fat mass at 6 months, but not at older ages. No independent associations were ob-served for maternal mid- and late-pregnancy weight gain with infant fat mass measures.
4. Discussion
This study showed that maternal pre-pregnancy body mass index was positively associated with infant body mass index and total subcu-taneous fat mass from 6 months onwards. Maternal total and period-specific gestational weight gain were not associated with infant body fat mass measures.
A higher maternal pre-pregnancy body mass index is associated with higher body mass index from early childhood onwards[1,2]. Also, maternal pre-pregnancy obesity seems to be associated with an adverse offspring body fat pattern, characterized by higher total fat mass and abdominal fat mass levels from the age of 2 years onwards
[17–19]. A study among 325 infants showed that maternal pre-preg-nancy obesity was positively associated with total fat mass already throughout infancy[20]. In the current study, we observed that mater-nal pre-pregnancy body mass index was already associated with a higher infant body mass index and total subcutaneous fat mass from
the age of 6 months onwards. No associations were observed for cen-tral-to-total subcutaneous fat mass ratio at all ages. Thus, maternal obe-sity seems to influence total body fat mass development already from early infancy onwards.
By comparing the strength of associations of maternal and paternal body mass index with offspring fat mass outcomes, further insight into the underlying mechanisms can be obtained. Stronger maternal as-sociations would suggest that intra-uterine programming effects might be part of the underlying mechanisms, whereas similar or stronger pa-ternal associations suggests that genetics and lifestyle-related charac-teristics might explain the observed associations. Previous studies comparing the strength of associations of parental body mass index with infant and childhood body mass index have reported inconsistent associations[21–23]. We have shown, among 4871 parents and their 6-year-old children, that maternal pre-pregnancy body mass index was more strongly associated with childhood total fat mass and android-to-gynoid fat mass ratio, as compared to paternal body mass index[6]. In this current study, we observed more consistent and stronger associ-ations for maternal pre-pregnancy body mass index with infant subcu-taneous fat mass measures from the age of 6 months onwards, as compared to the associations of paternal body mass index with infant outcomes. At 1.5 months, we observed stronger associations for pater-nal body mass index with infant body mass index as compared to ma-ternal body mass index. Thus, these results suggest that intra-uterine programming effects may become more apparent at later ages. The intra-uterine programming effects may involve increased placental transfer of nutrients during fetal development. This may subsequently
Table 2
Associations of parental body mass index with infant subcutaneous fat mass measures.a
Fat mass measures in standard deviation scores Difference (95% confidence interval)
1.5 months 6 months 24 months
Model Body mass index Total subcutaneous fat mass Central-to-total subcutaneous fat mass ratio Body mass index Total subcutaneous fat mass Central-to-total subcutaneous fat mass ratio Body mass index Total subcutaneous fat mass Central-to-total subcutaneous fat mass ratio Maternal model n = 845 n = 729 n = 694 n = 694 n = 739 n = 733 n = 733 n = 659 n = 631 n = 631 Unadjusted model 0.05 (−0.03,0.12) 0 (−0.08,0.08) 0.04 (−0.04,0.11) 0.09 (0.02,0.17)⁎ 0.04 (−0.04,0.11) 0.01 (−0.07,0.08) 0.19 (0.11,0.25)⁎⁎ 0.08 (0.01,0.16)⁎ 0.08 (0.01,0.16)⁎ Adjusted modelb 0.03 (−0.04,0.10) −0.02 (−0.10,0.06) 0.04 (−0.04,0.12) 0.09 (0.01,0.17)⁎ 0.02 (−0.06,0.10) 0.02 (−0.06,0.10) 0.17 (0.09,0.26)⁎⁎ 0.09 (0.01,0.17)⁎ 0.08 (−0.01,0.17) Paternal model n = 797 n = 687 n = 656 n = 656 n = 700 n = 693 n = 693 n = 621 n = 597 n = 597 Unadjusted model 0.12 (0.05,0.20)⁎ −0.02 (−0.10,0.06) 0.06 (−0.01,0.14) 0.05 (−0.02,0.13) −0.01 (−0.09,0.06) 0.02 (−0.06,0.09) 0.10 (0.02,0.18)⁎ 0.03 (−0.05,0.11) 0.08 (−0.01,0.16) Adjusted modelc 0.10 (0.03,0.17)⁎ −0.02 (−0.10,0.05) 0.06 (−0.02,0.13) 0.04 (−0.04,0.12) −0.03(−0.11,0.05) 0.03 (−0.05,0.11) 0.08 (0.01,0.16)⁎ 0.02 (−0.06,0.10) 0.07 (−0.01,0.15) Combined maternal
and paternal model
n = 797 n = 687 n = 656 n = 656 n = 700 n = 693 n = 693 n = 621 n = 597 n = 597 Unadjusted model Maternal body mass index 0.02 (−0.06,0.09) 0 (−0.08,0.08) 0.03 (−0.05,0.11) 0.09 (0.01,0.16)⁎ 0.04 (−0.04,0.11) 0.01 (−0.07,0.08) 0.18 (0.10,0.26)⁎⁎ 0.08 (0.01,0.16)⁎ 0.07 (−0.01,0.15) Paternal body mass index 0.12 (0.04,0.19)⁎ −0.02 (−0.10,0.06) 0.06 (−0.02,0.14) 0.03 (−0.05,0.11) −0.02 (−0.10,0.06) 0.01 (−0.07,0.09) 0.06 (−0.02,0.13) 0.01 (−0.07,0.09) 0.06 (−0.02,0.14) Adjusted modeld Maternal body mass index 0.01 (−0.06,0.08) −0.02 (−0.11,0.06) 0.05 (−0.04,0.13) 0.09 (0.01,0.17)⁎ 0.03 (−0.06,0.11) 0.02 (−0.06,0.11) 0.17 (0.09,0.26)⁎⁎ 0.09 (0.01,0.18)⁎ 0.07 (−0.02,0.16) Paternal body mass index 0.10 (0.03,0.16)⁎ −0.02 (−0.10,0.06) 0.05 (−0.03,0.13) 0.02 (−0.05,0.10) −0.04(−0.12,0.05) 0.02 (−0.06,0.10) 0.05 (−0.03,0.13) 0 (−0.08,0.09) 0.06 (−0.02,0.14)
aValues are regression coefficients (95% confidence interval) from linear regression models that reflect differences in subcutaneous fat mass measures in standard-deviation scores at
1.5, 6 and 24 months per standard-deviation scores change in maternal and paternal pre-pregnancy body mass index. Total subcutaneous fat mass = biceps + triceps + suprailiacal + subscapular skinfold thicknesses. Central-to-total subcutaneous fat mass ratio = (suprailiacal + subscapular skinfold thicknesses) / total subcutaneous fat mass.
b
Maternal model includes maternal age and educational level, parity, maternal total energy intake, smoking habits and weight gain until 30 weeks of gestation, gestational diabetes, gestational hypertensive disorders, child's sex and gestational age-adjusted birthweight standard-deviation scores, cesarean delivery, breast feeding duration and timing of introduction of solid foods (for 6 and 24 months outcomes).
c
Paternal model includes the same potential confounders as maternal model but paternal age and educational level instead of maternal age and educational level.
d
Combined maternal and paternal model includes all potential confounders. ⁎ P-value b 0.05.
cause permanent adaptations in appetite, energy metabolism and neuro-endocrine function in offspring, which predispose individuals to a greater risk of obesity in later life[21]. Thesefindings could also be ex-plained by a stronger influence of maternal lifestyle-related characteris-tics on child's lifestyles and subsequent body fat mass. However, previous studies have suggested that maternal and paternal diet and physical activity are both associated with child's diet and physical activ-ity, without a stronger maternal influence[24,25]. Also, since we adjust-ed our analyses for multiple potential confounders the influence of lifestyle-related characteristics on ourfindings might be limited.
Next to maternal pre-pregnancy obesity, higher maternal total ges-tational weight gain is also associated with a higher childhood body mass index, total fat mass levels and waist circumference[26,27]. We did not observe consistent associations of maternal total gestational weight gain with early infant fat mass measures. It has been suggested that the associations of maternal weight gain with offspring fat mass outcomes may depend upon the timing of gestational weight gain. A prospective cohort study among 5154 UK mothers and their children showed that maternal weight gain during early-pregnancy was posi-tively associated with childhood body mass index and total fat mass
[22]. In line with thesefindings, we have previously shown that a higher maternal weight gain, especially in early-pregnancy, is associated with a higher childhood body mass index, total body fat mass and abdominal fat mass levels at the age of 6 years[5]. However, these associations were weaker as compared to the associations for maternal pre-pregnan-cy body mass index with these offspring fat mass measures. A study among 977 Greek mothers and their children aged 4 years showed that maternal weight gain during early-pregnancy was positively asso-ciated with childhood body mass index, waist circumference and sum of skinfold thickness[28]. In the current study, no associations were pres-ent for maternal early-, mid- and late-pregnancy weight gain during pregnancy with early infant fat mass measures. Thus, maternal weight gain during pregnancy seems not to influence fat mass development in early infancy, but the effects may become more apparent at older off-spring ages.
Strengths of this study were the prospective design with extensive maternal data collection from early pregnancy onwards and detailed
infant body fat measurements available. Of the 1033 mothers and their singleton children with pre-pregnancy body mass index available, 82% (845) had information on infant body fat measures. The non-re-sponse could lead to biased effect estimates if the associations of mater-nal obesity during pregnancy with infant body fat were different between participants included and excluded in the analyses. This seems unlikely since no differences were observed between partici-pants and non-participartici-pants regarding parental pre-pregnancy body mass index and maternal gestational weight gain. A limitation of our study might be the generalizability of ourfindings to other ethnic groups, due to our homogenous ethnic study population. Maternal pre-pregnancy body mass index and maximum gestational weight gain were self-reported, which may have led to misclassification and underestimation of the reported associations. However, we observed similar results when we used maternal weight measured at enrolment (results not shown) and weight gain measured until 30 weeks of gesta-tion. Skinfold thickness is a valid measure to estimate infants subcuta-neous fat mass but provides no information about intra-abdominal fat mass[8]. However, infant's body fat is mainly located subcutaneously in thefirst two years of life[29]. Also, inter- and intra-observer mea-surement error might be larger compared to other anthropometric measurements[30,31].
5. Conclusions
A higher maternal pre-pregnancy body mass index is associated with higher infant body mass index and total subcutaneous fat mass from the age of 6 months onwards. Maternal gestational weight gain was not associated with infant body fat. Further studies are needed to obtain insight into the causality of the observed associations, and the underlying biological mechanisms.
Conflicts of interest
None of the authors had afinancial or personal conflict of interest.
Table 3
Associations of maternal maximum gestational weight gain with infant subcutaneous fat mass measures.a
Fat mass measures in standard deviation scores Difference (95% confidence interval)
1.5 months 6 months 24 months
Body mass index Total subcutaneous fat mass Central-to-total subcutaneous fat mass ratio Body mass index Total subcutaneous fat mass Central-to-total subcutaneous fat mass ratio Body mass index Total subcutaneous fat mass Central-to-total subcutaneous fat mass ratio Maximum gestational
weight gain model
n = 501 n = 447 n = 430 n = 430 n = 466 n = 460 n = 460 n = 433 n = 414 n = 414 Unadjusted 0.10 (0.01,0.19)⁎ −0.03 (−0.12,0.07) −0.02(−0.11,0.08) 0.11 (0.02,0.20)⁎ 0.06 (−0.04,0.15) 0.04 (−0.05,0.14) 0 (−0.10,0.09) −0.05(−0.14,0.05) −0.10(−0.20,-0.01)⁎ Adjusted 0.05 (−0.04,0.14) −0.04 (−0.14,0.06) 0.01 (−0.09,0.12) 0.09 (−0.01,0.19) 0.09 (−0.01,0.19) 0.07 (−0.03,0.17) 0.01 (−0.09,0.10) −0.04 (−0.14,0.06) −0.11 (−0.21,−0.01)⁎ Excessive gestational
weight gain modelb
n = 242 n = 219 n = 212 n = 212 n = 225 n = 222 n = 222 n = 213 n = 202 n = 202 Unadjusted 0.19 (0.01,0.37)⁎ 0 (−0.19,0.19) 0.04 (−0.15,0.23) 0.32 (0.14,0.50)⁎⁎ 0.11 (−0.07,0.30) 0.11 (−0.08,0.29) 0.12 (−0.07,0.30) −0.01(−0.20,0.19) −0.11(−0.31,0.08) Adjusted 0.12 (−0.06,0.29) −0.03 (−0.23,0.18) 0.09 (−0.11,0.30) 0.30 (0.11,0.48)⁎⁎ 0.13 (−0.06,0.32) 0.16 (−0.03,0.35) 0.16 (−0.04,0.35) 0.03 (−0.17,0.23) −0.14 (−0.34,0.07) a
Values are regression coefficients (95% confidence interval) from linear regression models that reflect differences in subcutaneous fat mass measures in standard-deviation scores at 1.5, 6 and 24 months per standard-deviation scores change in maternal maximum gestational weight gain or for excessive weight gain as compared to the reference group (insufficient and sufficient weight gain). Total subcutaneous fat mass = biceps + triceps + suprailiacal + subscapular skinfold thicknesses. Central-to-total subcutaneous fat mass ratio = (suprailiacal + subscapular skinfold thicknesses) / total subcutaneous fat mass.
b
Adjusted for maternal age and educational level, parity, pre-pregnancy body mass index (for models with maximum gestational weight gain as a continuous variable), maternal total energy intake, smoking habits during pregnancy, gestational diabetes, gestational hypertensive disorders, child's sex and gestational age-adjusted birthweight standard-deviation scores, cesarean delivery, breast feeding duration and timing of introduction of solid foods (for 6 and 24 months outcomes).
⁎ P-value b 0.05. ⁎⁎ P-value b 0.01.
Funding
The general design of the Generation R Study is made possible by fi-nancial support from the Erasmus MC, University Medical Center, Rot-terdam, Erasmus University RotRot-terdam, Netherlands Organization for Health Research and Development (ZonMw), Netherlands Organisation for Scientific Research (NWO), Ministry of Health, Welfare and Sport and Ministry of Youth and Families. Research leading to these results has received funding from the European Union Seventh Framework Programme (FP7/2007-2013), project EarlyNutrition under grant agreement n°289346. Susana Santos received a grant from the Portu-guese Foundation for Science and Technology (SFRH/BD/81123/2011). Vincent Jaddoe received an additional grant from the Netherlands Orga-nization for Health Research and Development (NWO, ZonMw-VIDI 016.136.361) and Consolidator Grant from the European Research Council (ERC-2014-CoG-648916).
Acknowledgements
The authors' contributions to this study were as follows: VVJ, SS, RG and VWVJ designed the research project; VWVJ and EAPS were involved in the design and planning of the study and data collection; VVJ and SS conducted the analyses; VVJ, SS, RG and VWVJ wrote the paper; EAPS critically reviewed the manuscript; VVJ, SS, RG and VWVJ had primary responsibility for thefinal content. All authors read and approved the fi-nal manuscript. We gratefully acknowledge the contribution of general practitioners, hospitals, midwives, and pharmacies in Rotterdam. Appendix A. Supplementary data
Supplementary data to this article can be found online athttp://dx. doi.org/10.1016/j.earlhumdev.2017.03.006.
References
[1] Z. Yu, S. Han, J. Zhu, X. Sun, C. Ji, X. Guo, Pre-pregnancy body mass index in relation to infant birth weight and offspring overweight/obesity: a systematic review and meta-analysis, Public Libr. Sci. 8 (2013) e61627 (one).
[2] H.T. Tie, Y.Y. Xia, Y.S. Zeng, Y. Zhang, C.L. Dai, J.J. Guo, et al., Risk of childhood over-weight or obesity associated with excessive over-weight gain during pregnancy: a meta-analysis, Arch. Gynecol. Obstet. 289 (2014) 247–257.
[3] E.W. Demerath, C.M. Schubert, L.M. Maynard, S.S. Sun, W.C. Chumlea, A. Pickoff, et al., Do changes in body mass index percentile reflect changes in body composi-tion in children? Data from the Fels Longitudinal Study, Pediatrics 117 (2006) e487–e495.
[4] J.P. Despres, Body fat distribution and risk of cardiovascular disease: an update, Cir-culation 126 (2012) 1301–1313.
[5] R. Gaillard, E.A. Steegers, O.H. Franco, A. Hofman, V.W. Jaddoe, Maternal weight gain in different periods of pregnancy and childhood cardio-metabolic outcomes. The Generation R Study, Int. J. Obes. (Lond) 39 (2015) 677–685.
[6] R. Gaillard, E.A. Steegers, L. Duijts, J.F. Felix, A. Hofman, O.H. Franco, et al., Childhood cardiometabolic outcomes of maternal obesity during pregnancy: the Generation R Study, Hypertension 63 (2014) 683–691.
[7] C. Druet, N. Stettler, S. Sharp, R.K. Simmons, C. Cooper, G.D. Smith, et al., Prediction of childhood obesity by infancy weight gain: an individual-level meta-analysis, Paediatr. Perinat. Epidemiol. 26 (2012) 19–26.
[8] J.C. Wells, M.S. Fewtrell, Measuring body composition, Arch. Dis. Child. 91 (2006) 612–617.
[9] L. Ay, A.C. Hokken-Koelega, D.O. Mook-Kanamori, A. Hofman, H.A. Moll, J.P. Mackenbach, et al., Tracking and determinants of subcutaneous fat mass in early childhood: the Generation R Study, Int. J. Obes. (Lond) 32 (2008) 1050–1059.
[10] S. Santos, R. Gaillard, A. Oliveira, H. Barros, A. Hofman, O.H. Franco, et al., Subcutane-ous fat mass in infancy and cardiovascular risk factors at school-age: the Generation R Study, Obesity (Silver Spring) 24 (2016) 424–429.
[11] V.W. Jaddoe, C.M. van Duijn, O.H. Franco, A.J. van der Heijden, M.H. van Iizendoorn, J.C. de Jongste, et al., The Generation R Study: design and cohort update 2012, Eur. J. Epidemiol. 27 (2012) 739–756.
[12] Institute of Medicine (US) and National Research Council (US) Committee to Reexamine IOM Pregnancy Weight Guidelines, Weight gain during pregnancy, in: Rasmussen K.M. YA (Ed.), Reexamining the Guidelines, National Academies Press (US), Washington (DC), 2009.
[13] I.J. Ketel, M.N. Volman, J.C. Seidell, C.D. Stehouwer, J.W. Twisk, C.B. Lambalk, Superi-ority of skinfold measurements and waist over waist-to-hip ratio for determination of body fat distribution in a population-based cohort of Caucasian Dutch adults, Eur. J. Endocrinol. 156 (2007) 655–661.
[14] J.C. Wells, T.J. Cole, A.S. Steam, Adjustment of fat-free mass and fat mass for height in children aged 8 y, Int. J. Obes. Relat. Metab. Disord. 26 (2002) 947–952.
[15] A. Niklasson, A. Ericson, J.G. Fryer, J. Karlberg, C. Lawrence, P. Karlberg, An update of the Swedish reference standards for weight, length and head circumference at birth for given gestational age (1977–1981), Acta Paediatr. Scand. 80 (1991) 756–762.
[16]M.G. Keijzer-Veen, A.M. Euser, N. van Montfoort, F.W. Dekker, J.P. Vandenbroucke, H.C. Van Houwelingen, A regression model with unexplained residuals was pre-ferred in the analysis of the fetal origins of adult diseases hypothesis, J. Clin. Epidemiol. 58 (2005) 1320–1324.
[17] A. Fraser, K. Tilling, C. Macdonald-Wallis, N. Sattar, M.J. Brion, L. Benfield, et al., As-sociation of maternal weight gain in pregnancy with offspring obesity and metabolic and vascular traits in childhood, Circulation 121 (2010) 2557–2564.
[18] R.C. Whitaker, Predicting preschooler obesity at birth: the role of maternal obesity in early pregnancy, Pediatrics 114 (2004) e29–e36.
[19]C.R. Gale, M.K. Javaid, S.M. Robinson, C.M. Law, K.M. Godfrey, C. Cooper, Maternal size in pregnancy and body composition in children, J. Clin. Endocrinol. Metab. 92 (2007) 3904–3911.
[20]A. Andres, H.R. Hull, K. Shankar, P.H. Casey, M.A. Cleves, T.M. Badger, Longitudinal body composition of children born to mothers with normal weight, overweight, and obesity, Obesity (Silver Spring) 23 (2015) 1252–1258.
[21] D.A. Lawlor, G.D. Smith, M. O'Callaghan, R. Alati, A.A. Mamun, G.M. Williams, et al., Epidemiologic evidence for the fetal overnutrition hypothesis:findings from the mater-university study of pregnancy and its outcomes, Am. J. Epidemiol. 165 (2007) 418–424.
[22] C. Fleten, W. Nystad, H. Stigum, R. Skjaerven, D.A. Lawlor, G. Davey Smith, et al., Par-ent-offspring body mass index associations in the Norwegian Mother and Child Co-hort Study: a family-based approach to studying the role of the intrauterine environment in childhood adiposity, Am. J. Epidemiol. 176 (2012) 83–92.
[23] G. Davey Smith, C. Steer, S. Leary, A. Ness, Is there an intrauterine influence on obe-sity? Evidence from parent child associations in the avon longitudinal study of par-ents and children (alspac), Arch. Dis. Child. 92 (2007) 876–880.
[24] I. Rossow, J. Rise, Concordance of parental and adolescent health behaviors, Soc. Sci. Med. 38 (1994) 1299–1305.
[25] V. Cleland, A. Venn, J. Fryer, T. Dwyer, L. Blizzard, Parental exercise is associated with Australian children's extracurricular sports participation and cardiorespiratory fit-ness: a cross-sectional study, Int. J. Behav. Nutr. Phys. Act. 2 (2005) 3.
[26]A.A. Mamun, M. Mannan, S.A. Doi, Gestational weight gain in relation to offspring obesity over the life course: a systematic review and bias-adjusted meta-analysis, Obes. Rev. 15 (2014) 338–347.
[27] R. Ensenauer, A. Chmitorz, C. Riedel, N. Fenske, H. Hauner, U. Nennstiel-Ratzel, et al., Effects of suboptimal or excessive gestational weight gain on childhood overweight and abdominal adiposity: results from a retrospective cohort study, Int. J. Obes. (Lond) 37 (2013) 505–512.
[28]M. Karachaliou, V. Georgiou, T. Roumeliotaki, G. Chalkiadaki, V. Daraki, S. Koinaki, et al., Association of trimester-specific gestational weight gain with fetal growth, off-spring obesity, and cardiometabolic traits in early childhood, Am. J. Obstet. Gynecol. 212 (502) (2015) e1–14.
[29]S. Holzhauer, R.M. Zwijsen, V.W. Jaddoe, G. Boehm, H.A. Moll, P.G. Mulder, et al., Sonographic assessment of abdominal fat distribution in infancy, Eur. J. Epidemiol. 24 (2009) 521–529.
[30]WHO Multicentre Growth Reference Study Group, Reliability of anthropometric measurements in the WHO Multicentre Growth Reference Study, Acta Paediatr. Suppl. 450 (2006) 38–46.
[31]L.A. Moreno, M. Joyanes, M.I. Mesana, M. Gonzalez-Gross, C.M. Gil, A. Sarria, et al., Harmonization of anthropometric measurements for a multicenter nutrition survey in Spanish adolescents, Nutrition 19 (2003) 481–486.