Maternal obesity and offspring body composition
by indirect methods: a systematic review and
meta-analysis
Obesidad maternal y composición corporal de los
hijos por métodos indirectos: revisión sistemática
y metaanálisis
Obesidade materna e composição corporal dos
filhos por métodos indiretos: revisão sistemática
e meta-análises
1 Faculdade de Medicina, Universidade Federal de Pelotas, Pelotas, Brasil. 2 Faculdade de Medicina, Universidade de São Paulo, São Paulo, Brasil. Correspondence H. Castillo-Laura Departamento de Medicina Preventiva, Faculdade de Medicina, Universidade Federal de Pelotas. Rua Marechal Deodoro 1160, 3o andar, C.P. 464, Pelotas, RS 96020-220, Brasil.
Helen Castillo-Laura 1 Iná S. Santos 1
Lenice C. M. Quadros 1 Alicia Matijasevich 2
Abstract
This study reviewed the evidence that assessed the association between maternal pre-pregnan-cy body mass index (BMI) and/or gestational weight gain and offspring body composition in childhood. A systematic review was conducted. Cohort studies, case-control studies and ran-domized controlled trials measuring offspring body composition by indirect methods were in-cluded. Meta-analyses of the effect of pre-preg-nancy BMI on offspring fat-free mass, body fat percent, and fat mass were conducted through random-effects models. 20 studies were includ-ed, most of which reported a positive associa-tion of pre-pregnancy BMI with offspring body fat. Standardized mean differences in body fat percent, fat mass and fat-free mass between infants of women with normal pre-pregnancy BMI and those of overweight/obese women were 0.31 percent points (95%CI: 0.19; 0.42), 0.38kg (95%CI: 0.26; 0.50), and 0.18kg (95%CI: -0.07; 0.42), respectively. Evidence so far suggests that pre-pregnancy maternal overweight is associ-ated with higher offspring adiposity.
Obesity; Pregnancy; Body Composition; Adiposity
Resumen
Esta revisión evaluó la asociación entre el ín-dice de masa corporal (IMC) pregestacional y/o el aumento de peso gestacional con la compo-sición corporal de los hijos en la infancia. Se realizó una revisión sistemática. Se incluyeron estudios de cohorte, caso-control y ensayos ran-domizados, que determinaron la composición corporal de los hijos mediante métodos indi-rectos. Se realizaron metaanálisis del efecto del IMC pregestacional sobre la masa libre de grasa, porcentaje de grasa corporal y masa de grasa. Se incluyeron 18 estudios, la mayoría de los cuales reportó asociación positiva entre el IMC mater-no pregestacional y la adiposidad de los hijos. Las diferencias de medias padronizadas de por-centaje de grasa corporal, masa de grasa y ma-sa libre de grama-sa entre hijos de mujeres con IMC pregestacional normal, en comparación con los de mujeres con sobrepeso/obesidad fueron: 0,31 puntos porcentuales (IC95%: 0,19; 0,42), 0,38kg (IC95%: 0,26; 0,50) y 0,18kg (IC95%: -0,07; 0,42), respectivamente. Esta evidencia sugiere que el sobrepeso materno pregestacional se asocia con una elevada adiposidad en sus hijos.
Introduction
According to observational studies, carried out in high income countries, maternal lifestyle, di-etary habits, physical activity and work hours could influence offspring size at birth, and weight development in childhood 1,2,3.
Pre-preg-nancy and gestational maternal body composi-tion may impact offspring body fat mass at birth, in childhood and in adolescence, and may also predict the risk of obesity in adulthood 4,5,6,7,8.
The increase in the prevalence of maternal obe-sity in recent decades 9,10 has occurred in parallel
with the increment of large for gestational age newborns 11,12,13 and an increased incidence of
childhood obesity 14. Female offspring of obese
women are most likely to be obese predisposing their children to obesity, insulin resistance and diabetes 6,15,16. Several studies have shown that
a high increment in maternal gestational weight gain associated with increased offspring body mass index (BMI) 17,18,19 whereas other studies
have reported no such association 20,21. In
con-sequence, across a number of generations a po-tential intergenerational cycle of increased risk of obesity and metabolic sequelae in the offspring of obese mothers is expected, with important im-plications for public health policies 4,11,12.
In investigating the relationship of high ma-ternal pre-pregnancy BMI or gestational weight gain and increased offspring body composition at various ages, the majority of studies have em-ployed double indirect methods (bioelectrical impedance and anthropometric measurements)
7,8,21,22 that use a two-component model,
divid-ing body weight into fat mass and fat free mass 23.
Recently indirect measuring methods including air displacement plethysmography (ADP), dual energy X-ray absorptiometry (DEXA), total body water (TBW), and body electrical conductivity (TOBEC) have been introduced to the assessment of body composition. These indirect measuring methods are based on a three- or four-compart-ment model, providing accurate measurefour-compart-ments of body fat, lean mass, bone mass, and TBW 23,24.
This review aimed to: (a) identify studies that investigated the relationship between maternal pre-pregnancy BMI and/or gestational weight gain and offspring fat mass, lean mass, fat-free mass, fat mass index, fat free mass index, lean mass index, body fat percent as measured by in-direct methods; and (b) calculate a pooled mea-sure of the strength of the association.
Methods
This systematic review included studies pub-lished between the beginning of the indexing by databases until August 2015. The reporting guidance included in the preferred reporting items for systematic reviews and meta-analyses (PRISMA) statement followed 25.
a) Eligibility criteria: prospective or retrospec-tive cohorts, case-control studies, cross-sectional and randomized controlled trials that evaluated the association between maternal pre-pregnan-cy BMI and/or gestational weight gain with off-spring body composition by indirect methods were eligible for the review. Participants included mother-offspring pairs with the exception of out-comes measured in adolescents and adult pop-ulations. Measurements of the outcomes were obtained by DEXA, ADP or TOBEC equipments (indirect methods).
b) Search strategy: a search in the electronic MEDLINE, LILACS and SciELO databases and cited references of the select articles was per-formed. The search was restricted to publications in English, French, Portuguese, Spanish and Ital-ian and original studies in humans. The Medical Subject Headings (MeSH) descriptors used were: “maternal weight, over-nutrition, anthropometry, under-nutrition, body mass index, size, obesity, nutritional status”; OR “prenatal body mass index, obesity, weight, and height”; OR “pre-pregnancy weight, obesity, body mass index”; OR “pregnancy weight gain”; OR “gestational weight gain” com-bined with “body composition”, “body fat”, “body fat percentage”, “fat mass”, “lean mass”, “fat mass index”, “lean mass index”, “fat free mass”, “ adipos-ity”, “ADP”, “TOBEC” and “DEXA”.
c) Data collection process: the study selection was conducted in duplicate by two independent evaluators in order to screen articles which were stored in EndNote (http://www.endnote.com; Thomson Reuters, USA). The screening stages were: (1) reading study titles for potential inclu-sion; (2) reading the abstracts of study titles with potential inclusion and selected the full-text articles; (3) full-text articles screening; and (4) assessment of selected articles. Disagreements among the evaluators regarding study eligibil-ity following abstract and full-text review were solved by consensus.
fat percent, lean mass index (LMI), fat mass index (FMI), and high adiposity in children.
d) Data extraction: for data extraction, the two independent evaluators were responsible for collecting primary data from the selected stud-ies, which were stored in Excel (Microsoft Corp., USA). Information related to study characteris-tics, such as year, city/country, design, inclusion and exclusion criteria, sample size or number of participants, maternal exposure, age of outcome measurement, indirect method of outcome mea-surement, and analysis adjustment variables was gathered. Outcome data was extracted indepen-dently of the type of the measure of effect pre-sented by the authors (mean, relative risk, odd ratio, etc.). Disagreements among the evaluators regarding data items were solved by consensus. e) Risk of bias in individual studies: to assess the quality of the randomized control trials the 27-items Downs and Black scale was employed 26.
19 items of the original scale were used to assess the quality of observational studies: type of study, hypothesis/aim, outcomes, exposures, partici-pant selection, loss of follow-up, random variabil-ity, statistical method, probability values, source population, study sample, bias, data dredg-ing, lengths of follow-up, precision, confound-ing and power. Accordconfound-ing to Downs & Black 26,
randomized controlled trials could achieve a score ranging from 0 to 27 points, and the obser-vational studies 0 to 20 points. Study quality was determined by the higher score.
f ) Summary measures: for meta-analysis the data extracted included the mean (M), standard deviation (SD) or standard error of the mean (SEM), and the sample size (N) for two groups of women: underweight/normal-weight and over-weight/obese, for each continuous outcome (body fat percent, fat mass and fat-free mass). The aggregated effect of pre-pregnancy BMI was estimated by calculating the standardized mean differences. The random-effects model for fat-free mass (because heterogeneity between stud-ies was detected) and the fixed-effects model for body fat percent and fat mass, and the cor-responding 95% confidence intervals (95%CI) were estimated. The aggregated results for these seven studies are presented in forest plot graph-ics. Meta-regression and subgroup analysis were conducted to examine the impact of mod-erator variables on fat-free mass standardized mean difference (SMD). Subgroup analysis was considered and the subsets were study sample, outcome age measurement, study design, in-direct method to outcome measurement and confounding control. Stata version 12.0 (Stata-Corp LP, College Station, USA) was used for data analyses.
g) Risk of bias across studies: statistical hetero-geneity among studies was assessed with the Q and I2 statistics tests. Publication bias was
in-vestigated with Begg’s funnel plot and was fur-ther assessed using the Egger’s linear regression test method.
Results
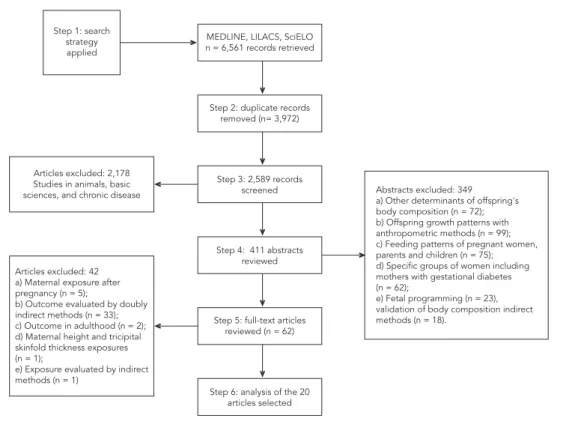
A total of 6,561 articles were initially retrieved: 3,972 duplicate records were removed and 2,589 records screened. Studies on animals, basic sci-ences, and chronic diseases (n = 2,178) were ex-cluded after a first reading of titles, resulting in 411 abstracts to be analyzed. For 349 abstracts in the review, the exclusion criteria considered were: studies that investigated other distal, in-termediate or proximal determinants of off-spring’s body composition but not maternal pre-pregnancy BMI or gestational weight gain (n = 72); studies investigating offspring growth pat-terns using only anthropometric methods (n = 99); studies investigating the feeding patterns of pregnant women, parents and children (n = 75); studies analyzing specific groups of women in-cluding mothers with gestational diabetes (n = 62); studies investigating fetal programming (n = 23); validation of body composition by indirect methods (n = 18). Only studies that were clearly irrelevant were excluded at the first stage. The full text of identified articles including those where there were disagreements in the initial title/ab-stract scanning, were reviewed to ensure that the inclusion criteria were met.
Of the 62 remaining articles, 42 were excluded for the following reasons: studies that investi-gated maternal exposure after pregnancy (n = 5); outcome evaluated by doubly indirect methods (n = 33); outcome in adulthood (n = 2); maternal height and tricipital skinfold thickness exposures (n = 1); exposure evaluated by indirect methods (n = 1). The cited references of the 20 articles se-lected were reviewed however no additional pub-lications were found. Figure 1 shows the number of articles retrieved, then excluded at each stage of the review process and the corresponding rea-sons for their exclusion.
Among the 20 articles that met the inclusion criteria, six included both exposures 6,27,28,29,30,31.
for assessment of body composition of offspring; and confounding variables used in the statistical analyses according to maternal exposures.
Studies that assessed the effect of maternal pre-pregnancy BMI
In 16 of the 20 articles selected, maternal pre-pregnancy BMI was the main exposure investi-gated. Ten studies were conducted in the United States 5,6,29,30,32,33,34,35,36,37,two in the United
Kingdom 28,38, two in Denmark 32,39, one in
Aus-tralia 27, one in Brazil 31, and one in Portugal 40
(Table 1). The number of participants in the cohorts ranged from 78 34 to 3,263 38. Although
these studies applied different inclusion and ex-clusion criteria, all consistently excluded prema-ture newborns, those with congenital abnormali-ties, offspring of mothers with a history of pre-gestational or pre-gestational diabetes, and children with chronic diseases. With the exception of five studies 27,29,31,35,36,all other studies included only
Caucasian participants.
All studies except for three 28,30,37, stratified
maternal pre-pregnancy BMI to establish ma-ternal overweight and/or obesity. Eight stud-ies measured body composition in newborns
5,6,27,29,32,33,37,40, whilst all other studies measured
body composition in childhood (2-11 years of age). The methods for the assessment of body composition included DEXA in eight studies
28,30,32,34,35,36,38,39, ADP in seven 5,6,27,31,33,37,38 and
TOBEC in one 29 (Table 2).
• Pre-pregnancyBMIandoffspringadiposity
Table 2 summarizes the main results of the 16 studies reviewed. 13 reported fat mass 5,6,29,30, 31,32,33,34,35,37,38,39,40 and two FMI 28,31 as the
pri-mary outcome. In nine studies 5,28,29,31,32,33,34,35,38
univariate analyses showed a statistically sig-nificant positive association between maternal pre-pregnancy BMI and fat mass in offspring. This association remained significant after ad-justing for confounders in six of the studies
28,29,31,32,34,38. The relationship between maternal
Figure 1
Table 1
Methodological characteristic of articles assessing maternal pre-gestational BMI and/or gestational weight gain and offspring body composition in childhood.
Author (city, country)
Design/N/Score Downs & Black 26
Inclusion and exclusion criteria Maternal exposure Indirect method /Outcome age measurement Adjustment variables Berkowitz et al. 34
(Philadelphia, USA)
Prospective cohort N = 78 Score = 14
Inclusion: maternal age > 18 years old, caucasian. Offspring healthy,
uncomplicated full-term births. Exclusion: maternal gestational diabetes. Offspring: gestational age < 36 or > 42 weeks, low or high birth
weight for gestational age
Maternal pre-pregnancy
BMI
DEXA, at 6 years of age
Maternal: family income, obesity risk. Offspring: gender, weight at age two
Burdette et al. 35
(Cincinnati, USA)
Prospective cohort N = 313 Score = 15
Inclusion: father and mother of same race. Offspring: full-term birth, no
chronic diseases
Maternal pre-pregnancy
BMI
DEXA, at 5 years of age
Maternal: race, age, education, smoking during pregnancy, marital
status, family income, nutrition program. Offspring: gender, lean mass, birth weight, breastfeeding,
overfeeding Sewell et al. 29
(Cleveland, USA)
Prospective cohort N = 220 Score = 15
Inclusion: pregnant women with normal glucose tolerance, singleton pregnancy. Exclusion: maternally or gestational
diabetes mellitus. Offspring: birth weight < 2,000g, congenital anomalies
Maternal pre-pregnancy
BMI
TOBEC, at 72 hours after birth
None
Gestational weight gain
Maternal: glucose, smoking during pregnancy. Offspring: gestational
age, gender Gale et al. 28
(Southampton, UK)
Prospective cohort N = 216 Score = 18
Inclusion: maternal: caucasian, age ≥ 16 years, singleton pregnancy. Exclusion: maternal gestational diabetes, hormonal therapy for pregnancy. Offspring: gestational age
< 17 weeks
Maternal pre-pregnancy
BMI
DEXA, at 9 years of age
Maternal: height, gestational weight gain, smoking during pregnancy.
Offspring: height, birth weight, breastfeeding, conditional
weight gain Gestational
weight gain
Maternal: height, smoking during pregnancy, pre-pregnancy BMI. Offspring: height, birth weight, breastfeeding, conditional
weight gain Lawlor et al. 38
(Avon, UK)
Prospective cohort N = 3,263 Score = 17
Inclusion: singleton pregnancy Maternal pre-pregnancy
BMI
DEXA, at 9-11 years of age
Height and height squared at time of DEXA assessment, gender, age, family social class, parental education, parity, parental smoking at time of pregnancy, offspring pubertal status at time of DEXA assessment,
breastfeeding Hull et al. 5
(Oklahoma City, USA)
Prospective cohort N = 72 Score = 15
Inclusion: maternal: age at delivery 18-45 years old. Offspring: healthy,
full-term birth.
Exclusion: maternal smoking and excessive alcohol consumption during pregnancy, diabetes type 1, 2 or gestational diabetes. Offspring:
congenital anomalies
Maternal pre-pregnancy
BMI
ADP, at first 35 days of age
Age of children at time of visit
Table 1 (continued)
Author (city, country)
Design/N/Score Downs & Black 26
Inclusion and exclusion criteria Maternal exposure
Indirect method /Outcome age
measurement
Adjustment variables
Crozier et al. 42
(Southampton, UK)
Prospective cohort N = 948 Score = 15
Gestational weight gain
ADP, at birth, age 4 years, age 6
years of age
Maternal: pre-pregnancy BMI, smoking during pregnancy, age, height, parity, education. Offspring:
birth weight, height, duration of breastfeeding, gender, age at time
of assessment Hull et al. 6
(New York, USA)
Prospective cohort N = 306 Score = 15
Inclusion: healthy, full-term birth, singleton pregnancy. Exclusion: maternal diabetes, hypertension or pre-eclampsia. Offspring: congenital anomalies,
admission to ICU
Maternal pre- pregnancy
BMI
ADP, at 24-48 hours after birth
None
Gestational weight gain
Maternal: skin color/race, age. Offspring: gender, gestational age,
age at the time of the assessment Au et al. 27
(Sydney, Australia)
Retrospective cohort N = 599 Score = 15
Inclusion: full-term birth, living within the geographical area of the health service. Exclusion: maternal gestational diabetes.
Offspring: congenital anomalies or admission to ICU
Maternal pre- pregnancy
BMI
ADP, at 48 hours after birth
Maternal: ethnicity, parity, hypertension, gestational weight gain, gestational diabetes mellitus
status. Offspring: gender, gestational age Josefson et al. 41
(Chicago, USA)
Prospective cohort N = 38 Score = 13
Inclusion: maternal normal diabetes screening test in normal-weight
Gestational weight gain
ADP, at 72 hours after birth
None
Henriksson et al. 44 (Linkoping,
Sweden)
Prospective cohort N = 312 Score = 15
Inclusion: healthy offspring, singleton, full-term.
Exclusion: Maternal: pre-eclampsia, lack of pregnancy weight, serious disease.
Gestational weight gain
ADP, at 2 to 11 days of age
Maternal: smoking habits, parity, educational level. Offspring: height
Carlsen et al. 32
(Copenhagen, Denmark)
Randomized controlled trial
N = 311 Score = 24
Inclusion: offspring: singleton, full-term. Exclusion: maternal; chronic disease, pre-eclampsia. Offspring: congenital
malformations, admission to ICU
Maternal pre-pregnancy
BMI
DEXA, within 48 hours after at birth
Maternal: age, education level, smoking habits
Estampador et al. 43
(Vasterbotten, Sweden)
Prospective cohort N = 33 Score = 23
Inclusion: singleton pregnancy Rate of gestational weight gain
ADP, at 4 months of age
None
Tanvig et al. 39
(Odense, Denmark)
Randomized controlled trial
N = 86 Score = 23
Inclusion: offspring: singleton, healthy, caucasian mother. Exclusion: maternal diabetes, pre-existing hypertensive disorders,
mental illness
Maternal pre-pregnancy
BMI
DEXA, at 2.5 to 3 years of age
None
Perng et al. 30
(Boston, USA)
Prospective cohort N = 848 Score = 16
Inclusion: singleton pregnancy. Exclusion: maternal diabetes, gestation
length less than 34 weeks
Maternal pre-pregnancy
BMI Gestational weight gain
DEXA, at 6-10 years of age
Maternal race/ethnicity, parity
Pereira-da-Silva et al. 40 (Lisbon,
Portugal)
Retrospective cohort N = 100 Score = 15
Inclusion: proper medical surveillance, singleton full-term neonate, adequade gestational age*, healthy offspring Exclusion: adverse conditions potentially
affecting fetal nutrition and growth, reported consumption of alcohol,
tobacco, or illicit drugs
Maternal pre-pregnancy
BMI
ADP, at 72 hours after birth
Percentage of total energy value from carbohydrate or from protein
Table 1 (continued)
Author (city, country)
Design/N/Score Downs & Black 26
Inclusion and exclusion criteria Maternal exposure
Indirect method /Outcome age
measurement
Adjustment variables
Shapiro et al. 33
(Denver, USA)
Prospective cohort N = 951 Score = 16
Exclusion: preexisting diabetes type 1 or 2, a prior premature birth or fetal death,
asthma with steroid management, serious psychiatric illness or a current
multiple pregnancy
Maternal pre-pregnancy
BMI
ADP, at 48 hours after birth
Starling et al. 37
(Denver, USA)
Prospective cohort N = 826 Score = 16
Exclusion: preexisting diabetes type 1 or 2, a prior premature birth or fetal death,
asthma with steroid management, serious psychiatric illness or a current
multiple pregnancy
Maternal pre-
pregnancy-BMI
ADP, at ≤ 3 days of age
Castillo et al. 31
(Pelotas, Brazil)
Prospective cohort N = 3,156 Score = 18
Inclusion: singleton pregnancy Maternal pre-pregnancy
BMI
Gestational weight gain
ADP, at 6 years Maternal: family income, schooling at birth, skin color, age, parity, smoking and alcohol consumption during pregnancy, history of arterial hypertension, history of diabetes
mellitus, gestational age. Offspring: birthweight and sex. Andrés et al. 36
(Kansas City, USA)
Prospective cohort N = 325 Score = 17
Inclusion: pregnancy uncomplicated, nonsmokers, who denied alcohol use during pregnancy. Singleton full-term offspring, exclusively breast-fed until at
least age 6 months
Maternal pre-pregnancy
BMI
DEXA, at 6 years Maternal: race, gestational age. Offspring: birthweight and mode of
infant feeding.
ADP: plethysmography; DEXA: dual-energy X-ray absorptiometry; ICU: intensive care unit; TOBEC: total body electrical conductivity. * Birth weight > 3rd and 97th percentiles for gestational age and gender).
Note: rate of gestational weight gain in mid-pregnancy or in late-pregnancy (kg per week).
pre-pregnancy BMI and body fat mass in chil-dren was assessed in 13 studies 5,6,27,29,31,32,33,34,35, 36,37,39,40 and a positive association was reported
only following univariate analyses in six studies
5,29,31,32,33,34.
Eight studies included in the meta-analysis
5,6,27,29,31,32,33,39 assessed body fat percent and fat
mass in infants in the first months of life to six years of age. The SMD between infants of normal weight women and those of overweight or obese women before pregnancy were relatively small: 0.31 (95%CI: 0.23; 0.39) and 0.38 (95%CI: 0.30; 0.46) for body fat percent and fat mass, respec-tively (I2 = 28% and 18.5%; and p value for test
of heterogeneity of 0.21 and 0.29, respectively) (Figure 2).
Begg’s funnel plots and Egger’s publication bias plots were used to assess the potential pub-lication bias for body fat percent and fat mass. No publication bias was detected by Egger’s test (p-value = 0.49 for body fat percent and p-value = 0.60 for fat mass).
• Maternalpre-pregnancyBMIand
offspring lean mass or fat-free mass
The relationship of maternal pre-pregnancy BMI with lean mass 34,38, fat-free mass 5,6,28,29,31,32,33,39,
fat-free mass percent 36 and LMI 28,31 was assessed
in 11 studies (Table 2). Four studies reported a statistically significant positive association fol-lowing a univariate analysis 28,31,34,38 and two
studies 31,36 after adjusted analysis. In contrast,
Gale et al. 28 reported a significant positive
asso-ciation between pre-pregnancy BMI and LMI in only male offspring and this was no longer signif-icant following adjusted analysis. Furthermore, Hull et al.5 reported an inverse association. In the
aggregate measure analysis, SMD in fat-free mass between children of normal weight women and those of overweight or obese women was signifi-cant: 0.21 (95%CI: 0.02; 0.40), I2 = 84.9%, test for
heterogeneity p-value = 0.000 (Figure 2). No publi-cation bias was detected by Egger’s test, p-value = 0.12 for fat-free mass.
visu-Table 2
Maternal pre-pregnacy body mass index (BMI) and offspring body composition in childhood.
Author Maternal exposure (pre-gestational BMI)
Offspring outcome/Measures of effect Crude analyses Adjusted analyses
Studies that assessed body fat percent
Berkowitz et al. 34 High risk Body fat % (percentage point) at 4 years,
mean (SD)
21.0 (6.2)
-Low risk 20.3 (3.4)
-High risk Body fat % (percentage point) at 6 years, mean (SD)/β (SE)
24.7 (11.8) 112.3 (77.4)
Low risk 18.8 (4.5)* Reference
Sewell et al. 29 < 25kg/m² Body fat % (percentage point) at 72 hours,
mean (SD)
9.6 (4.3)
-≥ 25kg/m² 11.0 (4.7)*
-Burdette et al. 35 ≥ 30kg/m² Hight adiposity (%) at 6 years, %/OR (95%CI) 30.8 0.95 (0.4; 2.1)
< 30kg/m² 23.4 Reference
Hull et al. 5 < 25kg/m² Body fat % (percentage point) at 35 days,
mean (SD)
12.5 (4.2)
-≥ 25kg/m² 13.6 (4.3) *
-Hull et al. 6 < 25kg/m² Body fat % (percentage point) at 24-48 hours,
mean (SD)
11.7 (4.1)
-25-30kg/m² 13.0 (4.7)
-> 30kg/m² 14.6 (4.3)
-Au et al. 27 <18.5kg/m² Body fat % (percentage point) at 48 hours, mean
(SD)/β (95%CI)
8.8 (4.1) -0.2 (-1.5; 1.2)
18-24kg/m² 9.0 (4.2) Reference
25-29kg/m² 9.9 (4.8) 1.2 (0.3; 2.1) *
30-34kg/m² 9.0 (4.5) -0.9 (-2.8; 0.9)
> 35kg/m² - 3.1 (0.7; 5.5) *
Carlsen at al. 32 18-24kg/m² Body fat % (percentage point) at 48 hours, mean
(SD)/β (95%CI)
8.8 (3.6) * Reference
≥ 30kg/m² 11.2 (4.3) 3.1 (2.0; 4.1)
Tanvig et al. 39 18-24kg/m² Body fat % (percentage point) at 2.5-3 years,
mean (95%CI)
21.3 (19.5; 23.1)
-≥ 30kg/m² 21.6 (19.4; 23.8)
-Pereira-da-Silva et al. 40
kg/m² Body fat % (percentage point) at 72 hours, β 0.2
-≥ 25kg/m² Bady fat % (percentage point) at 72 hours, β 0.9 -Shapiro et al. 33 < 25kg/m² Body fat % (percentage point) at 48 hours,
mean (SD)
8.8 (3.8)
-25-29kg/m² 9.4 (3.9)
-≥ 30kg/m² 10.1 (4.0)
-kg/m² Body fat % (percentage point) at 48 hours, β (95%CI)
0.2 (0.1; 0.2) 0.1 (0.04; 0.2)
Starling et al. 37 kg/m² Body fat % (percentage point) at 3 days, β
(95%CI)
- 0.1 (0.1; 0.2)
Castillo et al. 31 kg/m² Body fat % (percentage point) at 6 years, β
(95%CI)
0.3 (0.3; 0.4) 0.18 (0.03; 0.3)
< 18.5kg/m2 Body fat % (percentage point) at 6 years,
mean (SD)
20.1 (5.6)**
18.5-24kg/m² 23.0 (7.5)
25-29kg/m² 24.7 (8.4)
≥ 30kg/m² 26.8 (9.5)
Table 2 (continued)
Author Maternal exposure (pre-gestational BMI)
Offspring outcome/Measures of effect Crude analyses Adjusted analyses
Studies that assessed fat mass
Berkowitz et al. 34 High risk Fat mass (kg) at age 4 years, mean (SD) 3.7 (1.6)
-Low risk 3.2 (0.8)
-High risk Fat mass (kg) at 6 years, mean (SD)/β (SE) 6.7 (5.7) 0.3 (0.1) *
Low risk 3.8 (1.2) * Reference
Sewell et al. 29 < 25kg/m² Fat mass (g) at 72 hours, mean (SD) 331 (179)
-≥ 25kg/m² 406 (221) *
-Burdette et al. 35 ≥ 30kg/m² Fat mass (kg) at 5 years, mean (SD)/β (95%CI) 5.0 (0.2) 0.5 (0.02; 0.9)
< 30kg/m² 4.5 (0.1) * Reference
Gale et al. 28 kg/m² FMI (SDS) at 9 years, male, β (95%CI) 0.2 (-0.04; 0.4) 0.3 (0.04; 0.5) FMI (SDS) at 9 years, female β (95%CI) 0.4 (0.3; 0.5) 0.4 (0.3; 0.6) Lawlor et al. 38 SD Fat mass (z-score) at 9-11 years,
mean *** (95%CI)
0.3 (0.2; 0.3) 0.3 (0.2; 0.3)
Hull et al. 5 < 25kg/m² Fat mass (g) at 35 days, mean (SD) 414.1 (264.2)
-≥ 25kg/m² 448.3 (262.2) *
-25-30kg/m² 450.9 (216.3)
-> 30kg/m² 489.6 (158.7)
-Carlsen at al. 32 18-24kg/m² Fat mass (g) at 48 hours, mean (SD)/β (95%CI) 331 (163) * Reference
≥ 30kg/m² 443 (212) 135 (85; 186)
Pereira-da-Silva et al. 40
kg/m² Fat mass (kg), at 72 hours, β 0.1
-≥ 25kg/m² Fat mass (kg), at 72 hours, β (95%CI) 0.5 0.1 (0.03; 0.2) *,***
Tanvig et al. 39 18-24kg/m² Fat mass (kg) at 2.5-3 years, mean (95%CI) 2.3 (2.1; 2.5)
-≥ 30kg/m² 2.4 (2.2; 2.7)
-Perng et al. 30 per 5kg/m² Fat mass (kg) at 6-10 years, β (95%CI) 0.9 (0.7; 1.1) Shapiro et al. 33 < 25kg/m² Fat mass (g) at 48 hours, mean (SD) 280.5 (143.2)
-25-29kg/m² 306.7 (151.9)
-≥ 30kg/m² 332.6 (159.6)
-Starling et al. 37 kg/m² Fat mass (g) at 3 days, β (95%CI) 5.2 (3.5; 6.9) Castillo et al. 31 kg/m² Fat mass (kg) at 6 years, β (95%CI) 0.02 (0.1; 0.2) 0.1 (0.03; 0.2)
kg/m² FMI (kg/m²) at 6 years, β (95%CI) 0.1 (0.1; 0.1) 0.07 (0.02; 0.1) < 18.5kg/m² Fat mass (kg) at 6 years, mean (SD) 4.5 (1.9) **
18.5-24kg/m² 5.9 (3.2)
25-29kg/m² 6.9 (4.0)
≥ 30kg/m² FMI (kg/m²) at 6 years, mean (SD) 8.0 (5.2)
< 18.5kg/m² 3.1 (1.2) **
18.5-24kg/m² 4.0 (2.0)
25-29kg/m² 4.5 (2.4)
≥ 30kg/m² 5.3 (3.0)
(continues)
al inspection of the forest plot of studies included in the review, a finding that was supported by sta-tistical evidence. Seeking for causes in the stud-ies’ descriptions, although the eligibility criteria in the seven studies were similar, there was het-erogeneity due to variation in the study sample
Table 2 (continued)
Author Maternal exposure (pre-gestational BMI)
Offspring outcome/Measures of effect Crude analyses Adjusted analyses
Studies that assessed lean mass or fat-free mass
Berkowitz et al. 34 High risk Lean mass (kg) at 4 years, mean (SD) 13.1 (1.5)
-Low risk 12.2 (0.9) *
-High risk Lean mass (kg) at 6 years, mean (SD) 16.7 (1.9)
-Low risk 15.6 (1.3) *
-Sewell et al. 29
< 25kg/m² Fat-free mass (g) at 72 hours, mean (SD) 2951 (406)
-≥ 25kg/m² 3023 (410)
-Gale et al. 28 kg/m² LMI (SDS) at 9 years, male, β (95%CI) 0.2 (0.04; 0.4) 0.2 (-0.02; 0.4) LMI (SDS), at 9 years, female, β (95%CI) 0.2 (-0.1; 0.3) 0.1 (-0.1; 0.3) Lawlor et al. 38 SD Lean mass (z-score) at 9-11 years,
mean *** (95% CI)
0.1 (0.1; 0.1) 0.1 (0.1; 0.1)
Hull et al. 5 < 25kg/m² Fat-free mass (g) at 35 days, mean (SD) 3,310.5 (344.6)
-≥ 25kg/m² 3,162.2 (313.4) *
-Hull et al. 6 < 25kg/m² Fat-free mass (g) at 24-48 hours, mean (SD) 2,826.5 (330.4)
-25-30kg/m² 2,903.3 (407.4)
-> 30kg/m² 2,833.6 (332.1)
-Carlsen et al. 32 18-24kg/m² Fat-free mass (g) at 48 hours, mean (SD)/β (95%CI)
3,322 (371) Reference
≥ 30kg/m² 3,332 (487) 28 (-69; 125)
Tanvig et al. 39 18-24kg/m² Fat-free mass (kg) at 2.5-3 years, mean (95%CI) 10.9 (10.6; 11.2)
-≥ 30kg/m² 11.2 (10.8; 11.7)
-Pereira-da-Silva et al. 40
kg/m² Fat-free mass (kg), at 72 hours, β 0.01
-≥ 25kg/m² Fat-free mass (kg), at 72 hours, β (95%CI) 0.01 0.3 (0.1; 0.4) *,***
Shapiro et al. 33 < 25kg/m² Fat-free mass (g) at 48 hours, mean (SD) 2,830.7 (324.8)
-25-29kg/m² 2,877.0 (366.7)
-≥ 30kg/m² 2,853.3 (33.8)
-Starling et al. 37 kg/m² Fat-free mass (g) at 3 days, β (95%CI) 7.7 (4.5; 10.9)
Castillo et al. 31 kg/m² Fat-free mass (kg) at 6 years, β (95%CI) 0.1 (0.1; 0.14) 0.13 (0.11; 0.2)
kg/m² FFMI (kg/m2) at 6 years, β (95%CI) 0.05 (0.04; 0.1) 0.06 (0.05; 0.1)
< 18.5kg/m² Fat-free mass (kg) at 6 years, mean (SD) 17.3 (2.3) **
18.5-24kg/m² 18.5 (2.7)
25-29kg/m² 19.3 (2.9)
≥ 30kg/m² 19.6 (3.3)
< 18.5kg/m² FFMI (kg/m2) at 6 years, mean (SD) 12.1 (1.0) **
18.5-24kg/m² 12.6 (1.1)
25-29kg/m² 12.8 (1.1)
≥ 30kg/m² 13.2 (1.3)
95%CI: 95% confidence interval; β: beta coefficient; BMI: body mass index; FFMI: fat free mass index; FMI: fat mass index (kg/m2); LMI: lean mass index
(kg/m2); SD: standard deviation; SE: standard error; SDS: standard deviation score; OR: odds ratio.
Note: high risk group: pre-gestational BMI greater than the 66th percentile or lower than the 33rd percentile;
* p-value: statistically significant; ** Mean difference;
Figure 2
Standardized mean differences in infant body composition by mother pre-pregnancy body mass index (BMI) group, 2015.
Note: weight are from random effects analysis.
and adjusted analysis). The joint test for all five covariates provided a p-value = 0.63, indicating no evidence for an association of at least one of the covariates with the size of the pre-pregnancy effect on offspring fat-free mass. A high residual heterogeneity was maintained in the subgroup analyses with an exception of outcome age mea-surement: SMD = 0.12 (95%CI: -0.03; 0.27), I2 =
0.00% in studies with < 1 week outcome age mea-surement and SMD = 0.27 (95%CI: -0.03; 0.57), I2 =
91.2% in studies with outcome age measurement
≥ 1 week.
In summary, whilst some studies report a pos-itive association between maternal pre-pregnan-cy BMI and the body fat of children, the outcomes have been variably assessed in terms of body fat percent, fat mass or FMI. Therefore it is clear that the majority of studies assessed the relation-ship between pre-pregnancy BMI and the off-spring’s body composition in terms of childhood adiposity rather than the fat-free component.
Studies that assessed the effect of gestational weight gain
Ten studies assessed the relationship between gestational weight gain and offspring body composition 6,27,28,29,30,31,41,42,43,44 Four studies 31,41,42,44 assessed gestational weight gain
accord-ing to pre-pregnancy BMI and divided it into categories as recommended by the Institute of Medicine of the U.S. National Academy of Sci-ences 45. Sewell et al. 29 applied a pre-pregnancy
BMI cut-off ≥ 25kg/m2. Seven studies assessed
gestational weight gain as a continuous variable
6,27,28,30,31,37,42. Six studies measured body
com-position in newborns 6,27,29,41,42,44, one in
chil-dren under a year in age 43 and five in children
from 3-10 years of age 28,30,31,42,43.
• Maternalgestationalweightgainand
offspring adiposity
The relationship between gestational weight gain and body fat percent was evaluated in seven studies 6,27,29,31,37,41,44, fat mass in nine 6,29,32,36,37,39,40,41,43, and FMI in two 28,31 (Table
3). Five studies reported a statistically significant positive effect of gestational weight gain on body fat percent in univariate analysis 6,29,31,41,44 and
three studies 27,31,37 reported a positive effect
be-tween gestational weight gain and body fat per-cent in the multivariate analysis. In addition, a significant direct association between gestation-al weight gain and fat mass was found following univariate analysis in four studies 6,31,41,42.
• Maternalgestationalweightgainand
offspring lean mass or fat-free mass
The relationship of maternal gestational weight gain and fat-free mass was evaluated in seven studies 6,31,37,41,42,43,44 and between maternal
gestational weight gain and LMI or FFMI (fat free mass index) in two 28,31 (Table 3). A positive
ef-fect of gestational weight gain on fat-free mass was reported in six studies 6,29,31,41,42,44,and this
association was statistically significant in three of them 6,29,31. Gale et al. 28 however reported an
inverse association of gestational weight gain on LMI.
The crude analyses of the studies that catego-rized gestational weight gain according to mater-nal pre-pregnancy BMI showed that children of overweight or obese mothers, with an adequate or excessive gestational weight gain were more likely to have a high fat mass 6,29,31,41,42,43, body
fat percent 6,29,31,41,44, and FFMI 28,31 compared
to newborns of mothers with normal maternal pre-pregnancy BMI with adequate or excessive weight gain (Table 3).
Discussion
This review suggests that children born from mothers with normal maternal pre-pregnancy BMI have lower fat mass and body fat percent than those born from overweight or obese moth-ers 27,28,31,32,34,35,36,37,40. The aggregate measure
estimated a significantly small difference in mean fat mass and body fat percent in the first months of life between children of overweight or obese mothers and those from mothers with normal maternal pre-pregnancy BMI. The visual inspec-tion of the forest plot showed that effect size and direction of associations described by Hull et al. 5
and Tanvig et al. 39 are clearly different. In fact the
sample size of the studies can explain such a dis-crepancy, since both studies have less than 100 participants. There was a significant difference in terms of fat-free mass; random-effects model of meta-analysis shows a significant association of maternal pre-pregnancy BMI and offspring fat mass, body fat percent and fat-free mass. The da-tabases included studies conducted in high and middle income countries, so the meta-analysis lacks information from low income countries populations. An aggregate analysis of gestational weight gain and fat mass, body fat percent or fat-free mass could not be performed.
Table 3
Maternal gestational weight gain and offspring body composition in childhood.
Author Maternal exposure Offspring outcome Crude analyses Adjusted analyses
Studies that assessed body fat percent
Hull et al. 6 Gestational weight gain (kg) Body fat % (percentage point) at 24-48 hours, mean (SD)
12.3 (4.4)
-Pre-gestational weight BMI 18-24kg/m2/Gestational weight gain
Body fat % (percentage point) at 24-48 hours, mean (SD)
11.7 (4.1)
Adequade 11.2 (0.5)
Excessive 11.8 (0.5)
Pre-gestational weight BMI 25-29kg/m2/Gestational weight gain
13.0 (4.7)
-Adequade - 9.2 (1.1)
Excessive - 13.7 (0.7)
Pre-gestational weight BMI ≥ 30kg/m2/Gestational weight gain
14.6 (4.3)
Adequade - 14.6 (1.4)
Excessive - 14.2 (0.8)
Josefson et al. 41 Gestational weight gain
Adequate Body fat % (percentage point) at 72 hours, mean (SD)
10.7 (2.8)
-Excessive 13.9 (3.3)
-Henriksson et al. 44 Gestational weight gain
Inadequate Body fat % (percentage point) at 2-11 days, mean (SD)
11.1 (4.1)
-Adequate 11.9 (4.1)
-Excessive 13.0 (3.8)
-Sewell et al. 29 Gestational weight gain
(lb)/Pre-gestational BMI ≥ 25kg/m²
Body fat % (percentage point) at 72 hours, r
0.4
-Au et al. 27 Gestational weight gain (kg) Difference in body fat %, β (95%CI) 0.1 (0.1; 0.2)
Starling et al. 37 Gestational weight gain (kg) Body fat % (percentage point) at 3 days, β (95%CI)
0.6 (0.4; 0.7)
Castillo et al. 31 Gestational weight gain (kg) Body fat % (percentage ppoint) at 6 years, β (95%CI)
0.16 (0.12; 0.21) 0.18 (0.13; 0.23)
Insufficient Body fat % (percentage point) at 6 years, mean (SD)
22.1 (7.4)
Sufficient 23.5 (7.8)
Excessive 25.4 (8.5)
(continues)
only 20 articles met the inclusion criteria for this review, of which ten assessed the maternal pre-pregnancy BMI, four the gestational weight gain and six both exposures. No studies with negative results were found. Therefore, publication bias can be present 46. In addition, studies assessing
children’s body composition by indirect meth-ods conducted in low-income countries were not found in the literature search.
Several methodological aspects of the stud-ies reviewed require consideration. Firstly, four
studies used pre-pregnancy BMI or gestational weight gain information as determined by ma-ternal weight data from medical records. Two studies used maternal weight measurements and four studies relied upon self-reported maternal weight information allowing for recall bias. In-deed, studies that evaluated the accuracy of self-reported maternal weight found that women underestimated their own weight 47 which may
categori-Table 3 (continued)
Author Maternal exposure Offspring outcome Crude analyses Adjusted analyses
Studies that assessed fat mass
Crozier et al. 42 Gestational weight gain (kg) Fat mass (kg²), β (95%CI)
At birth 0.1 (0.0; 0.1) -At 4 years -0.01 (-0.1; 0.1) 0.0 (-0.1; 0.1) At 6 years 0.1 (-0.0; 0.1) 0.1 (-0.0; 0.1) Gestational weight gain
Inadequate Fat mass (kg²) at birth, β (95%CI) -0.1 (-0.3; 0.1) -0.1 (-0.3; 0.1) Excessive 0.1 (-0.0; 0.3) 0.2 (0.0; 0.3) Inadequate Fata mass (kg²) at 4 years, β (95%CI) 0.2 (-0.1; 0.4) 0.2 (-0.1; 0.4) Excessive 0.2 (0.0; 0.4) 0.1 (-0.0; 0.3) Inadequate Fat mass (kg²) at 6 years, β (95%CI) 0.2 (-0.1; 0.4) 0.2 (-0.1; 0.4) Excessive 0.4 (0.2; 0.5) 0.3 (0.1; 0.5) Gale et al. 28 Gestational weight gain (kg), SDS FMI (SDS) male, β (95%CI) 0.1 (-0.1; 0.3) 0.1 (-0.1; 0.3)
FMI (SDS) female, β (95%CI) 0.01 (-0.2; 0.2) 0.1 (-0.0; 0.3) Henriksson et al. 44 Gestational weight gain
Inadequate Fat mass (g) at 2-11 days, β (95%CI) -54 (-111; 4) -30 (-78; 18)
Excessive 55 (10; 100) 37 (-1; 75)
Perng et al. 30 Gestational weight gain BMI per
5kg/m2 Fat mass (kg) at 6-10 years, β (95%CI) 0.3 (0.1; 0.5)
Hull et al. 6 Gestational weight gain (kg) Fat mass (g) at 24-48 hours, mean (SD) 408.5 (179.7)
-Pre-gestational BMI 18-24kg/m2/ Gestational weight gain
Fat mass (g) at 24-48 hours, mean (SD) 382.4 (165.7)
Adequade - 355.5 (20.1)
Excessive - 388.90 (21.9)
Pre-gestational BMI 25-29kg/m2/ Gestational weight gain
450.9 (216.3)
-Adequade - 303.6 (46.1)
Excessive - 484.40 (28.8)
Pre-gestational BMI ≥ 30kg/m2/
Gestational weight gain
489.6 (158.7)
Adequade 472.9 (56.0)
Excessive 486.40 (33.5)
Josefson et al. 41 Gestational weight gain
Sufficient Fat mass (g) at 72 hours, mean (SD) 348 (103)
-Excessive 525 (178)
-Henriksson et al. 44 Gestational weight gain
Inadequate Fat mass (g) at 2-11 days, mean (SD) 384 (178)
-Sufficient 438 (186)
-Excessive 493 (177)
-Sewell et al. 29 Gestational weight gain (lb)/ Maternal pre-gestational BMI < 25kg/m²
Fat mass (g) at 72 hours, r 0.12*
-Estampador et al. 43 Gestational weight gain
Midpregnancy Fat mass (z-score) at 4 months, r (95%CI) 0.4 (0.04; 0.7) *
-Late-pregnancy -0.02 (-0.4; 0.7)
-Starling et al. 37 Gestational weight gain (kg) Fat mass (g) at 3 days, β ( 95%CI) 24.0 (17.4; 30.5)
Table 3 (continued)
Author Maternal exposure Offspring outcome Crude analyses Adjusted analyses
Studies that assessed fat mass
Castillo et al. 31 Gestational weight gain (kg) Fat mass (kg) at 6 years, ß (95%CI) 0.08 (0.06; 0.10) 0.08 (0.06; 0.11)
Gestational weight gain (kg) FMI (kg/m2) at 6 years, ß (95%CI) 0.04 (0.03; 0.06) 0.05 (0.04; 0.06)
Gestational weight gain
Insufficient Fat mass (kg) at 6 years, mean (SD) 5.5 (3.1)
Sufficient 6.1 (3.5)
Excessive 7.2 (4.3)
Insufficient FMI (kg/m2) at 6 years, mean (SD) 3.8 (2.0)
Sufficient 4.1 (2.1)
Excessive 4.7 (2.5)
Studies that assessed fat-free mass or lean mass
Crozier et al. 42 Gestational weight gain (kg) Fat-free mass (kg), ß (95%CI)
at birth 0.01 (-0.03; 0.1)
-at 4 years 0.01 (-0.03; 0.1) 0.04 (-0.01; 0.1) at 6 years -0.01 (-0.1; 0.04) -0.01 (-0.1; 0.1) Gestational weight gain
Inadequate Fat-free mass (kg) at birth, ß (95%CI) -0.03 (-0.2; 0.1) -0.04 (-0.2; 0.1) Excessive 0.02 (-0.1; 0.1) 0.1 (-0.1; 0.2) Inadequate Fat-free mass (kg) at 4 years, ß (95%CI) 0.1 (-0.1; 0.2) 0.2 (-0.1; 0.4) Excessive 0.1 (-0.1; 0.2) 0.1 (-0.03; 0.3) Inadequate Fat-free mass (kg) at 6 years, ß (95%CI) 0.1 (-0.1; 0.2) 0.03 (-0.1; 0.2) Excessive 0.1 (-0.1; 0.2) 0.03 (-0.1; 0.2) Gale et al. 28 Gestational weight gain (kg), SDS LMI (SDS)
Male ß (95%CI) -0.1 (-0.2; 0.1) -0.1 (-0.2; 0.1) Female ß (95%CI) -0.02 (-0.2; 0.2) 0.01 (-0.2; 0.2) Henriksson et al. 44 Gestational weight gain
Inadequate Fat-free mass (g) at 2-11 days, ß (95%CI) -152 (-263; -41) -13 (-77; 51)
Excessive 101 (15; 187) 39 (-12; 89)
Hull et al. 6 Gestational weight gain (kg) Fat-free mass (g) at 24-48 hours, mean (SD)
2,842.2 (346.8)
-Pre-gestational BMI 18-24kg/m²/ Gestational weight gain
Fat-free mass (g) at 24-48 hours, mean (SD)
2,826.5 (330.4)
-Adequade - 2758.7 (32.8)
Excessive - 2856.60 (35.7)
Pre-gestational BMI 25-29kg/m²/ Gestational weight gain
2,903.3 (407.4)
Adequade 2839.7 (75.3)
Excessive 2968.80 (47.0)
Pre-gestational BMI 30kg/m²/ Gestational weight gain
2,833.6 (332.1)
Adequade - 2792.5 (91.5)
Excessive - 2913.20 (54.7)
Josefson et al. 41 Gestational weight gain
Sufficient Fat-free mass (g), at 72 hours, mean (SD) 2,898 (327)
-Excessive 3,174 (415)
zation of pregnant women, indicating exposure bias 46,48.
Secondly, the recent publication period of the 20 articles (between 2005 and 2015) is probably due to the outcomes definition employed. Pre-viously validated studies of DEXA and ADP are available in the literature from 1980 to 1990, res-pectively. These are however, costly equipment that require operation by trained personnel and constant maintenance.
Thirdly, a lack of homogeneity in maternal pre-pregnancy BMI categorization in two or more groups using different cutoffs was found in the literature search 5,6,27,29,32,33,35,39,40. Lack of
definition of cutoff points 34,38 was also observed.
These may have unpredictably underestimated or overestimated the effect of maternal pre-preg-nancy BMI and gestational weight gain on off-spring body composition.
Fourth, confounding variables showed a wide heterogeneity. Child’s age, gender and breast-feeding were not investigated as potential effect modifiers, and some studies included these vari-ables in the multivariate analysis. A single study included an analysis stratified by gender 28 and
two others investigated current children’s weight as an effect modifier 28,34.
Fifth, few studies included socioeconomic characteristics as confounding variables in the adjusted analysis. However, the effect of envi-ronmental factors was present in the four studies that adjusted for family income, education level, race, and maternal smoking during pregnancy
31,34,35,38 strengthening the association (negative
confounding) 49. The history of maternal
smok-ing dursmok-ing pregnancy was considered in the ad-justed analysis of eight studies 28,29,31,32,35,38,42,44.
The maternal smoking during pregnancy is a Table 3 (continued)
Author Maternal exposure Offspring outcome Crude analyses Adjusted analyses
Studies that assessed fat-free mass or lean mass
Henriksson et al. 44 Gestational weight gain
Inadequate Fat-free mass (g), at 2-11 days, mean (SD)
2,986 (343)
-Sufficient 3,138 (328)
-Excessive 3,239 (364)
-Sewell et al. 29 Gestational weight gain (lb)/
Maternal pre-gestational BMI
< 25kg/m² Fat-free mass (g) at 72 hours, r 0.20 0.19
≥ 25kg/m² 0.08
-Estampador et al. 43 Gestational weight gain
Mid-pregnancy Fat-free mass (z-score) at 4 months, r (95%CI)
0.1 (-0.3; 0.4) *
-Late-pregnancy 0.4 (0.01; 0.6)
-Starting et al. 37 Gestational weight gain (kg) Fat-free mass (g) at 3 days, ß (95%CI) 34.0 (21.4; 46.6)
Castillo et al. 31
Gestational weight gain (kg) Fat-free mass (kg) at 6 years, ß (95%CI) 0.06 (0.04; 0.07) 0.04 (0.02; 0.05) Gestational weight gain (kg) FFMI (kg/m2) at 6 years, ß (95%CI) 0.01 (0.006; 0.02) 0.01 (0.01; 0.02)
Insufficient 18.2 (2.7)
Sufficient 18.7 (2.8)
Excessive Fat-free mass (kg) at 6 years, mean (SD) 19.3 (3.0)
Insufficient 12.6 (1.1)
Sufficient 12.7 (1.1)
Excessive FFMI (kg/m2) at 6 years, mean (SD) 13.0 (1.2)
95% CI: 95% confidence interval; ß: beta coefficient; BMI: body mass index; FFMI: fat-free mass index; FMI: fat mass index (kg/m2); LBMI: lean body mass
index (kg/m2); r = correlation; SD: standard deviation; SDS: standard deviation score; SE: standard error.
well-known cause of growth restriction and low birth-weight and recent studies also suggested that pre-natal smoking compromises infant growth 2,21,49. The mechanism underlying this
as-sociation is unknown. Some speculate that this association may result from confounding. Moth-ers who smoke during pregnancy may provide a different social environment for the offspring than mothers who do not smoke 21,42.
On the other hand, the inclusion of current child characteristics such as height, weight, conditional weight gain or birth weight as con-founding variables seems to be inappropriate
28,34,35,36,38. These variables would more likely
have a mediating rather than a confounding ef-fect on the relationship between pre-pregnancy BMI and gestational weight gain with offspring body composition 48,50.
Different studies have reported a positive association between maternal pre-pregnancy BMI and the weight of children born at full term
11,13,29. Since the first study on the relationship
between children’s body composition and ma-ternal pre-pregnancy BMI or gestational weight gain as the exposure published in 2001 7,
evi-dence shows that the incievi-dence of newborns weighing more than 4,000g at birth increases as pre-pregnancy BMI shifts from normal to obesi-ty 51. Due to the availability of indirect methods
for body composition the fat mass and fat-free mass arose as new components of birth weight. Studies 5,6,29 have reported that in full-term
newborns, fat-free mass accounts for 70-87% of the variation in birth weight. In the relation-ship of pre-pregnancy BMI with children’s body composition born at full-term to overweight/ obese mothers, fat-free mass accounts for 61-75% variation on birth weight while it accounts for 74-89% variation in those who are born from mothers with normal pre-pregnancy BMI 5,6,29.
Thus, an increase in birth weight that is associ-ated with maternal pre-pregnancy BMI may be primarily attributed to an increase in FM rather than fat-free mass 29.
Gale et al. 28 and Castillo et al. 31 were the
studies that provided data on FMI, FFMI and LMI. Children can have different percentages of fat mass due to different absolute amounts of fat mass but equivalent amounts of fat-free mass or different absolute amounts of fat-free mass and same amounts of fat mass. Because of these re-lations the normalization of fat mass and lean mass measures for squared height (kg/m²) is rec-ommended to improve the sensitivity to detect changes in body composition measurements 23.
Fetal over-nutrition hypothesis is one mecha-nism that has been suggested to explain the rela-tionship between maternal pre-pregnancy BMI
and gestational body composition and offspring body composition. So the relationship between maternal gestational obesity and offspring obe-sity could be explained by the effect of the expo-sure to high maternal plasma glucose, free fatty acid and amino acids concentration during preg-nancy carrying lifelong changes in fetal appetite, neuroendocrine function or energy metabolism and an increased risk for metabolic and cardio-vascular diseases after birth 1,4.
Studies on intergenerational heritability with family members suggest a role of genetic factors in determining individual differences in adipos-ity 52. Therefore, a variant of the fat mass and
obesity associated gene in homozygous individu-als appears to increase the risk of obesity, when compared to individuals without the allele. The same is seen for fat mass in children 53. Lawlor
et al. 38 investigated the effect of pre-pregnancy
BMI on adiposity in children aged 9-11 years and found that the effect of maternal pre-pregnancy BMI and of the fat mass and obesity associated gene on children FM lost statistical significance after adjusting for child’s fat mass and obesity as-sociated as an instrumental variable. The mecha-nisms involved in the association of the fat mass and obesity associated gene and the high adipos-ity are still unclear.
From a perspective of disease prevention and health promotion, maternal obesity is a poten-tially preventable cause to reduce the disease and mortality burden in childhood. Yet prenatal counseling should be cautious when advising overweight or obese women to optimize their weight before pregnancy. McDonald et al. 49
ar-gued that maternal overweight/obesity may have a beneficial effect on the survival of children born with low birth weight in low-income countries despite the increased risk of preterm birth in this group.
Resumo
Esta revisão avaliou a associação entre o índice de massa corporal (IMC) pré-gestacional e/ou ganho de peso gestacional com a composição corporal dos filhos na infância. Uma revisão sistemática foi realizada. Estudos de coorte, caso-controle e ensaios randomi-zados, que determinaram a composição corporal dos filhos mediante métodos indiretos, foram incluídos. Meta-análises do efeito do IMC pré-gestacional sobre a massa livre de gordura, percentual de gordura corpo-ral e massa gorda foram realizados. Incluiu-se 18 estu-dos, a maioria dos quais reportou associação positiva entre o IMC materno pré-gestacional e adiposidade dos filhos. As diferenças de médias padronizadas de percentual de gordura corporal, massa gorda e mas-sa livre de gordura entre filhos de mulheres com IMC pré-gestacional normal em comparação com os de mulheres com sobrepeso/obesidade foram: 0,31 pontos percentuais (IC95%: 0,19; 0,42), 0,38kg (IC95%: 0,26; 0,50) e 0,18kg (IC95%: -0,07; 0,42), respectivamente. Esta evidência sugere que o sobrepeso materno pré--gestacional está associado com a elevada adiposidade em seus filhos.
Obesidade; Gravidez; Composição Corporal; Adiposidade
Contributors
H. Castillo-Laura. and I. S. Santos conceived the paper, conducted the analysis and wrote the manuscript. L. C. M. Quadros and A. Matijasevich contributed to the design of the study. All authors revised and approved the final version of the paper for publication.
Acknowledgments
We would like to thank the following organizations for their support in the production of knowledge for this study: Postgraduate Program in Epidemiology at the Pelotas Federal University and Wellcome Trust.
References
1. Symonds ME, Mendez MA, Meltzer HM, Koletzko B, Godfrey K, Forsyth S, et al. Early life nutrition-al programming of obesity: mother-child cohort studies. Ann Nutr Metab 2013; 62:137-45.
2. Kramer MS. Determinants of low birth weight: methodological assessment and meta-analysis. Ann Nutr Metab 1987; 65:663-737.
3. Schlussel MM, Souza EB, Reichenheim ME, Kac G. Physical activity during pregnancy and maternal-child health outcomes: a systematic literature re-view. Cad Saúde Pública 2008; 24 Suppl 4:531-44. 4. Armitage JA, Poston L, Taylor PD. Developmental
origins of obesity and the metabolic syndrome: the role of maternal obesity. Front Horm Res 2008; 36:73-84.
5. Hull HR, Dinger MK, Knehans AW, Thompson DM, Fields DA. Impact of maternal body mass index on neonate birthweight and body composition. Am J Obstet Gynecol 2008; 198:416.e1-6.
6. Hull HR, Thornton JC, Ji Y, Paley C, Rosenn B, Mathews P, et al. Higher infant body fat with exces-sive gestational weight gain in overweight women. Am J Obstet Gynecol 2011; 205:211.e1-7.
7. Laitinen J, Power C, Jarvelin MR. Family social class, maternal body mass index, childhood body mass index, and age at menarche as predictors of adult obesity. Am J Clin Nutr 2001; 74:287-94. 8. Tequeanes AL, Gigante DP, Assuncao MC, Chica
DA, Horta BL. Maternal anthropometry is associ-ated with the body mass index and waist:height ratio of offspring at 23 years of age. J Nutr 2009; 139:750-4.
9. Ehrenberg HM, Dierker L, Milluzzi C, Mercer BM. Prevalence of maternal obesity in an urban center. Am J Obstet Gynecol 2002; 187:1189-93.
10. Lu GC, Rouse DJ, DuBard M, Cliver S, Kimberlin D, Hauth JC. The effect of the increasing prevalence of maternal obesity on perinatal morbidity. Am J Obstet Gynecol 2001; 185:845-9.
11. Ehrenberg HM, Mercer BM, Catalano PM. The influence of obesity and diabetes on the preva-lence of macrosomia. Am J Obstet Gynecol 2004; 191:964-8.
12. Jensen DM, Damm P, Sorensen B, Molsted-Peder-sen L, Westergaard JG, OveMolsted-Peder-sen P, et al. Pregnancy outcome and prepregnancy body mass index in 2459 glucose-tolerant Danish women. Am J Obstet Gynecol 2003; 189:239-44.
13. Surkan PJ, Hsieh CC, Johansson AL, Dickman PW, Cnattingius S. Reasons for increasing trends in large for gestational age births. Obstet Gynecol 2004; 104:720-6.
14. Ogden CL, Carroll MD, Curtin LR, McDowell MA, Tabak CJ, Flegal KM. Prevalence of overweight and obesity in the United States, 1999-2004. JAMA 2006; 295:1549-55.
15. Boney CM, Verma A, Tucker R, Vohr BR. Metabolic syndrome in childhood: association with birth weight, maternal obesity, and gestational diabetes mellitus. Pediatrics 2005; 115:290-6.
17. Mamun AA, O'Callaghan M, Callaway L, Williams G, Najman J, Lawlor DA. Associations of gestation-al weight gain with offspring body mass index and blood pressure at 21 years of age: evidence from a birth cohort study. Circulation 2009; 119:1720-7. 18. Moreira P, Padez C, Mourão-Carvalhal I, Rosado V.
Maternal weight gain during pregnancy and over-weight in Portuguese children. Int J Obes (Lond) 2007; 31:608-14.
19. Oken E, Taveras EM, Kleinman KP, Rich-Edwards JW, Gillman MW. Gestational weight gain and child adiposity at age 3 years. Am J Obstet Gynecol 2007; 196:322.e1-8.
20. Catalano PM, Drago NM, Amini SB. Maternal car-bohydrate metabolism and its relationship to fetal growth and body composition. Am J Obstet Gyne-col 1995; 172:1464-70.
21. Koupil I, Toivanen P. Social and early-life deter-minants of overweight and obesity in 18-year-old Swedish men. Int J Obes (Lond) 2008; 32:73-81. 22. Stuebe AM, Forman MR, Michels KB.
Maternal-recalled gestational weight gain, pre-pregnancy body mass index, and obesity in the daughter. Int J Obes (Lond) 2009; 33:743-52.
23. Wells JC, Fuller NJ, Dewit O, Fewtrell MS, Elia M, Cole TJ. Four-component model of body composi-tion in children: density and hydracomposi-tion of fat-free mass and comparison with simpler models. Am J Clin Nutr 1999; 69:904-12.
24. Wells JC, Fewtrell MS. Measuring body composi-tion. Arch Dis Child 2006; 91:612-7.
25. Moher D, Liberati A, Tetzlaff J, Altman DG, Group P. Preferred reporting items for systematic reviews and meta-analyses: the PRISMA statement. PLoS Med 2009; 6:e1000097.
26. Downs SH, Black N. The feasibility of creating a checklist for the assessment of the methodological quality both of randomised and non-randomised studies of health care interventions. J Epidemiol Community Health 1998; 52:377-84.
27. Au CP, Raynes-Greenow CH, Turner RM, Carberry AE, Jeffery H. Fetal and maternal factors associ-ated with neonatal adiposity as measured by air displacement plethysmography: a large cross-sec-tional study. Early Hum Dev 2013; 89:839-43. 28. Gale CR, Javaid MK, Robinson SM, Law CM,
God-frey KM, Cooper C. Maternal size in pregnancy and body composition in children. J Clin Endocrinol Metab 2007; 92:3904-11.
29. Sewell MF, Huston-Presley L, Super DM, Catala-no P. Increased neonatal fat mass, Catala-not lean body mass, is associated with maternal obesity. Am J Obstet Gynecol 2006; 195:1100-3.
30. Perng W, Gillman MW, Mantzoros CS, Oken E. A prospective study of maternal prenatal weight and offspring cardiometabolic health in midchild-hood. Ann Epidemiol 2014; 24:793-800.
31. Castillo H, Santos IS, Matijasevich A. Relationship between maternal pre-pregnancy body mass in-dex, gestational weight gain and childhood fatness at 6-7 years by air displacement plethysmography. Matern Child Nutr 2015; 11:606-17.
32. Carlsen EM, Renault KM, Norgaard K, Nilas L, Jen-sen JE, Hyldstrup L, et al. Newborn regional body composition is influenced by maternal obesity, gestational weight gain and the birthweight stan-dard score. Acta Paediatr 2014; 103:939-45. 33. Shapiro AL, Schmiege SJ, Brinton JT, Glueck D,
Crume TL, Friedman JE, et al. Testing the fuel-me-diated hypothesis: maternal insulin resistance and glucose mediate the association between maternal and neonatal adiposity, the Healthy Start study. Diabetologia 2015; 58:937-41.
34. Berkowitz RI, Stallings VA, Maislin G, Stunkard AJ. Growth of children at high risk of obesity during the first 6 y of life: implications for prevention. Am J Clin Nutr 2005; 81:140-6.
35. Burdette HL, Whitaker RC, Hall WC, Daniels SR. Maternal infant-feeding style and children's adi-posity at 5 years of age. Arch Pediatr Adolesc Med 2006; 160:513-20.
36. Andres A, Hull HR, Shankar K, Casey PH, Cleves MA, Badger TM. Longitudinal body composition of children born to mothers with normal weight, overweight, and obesity. Obesity 2015; 23:1252-8. 37. Starling AP, Brinton JT, Glueck DH, Shapiro AL,
Harrod CS, Lynch AM, et al. Associations of mater-nal BMI and gestatiomater-nal weight gain with neonatal adiposity in the Healthy Start study. Am J Clin Nutr 2015; 101:302-9.
38. Lawlor DA, Timpson NJ, Harbord RM, Leary S, Ness A, McCarthy MI, et al. Exploring the develop-mental overnutrition hypothesis using parental-offspring associations and FTO as an instrumental variable. PLoS Med 2008; 5:33.
39. Tanvig M, Vinter CA, Jorgensen JS, Wehberg S, Ovesen PG, Lamont RF, et al. Anthropometrics and body composition by dual energy X-ray in children of obese women: a follow-up of a randomized con-trolled trial (the Lifestyle in Pregnancy and Off-spring [LiPO] study). PLoS One 2014; 9:89590. 40. Pereira-da-Silva L, Cabo C, Moreira AC, Virella D,
Guerra T, Camoes T, et al. The adjusted effect of maternal body mass index, energy and macronu-trient intakes during pregnancy, and gestational weight gain on body composition of full-term neo-nates. Am J Perinatol 2014; 31:875-82.
41. Josefson JL, Hoffmann JA, Metzger BE. Excessive weight gain in women with a normal pre-pregnan-cy BMI is associated with increased neonatal adi-posity. Pediatr Obes 2013; 8:e33-6.
42. Crozier SR, Inskip HM, Godfrey KM, Cooper C, Harvey NC, Cole ZA, et al. Weight gain in preg-nancy and childhood body composition: findings from the Southampton Women’s Survey. Am J Clin Nutr 2010; 91:1745-51.
44. Henriksson P, Eriksson B, Forsum E, Lof M. Ges-tational weight gain according to Institute of Medicine recommendations in relation to infant size and body composition. Pediatr Obes 2015; 10: 388-94.
45. Institute of Medicine; National Research Council. Weight gain during pregnancy: reexamining the Guidelines. Washington DC: National Academies Press; 2009.
46. Grimes DA, Schulz KF. Bias and causal associa-tions in observational research. Lancet 2002; 359: 248-52.
47. Engstrom JL, Paterson SA, Doherty A, Trabulsi M, Speer KL. Accuracy of self-reported height and weight in women: an integrative review of the literature. J Midwifery Womens Health 2003; 48: 338-45.
48. Greenland S, Robins JM. Confounding and mis-classification. Am J Epidemiol 1985; 122:495-506. 49. McDonald SD, Han Z, Mulla S, Beyene J;
Knowl-edge Synthesis Group. Overweight and obesity in mothers and risk of preterm birth and low birth weight infants: systematic review and meta-analy-ses. BMJ 2010; 341:c3428.
50. Christenfeld NJ, Sloan RP, Carroll D, Greenland S. Risk factors, confounding, and the illusion of sta-tistical control. Psychosom Med 2004; 66:868-75. 51. Weiss JL, Malone FD, Emig D, Ball RH, Nyberg DA,
Comstock CH, et al. Obesity, obstetric complica-tions and cesarean delivery rate: a population-based screening study. Am J Obstet Gynecol 2004; 190:1091-7.
52. Maes HH, Neale MC, Eaves LJ. Genetic and envi-ronmental factors in relative body weight and hu-man adiposity. Behav Genet 1997; 27:325-51. 53. Frayling TM, Timpson NJ, Weedon MN, Zeggini E,
Freathy RM, Lindgren CM, et al. A common vari-ant in the FTO gene is associated with body mass index and predisposes to childhood and adult obesity. Science 2007; 316:889-94.
Submitted on 28/Oct/2014