The Fulfillment of Parties’ Election Pledges: A Comparative Study on the Impact of Power Sharing
Running header: The Fulfillment of Parties’ Election Pledges
Key words: Mandate; election pledges; parties; platforms; manifestos.
Robert Thomson. [email protected]. School of Government and Public Policy, University of Strathclyde, 16 Richmond Street, Glasgow, G1 1XQ, UK.
Monash University, Melbourne, Australia, from July 2017.
Terry Royed. [email protected]. Department of Political Science, University of Alabama, Box 870213, Tuscaloosa, AL 35487, USA.
Elin Naurin. [email protected]. Department of Political Science, University of Gothenburg, Box 711, 405 30 Gothenburg, Sweden.
Joaquín Artés. [email protected]. Departmento de Economía Aplicada, Facultad de Derecho, Universidad Complutense Madrid, Av. Complutense S/N, Ciudad Universitaria, 28040 Madrid, Spain.
Rory Costello. [email protected]. Department of Politics and Public Administration, University of Limerick, Limerick, Ireland.
Laurenz Ennser-Jedenastik. [email protected]. Department of Government, University of Vienna, Rooseveltplatz 3, 1090 Vienna, Austria.
Mark Ferguson. [email protected]. 218 Pfeiffer Science Hall, Bennett College, Greensboro, NC 27401, USA.
Petia Kostadinova. [email protected]. Department of Political Science, University of Illinois at Chicago, 1102 Behavioral Science Building, 1007 W. Harrison Street, Chicago, IL 60607-7139, USA.
Catherine Moury. [email protected]. IPRI & Faculdade de Ciências Sociais e Humanas, Universidade Nova de Lisboa, (FCSH-NOVA), Av. De Berna, 26-C, 1069-061, Lisbon, Portugal.
François Pétry. [email protected]. Department of Political Science, Université Laval, 1030, av. Des Siences-Humaines, Québec, G1V OA6, Canada.
Katrin Praprotnik. [email protected]. Institute for Political Science, University of Hamburg, Allende-Platz 1, 20146 Hamburg, Germany.
Acknowledgements
We are grateful to all colleagues who offered constructive criticism and encouragement on this project and our individual country studies. We received particularly influential advice on this comparative study from Shaun Bowler, Michael Huelshoff, Michael McDonald, Bing Powell, Susan Stokes and Guy Whitten. We thank the editor of the AJPS and four anonymous referees for their insightful guidance throughout the review process. We thank Lucy Mansergh for making available most of our data on Ireland. We acknowledge financial support from the following sources: the Austrian Science Fund (FWF), grant S10903-G11 and S10903-G08; the Fonds de recherche du Québec-Société et culture (FRQSC); FCT- Fundação para Ciência e a Tecnologia
(PTDC/CPJ-CPO/111915/2009; PI: Catherine Moury); the German Research Foundation (DFG), project `Political Economy of Reforms‘ (SFB 884: C1); Spanish Ministry of Innovation (Grant CSO2013-40870-R); and the Swedish Research Council, Riksbankens
Jubileumsfond, the COFAS Marie Curie Fellowship Programme and the Multidisciplinary Opinion and Democracy Research Group at the University of Gothenburg.
Abstract
Why are some parties more likely than others to keep the promises they made during previous election campaigns? This study provides the first large-scale comparative analysis of pledge fulfillment with common definitions. We study the fulfillment of over 20,000 pledges made in 57 election campaigns in 12 countries, and our findings
challenge the common view of parties as promise breakers. Many parties that enter government executives are highly likely to fulfill their pledges, and significantly more so than parties that do not enter government executives. We explain variation in the
fulfillment of governing parties’ pledges by the extent to which parties share power in government. Parties in single-party executives, both with and without legislative majorities, have the highest fulfillment rates. Within coalition governments, the likelihood of pledge fulfillment is highest when the party receives the chief executive post and when another governing party made a similar pledge.
Replication Materials: The data, code, and any additional materials required to replicate all analyses in this article are available on the American Journal of Political Science Dataverse within the Harvard Dataverse, DRAFT VERSION,
UNF:6:MzE/0Bbi7bjwpdO0ZoFduQ== es", doi:10.7910/DVN/YJUIBI.
The fulfillment of election pledges is highly relevant to the theory and practice of representative democracy. If parties channel societal demands into government policies effectively, there should be a substantial level of congruence between the policy content of their election programs or manifestos and subsequent government policies. A strong program-to-policy linkage is central to the mandate theory of democracy and the
responsible party model (Downs 1957; Klingemann, Hofferbert and Budge 1994; Powell 2000; McDonald and Budge 2015). For Mansbridge (2003, 515), “the idea that during campaigns representatives made promises to constituents, which they then kept or failed to keep” is the focus of the traditional model of democratic representation, also known as “promissory representation”.
This topic also features prominently in political debate around the world.
Politicians often claim to hold a mandate to carry out their election platforms (Grossback, Peterson and Stimson 2005). Parties’ election programs and specific election pledges receive considerable media attention (Krukones 1984). The popular narrative is generally negative. In 31 of the 33 countries studied in an international survey, more respondents disagreed than agreed with the statement: “People we elect as MPs try to keep the promises they have made during the election” (ISSP 2008; see also Naurin 2011; Thomson 2011). Such skeptical views are by no means confined to uninformed mass opinion. Manin (1997, 180) writes: “even assuming that voters choose to pay some attention to the candidates’ promises, they know, or should know, that the credibility of those promises is an open question. It is not reasonable on their part to suppose that candidates will necessarily honor their commitments”. Our research examines whether and when such views reflect the reality of politics.
Parties’ election programs and the policy pledges they contain also have important intra and inter-party functions. Party leaders must respond to and represent factions to maintain internal support (Thomassen 1994, 256-8). Factions view their parties as vehicles through which they can attain political goals, and one way in which this can be done is to secure the party’s commitment to specific policies in its election pledges. Also, in the absence of detailed election programs, party leaders may be undisciplined. With reference to Latin American parties, Mainwaring and Scully (1995, 25) note: “Unfettered by party platforms, [political leaders] make policy choices that tend to be short-term and erratic. They are more prone to demagoguery and populism, both of which have deleterious effects on democracy”.
The inter-party function of election pledges is relevant in systems where power sharing is the norm. Coalition governments are typically formed after negotiations between prospective governing parties based on each party’s election program (Strøm, Müller and Bergman 2010). Parties’ campaign promises are relevant to government formation since they are clear statements of the policy positions with which parties enter these negotiations. In coalition governments, the extent to which each governing party’s policy proposals are turned into policies is a mark of its relative power in the coalition (Laver and Shepsle 1996, 42).
Our research on the fulfillment of election pledges complements the saliency approach to the mandate model, in which scholars focus on the relative emphases parties place on different policy themes (Robertson 1976; Budge, Robertson and Hearl 1987; Klingeman, Hofferbert and Budge 1994). The saliency approach investigates the program-to-policy linkage by examining the association between parties’ emphases of
various policy themes in their programs and subsequent government spending in related policy areas. Similarly, Sulkin (2009) examined issue emphases in US Congressional candidates’ campaign appeals, and found that these correlate with relevant legislative activity once in office. The pledge approach is distinct from the saliency approach in that it features the specific policy contents of parties’ electoral appeals, which allows a more fine-grained analysis of the program-to-policy linkage.
The research approach we use is quite straightforward: we identify pledges in party programs and evaluate the extent to which these pledges were fulfilled (for reviews of this approach and comparisons to other approaches see Royed 1996; Mansergh and Thomson 2007; Naurin 2014). Election pledges are commitments in parties’ programs to carry out certain policies or achieve certain outcomes. These commitments are
sufficiently detailed for researchers to test whether or not they were fulfilled after the election. In one of the earliest pledge studies, Pomper (1968; Pomper and Lederman 1980) examined the fulfillment of election pledges made by US parties. Our study takes the pledge approach forward with the first truly comparative analysis of pledge fulfillment across 12 countries: Austria, Bulgaria, Canada, Germany, Ireland, Italy, the Netherlands, Portugal, Spain, Sweden, the United Kingdom and the United States. Our data come from a comparative project in which scholars have worked to develop common definitions, test the reliability of different approaches, and produce data that are comparable. We merge some previously analyzed data (recoded so that they use a common definition of pledge) along with thousands of new pledges not previously analyzed. Our integrated analysis allows us to make comparable assessments of pledge fulfillment in different institutional and economic contexts and to control for pledge characteristics when examining variation
in fulfillment. We find that some governing parties fulfill high percentages of their previous election pledges, but also that there is substantial variation in pledge fulfilment. Our main focus is on the impact of power-sharing arrangements on pledge fulfillment. One of our main findings is that parties in single-party executives, both with and without legislative majorities, are more likely to fulfill their pledges than parties in coalitions.
Hypotheses
We begin the analysis by addressing the main descriptive question raised by mandate theory: to what extent do governments fulfill parties’ election pledges? We also examine whether there is a stronger program-to-policy linkage for governing parties than for opposition parties. We refer to a party as a “governing party” if it held executive office after the election and an “opposition party” if it did not, regardless of whether the party was in power during the election campaign in which it made the pledge. The fulfillment of opposition parties’ pledges can be explained at least in part by the fact that governing parties made the same or similar pledges on some issues, or that the pledges concerned uncontentious policies that any government would enact. Governing parties may also enact and take credit for popular policies proposed by their opponents.
Our main focus is the impact of power-sharing arrangements on the fulfillment of pledges made by governing parties. Single-party executives with legislative majorities are a defining characteristic of political systems. According to Lijphart’s (1999) influential typology, winner-takes-all majoritarian systems usually have single-party majority executives, while consensus democracies in which power is dispersed more widely, generally have minority governments and coalitions. For Powell and Whitten (1993)
single-party majority governments make for greater clarity of responsibility, because this gives a single party most control over policymaking. Their argument concerning clarity of responsibility refers specifically to the contexts in which voters hold governments to account for variation in economic performance. However, the idea that single-party majority governments have most control over economic policies and performance is of obvious relevance to partisan control in other policy areas. Our main hypothesis with respect to power sharing is the following:
H1: Parties that form single-party executives with legislative majorities are more likely to fulfill their election pledges than governing parties that are compelled to share power with other parties.
Governments in which parties are compelled to share power are single-party minority governments, majority coalitions and minority coalitions. Our main analyses control for government duration, which tends to be shorter for coalitions and minority governments (Saalfeld 2013).
On balance we expect single-party status to matter more than majority status. Previous research suggests that difference between governments with and without legislative majorities may not be large. Mayhew’s (2005) research on the US indicates that divided governments, in which the executive party does not control a legislative majority in one or both houses, can be as productive as those in which a single party controls both branches. Strøm (1990) also finds that minority governments, which are common in many small European countries, work effectively.
We examine several factors that may affect pledge fulfillment in minority governments, the first of which is the presence of support agreements with opposition
parties. Strøm (1990, 108-9) describes minority governments with support agreements as majority governments in disguise, and defines genuine minority governments as those that seek support for each new initiative on an ad hoc basis. Second, single-party minority governments that control the median legislator are likely to be stronger than those that do not. Crombez’s (1996) model of government formation predicts that as the largest party becomes more centrally located and larger, although still holding less than 50 percent of legislative seats, the likelihood of a single-party minority government increases.
Moreover, when these conditions are met, Crombez’s model suggests that minority status is a sign of strength rather than weakness. Third, legislative procedures such as
investiture rules define the way in which minority governments form. While there are many differences among investiture rules, it is common to distinguish between positive and negative rules (Rasch, Martin and Cheibub 2015). Under positive investiture rules, prospective governments must win the support of simple or absolute majorities in order to take office. Under negative rules by contrast, support is assumed to exist unless a legislative vote, usually by absolute majority, proves otherwise. Negative investiture rules reduce the need for prospective minority governments to make bargains with opposition parties that may dilute their parties’ campaign commitments. Nonetheless, even in the presence of negative investiture rules, minority governments still need to win majorities for the specific bills they propose, which puts them in a weaker position compared to majority governments.
The theory of veto players is relevant to the expectation that governing parties in coalitions are less likely to fulfill their election pledges. Tsebelis (2002) argues that policies tend to be more stable in systems with more veto players who have greater
ideological diversity among them. The ideological range of parties in governing
coalitions is commonly used as a measure of the heterogeneity of the set of relevant veto players (e.g. Tsebelis and Chang 2004). Since most election pledges concern proposals to bring about change, veto players theory could be taken to imply that pledge fulfillment is lower in coalitions with more parties and with parties that span a wider ideological range.
It is however questionable whether veto players theory implies hypotheses regarding effect of the ideological range of coalitions on pledge fulfillment, and we therefore simply include this variable as a control. McGann and Latner (2013, 827) point out that governing parties are not veto players according to the accepted definition of this term as members of every possible winning coalition; instead, governing parties are simply members of the winning coalition that happens to form. One coalition member’s attempt to block change in the form of the fulfillment of its partner’s election pledges may not result in non-fulfillment, but rather in the formation of a new government. Furthermore, the link between the spatial model of politics and election pledges may not be a simple one. Large ideological distances need not imply low levels of pledge
fulfillment. The saliency theory of party competition (Robertson 1976; Budge, Robertson and Hearl 1987) states that ideologically distant parties tend to focus on – and by
implication make pledges on - different issues or themes. This makes it theoretically possible for all parties in ideologically diverse coalitions to have high levels of pledge fulfillment.
Within governing coalitions, we expect the party of the chief executive or prime minister to have an advantage in terms of pledge fulfillment. According to models of coalition formation and policymaking in coalitions, the party of the chief executive has
greater influence over policy than does its junior coalition partner(s). Several models focus on the proposal power of the party selected to initiate government formation, which puts them in a strong position relative to other coalition members (Austen-Smith and Banks 1988; Baron 1991; Diermeier and Feddersen 1998). The party that leads the process of coalition formation is generally the largest party that goes on to control the chief executive. For Huber (1996), the vote of confidence procedure enables the prime ministerial party to raise the stakes in any legislative vote by making it a vote of
confidence in the government, thereby limiting the extent to which other coalition parties influence policies. Some models show how the prime minister’s party can shape policies by reconfiguring the jurisdictions of ministerial portfolios (Thies 2001; Dewan and Hortala-Vallve 2011).
Within coalitions, we also expect that pledges are more likely to be fulfilled if the party that made them went on to hold the relevant ministerial portfolio. In Laver and Shepsle’s (1996) model of coalition policymaking, parties have little say in policy areas over which they do not receive ministerial control. According to this model, parties will be persuaded to participate in a coalition only if they believe it is credible in terms of policy, and the distribution of ministerial portfolios provides such credibility. In addition, models of ministerial drift posit that ministers may pursue initiatives that differ from their government’s common platform (Huber and Shipan 2002, 185; Martin and Vanberg 2004, 15-6). There are, however, other models of coalition policymaking in which
policymaking is a process of compromise between coalition partners and ministerial autonomy is constrained (Warwick 1999; Dunleavy and Bastow 2001).
Our hypotheses regarding the fulfillment of pledges by parties within coalitions are the following:
H2a: In coalition governments, parties that receive the prime ministership are more likely to fulfill their election pledges than other coalition members.
H2b: In coalition governments, a pledge is more likely to be fulfilled if the party that made it receives the relevant portfolio.
The power-sharing arrangements considered so far, particularly the comparison of single-party majority governments with other government types, are part of a broader set of institutional constraints on governing parties. Different theoretical approaches
highlight different institutional features in addition to power-sharing arrangements within executives. Lijphart’s (1999) typology also includes federalism, bicameralism, judicial review and central bank independence. Powell and Whitten’s (1993) index of clarity of responsibility also includes the power of opposition parties in legislative committees, party cohesion and bicameralism. McGann and Latner’s (2013) theory incorporates the proportionality of the electoral system and an index of characteristics that constrain governments including bicameralism, federalism, presidentialism and referenda. A common thread running through these theories is that it is harder for governments to get things done in the face of more institutional constraints. Competing centers of power, or competitive veto points in the language of veto players theory, make it more difficult to realize policy change. They in effect raise the threshold of support required for a decision to be taken. In terms of pledge fulfillment this leads to the following expectation:
H3: Governing parties that are subject to fewer institutional constraints are more likely to fulfill their election pledges.
Given the 12 countries we include in the present study, we focus on (semi-)
presidentialism, bicameralism, federalism and EU membership as possible constraints on governing parties that reduce the likelihood of pledge fulfillment.
In addition to the degree of government and institutional control, which are our main concerns, we expect other factors to matter and control for these other variables. Pledges are more likely to be redeemed when governing parties have more resources in terms of finances and time. Economic conditions are among the most important factors in explaining variation in public policy outputs (Huber and Stephens 2001). Growth
provides government revenues, which are directly relevant to fulfilling pledges that
increase expenditure or cut taxes, and indirectly relevant to fulfilling regulatory measures, which often have implications for the allocation of government personnel. Like revenue, time is a resource that enhances the ability of governments to get things done; thus,when governments are short in duration, we anticipate lower rates of pledge fulfillment.
Characteristics of the pledges themselves and the programs in which they are made may also affect the likelihood of fulfillment. We control for the total numbers of pledges made by the party, but do not formulate a specific expectation about the direction of the effect. On the one hand, it might be more difficult to fulfill more pledges than fewer. On the other hand, a larger number of pledges may indicate that the party is more focused on pledges as part of its electoral and government strategy, which may mean a higher likelihood of fulfillment. We also control for incumbency and government experience by categorizing parties into three groups according to their status during the election campaign in which they made the pledges we examine: incumbents, opposition parties with prior governing experience, and oppositions parties without prior governing
experience. We expect that pledges by incumbents are most likely to be fulfilled, while pledges by opposition parties with no prior governing experience are least likely to be fulfilled if they enter office. By identifying parties without governing experience, we consider parties’ expectations regarding the likelihood they will enter government office. Parties without prior governing experience may not expect to enter government and therefore have to implement their pledges, which may make them more inclined to formulate pledges that are difficult to fulfill.
Characteristics of pledges themselves may matter too. Our hypotheses refer to pledges that involve changes to the status quo. In a minority of pledges, parties promise to maintain the status quo on particular issues, and we analyze the fulfillment of these pledges separately, anticipating a high rate of fulfillment given the incrementalism of policymaking in large governments. We also explore whether pledges of different types, such as pledges to cut taxes or expand programs, differ significantly in terms of their likelihood of being fulfilled.
The relations among pledges made by different parties should also be considered, particularly when power-sharing arrangements compel parties to cooperate with others. We expect that governing parties’ pledges are more likely to be fulfilled if other
governing parties made the same or similar pledges. Our models also control for the fact that in six of the 57 election campaigns we study, at least some of the pledges appeared in programs written by pre-election coalitions of parties. We expect that pledges made by pre-election coalitions are more likely to be fulfilled than pledges made by separate parties that enter coalitions.
It may be argued that parties consider the future institutional environment they expect to encounter when making pledges, with parties that expect more obstacles making more modest pledges. This could nullify the observable effects of institutions on fulfillment; to the extent that we do find institutional effects, these may be underestimates of their true magnitude. There are two other responses to this concern regarding
endogeneity. First, rational parties have good reason to make pledges they know they may not be able to keep. Pledges that have a low likelihood of being fulfilled create negotiating space in coalition or legislative negotiations. Such pledges also serve to signal commitment to key supporters. Second, the qualitative evidence casts doubt on the idea that parties only make pledges that they expect to be able to fulfill. Small parties do not issue more modest election platforms than large parties just because they are less likely to govern alone; instead, they set out what they would ideally do if it were up to them. The US case gives many examples of the fact that parties do not necessarily tailor their pledges to foreseeable constraints. Republican Party platforms regularly pledge to enact a constitutional amendment banning abortion, while this is unlikely to be fulfilled without winning both the presidency and unrealistically large majorities in both houses.
Research Design
Case selectionThe study includes information on 20,023 pledges made by parties prior to the formation of 57 governments in 12 countries. The governments included are representative in that they offer variation in the four types of executive government: 1) single-party executives with legislative majorities; 2) single-party executives with legislative minorities; 3)
coalition-based executives with legislative majorities; and 4) coalition-based executives with legislative minorities (Table 1). Each of the governments lasted at least 12 months and was the first government to take office after the previous election.1
The selection of these countries was a consequence of researchers working independently on the countries on which they have specialist knowledge and interest, and subsequently coordinating their efforts to make comparisons possible.
[Table 1 about here]
For the purposes of comparison we treat US governments as cases of single-party executive government with or without legislative majorities. Divided governments in the US have more in common with single-party minority governments than with coalition governments; US presidents must negotiate with the other main party in the legislature on each piece of legislation, as opposed to coalition governments, which typically have ongoing agreements on a range of issues. We recognize, however, that these US
governments may differ from the other single-party executives included, and we explore whether our key findings differ when excluding the US from the analysis, which they do not (Supporting Information).
1
The countries and time periods covered included several short-lived governments of less than 12-months duration and caretaker governments (in Bulgaria and Ireland), which we do not examine here, but are considered in some detail in country-specific studies. These cases provide insights into the tribulations of governing in times of transition or crisis, rather than the effects of power-sharing arrangements in which we are interested in this study.
There is some variation among the country studies in the policy areas included as well as the time-periods covered, and we include controls and tests to check that this does not drive our main findings. Most country studies include all policy areas for all main parties, while a few focus on a broad subset of socioeconomic policy for all or some parties. The data for the Netherlands and Spain and for one of the Irish governments include only socioeconomic policy. We control for the time-period in which each pledge was made with a categorical variable for the decade since we do not expect time to have a linear effect.
Measurement
There are two steps to the pledge-testing approach: first, identifying pledges in election manifestos, and second, testing fulfillment. For a statement to qualify as a pledge, it must contain language indicating commitment to some future action or outcome. Pledges include both firm commitment such as “we will” or “we promise to”, as well as more softly described intention, such as “we support” or “we favor”, as long as parties indicate that they support the action or outcome referred to unequivocally. What determines whether a statement qualifies as a pledge is the testability of the action or outcome to which the party is committing itself. A pledge is a statement committing a party to an action or outcome that is testable: i.e. we can gather evidence and make an argument that the action or outcome was either accomplished or not. Many statements that begin with hard commitment language would be considered rhetoric, not pledges, because they do not meet the testability criteria—for example, “we will ensure that our government shows respect for families” or “we support fair treatment for all.” We define a pledge as a
statement committing a party to one specific action or outcome that can be clearly determined to have occurred or not. The Supporting Information provides an extensive
discussion of the conceptual issues associated with the definition of pledges, as well as the different approaches that scholars within our group used before settling on this common denominator for the purposes of comparative research.
Reliability tests were conducted on the identification of election pledges. For the specific definition used here, nine researchers independently coded part of the 2008 Canadian Conservative Party manifesto. The reliability for each pair of coders was computed as x/n, where x is the number of statements that both coders identified as pledges and n is the total number of statements identified as pledges by at least one of the nine coders. The nine coders identified a total of 99 pledges in the manifesto with an average paired reliability of 74 percent. Separate reliability tests were carried out within several country studies with higher levels of agreement between coders: Ireland (80 percent), Netherlands (88 percent), Spain (87 percent), Sweden (94 percent), the US and UK (together 84 percent). The reliability tests in the studies of Ireland, the Netherlands and Spain and Sweden used the same narrow definition of pledges as that used here, while the studies of the US and the UK used a broader definition.
We also conducted a reliability test on the categorization of pledges as “fully”, “partially”, or “not” fulfilled. Depending on the nature of the action or outcome referred to in the pledge, a variety of sources were consulted to test fulfillment, including
legislation, ministerial decrees, budgetary or other data, and secondary sources. A total of 40 pledges were randomly selected (five from eight of the countries examined here) and examined by seven researchers. The researcher primarily responsible for work on the
country concerned provided the other researchers with the evidence he or she used to evaluate the fulfillment of each pledge without revealing his or her evaluation, and translated the relevant material into English if necessary. Seven researchers then independently categorized each pledge as “fully”, “partially”, or “not” fulfilled. Across the 21 pairs of researchers, we found an average agreement rate of 93 percent.
For 10 of the 12 countries selected, we have data on the three-category indicator of fulfillment, but work done on Italy and Spain used the dichotomous categorization of “not fulfilled” and “at least partially fulfilled.” To maximize the numbers of cases, our multivariate analyses focus on this dichotomous indicator in all countries.
The analyses also include information from our coding of the characteristics of each pledge. We coded whether each pledge directly agreed or disagreed with a pledge made by one or more other parties. Our multivariate analyses count multiple mentions of the same or a similar pledge by different parties at the same election only once.2
We also distinguished between pledges to maintain the status quo, which are a minority of cases,
2
In the multivariate analyses we measure the fulfillment of a pledge that was made by several governing parties in a coalition by assessing the pledge as it was formulated by the party that obtained the prime ministership or the largest of the governing parties if none held the prime ministership. A pledge is coded as “similar” to another if the fulfillment of one of the pledges would mean that the other pledge was also fulfilled at least partially. So pledges by party A to cut the basic rate of tax from 20% to 15% and party B to cut that tax rate from 20% to 17.5% would be coded as “similar”, even though they are distinct promises. Very few pledges are in direct disagreement with other
and pledges to introduce some kind of change. We exclude status quo pledges from the multivariate analyses, because our hypotheses are relevant to change pledges. For a subset of six countries we developed a more detailed categorization of pledge type, which distinguishes tax-cut and expansionary pledges among others, and report on this in the Supporting Information.
To estimate the ideological range of each coalition government, we use measures of the ideological positions of each party on the Left-Right dimension formulated by Lowe et al. (2011), which adjust data from the Comparative Manifestos Project (Budge et al. 2001; Klingmeann et al. 2006) for measurement error. We take the absolute distance between the two most extreme parties in the coalition as the measure of ideological range. We also control for the ideological distance between each party and the position of the party of the median legislator.
For coalition governments, we include a control for the Herfindahl index of concentration based on the seat shares of each coalition member. This varies from .32 to 1 in our sample, and becomes larger as the share of seats held by any one of the parties becomes larger. The measure of GDP growth uses data from the World Bank. It is the average growth rate over the lifetime of the government.
Analysis of Pledge Fulfillment
Election pledges refer to many important policy changes. To take examples from three countries in our dataset, in the US the Republicans under Reagan at least partially fulfilled pledges to cut certain taxes, enact deregulation, and tighten eligibility for food stamps. At the same time, the Republicans failed to fulfill pledges to reduce certain other
taxes, enact a youth minimum wage, and create tuition tax credits for private schools. Among the UK Conservative Party’s fulfilled pledges were commitments to reduce taxes, particularly for high earners, sell-off public housing, and privatize certain public sector companies. In the three-party majority coalition that that took office in the Netherlands in 1994, the Labour Party (PvdA) partially fulfilled a promise to raise welfare payments in line with wage increases in the private sector, while the Liberal Party’s (VVD) pledge to freeze welfare benefits at their 1994 levels went unfulfilled, as did the Democrat 66’s (D66) pledge to reduce the top rate of income tax. While the subsequent analyses focus on systematic variation in pledge fulfillment, we should not lose sight of the importance of pledges to the people they affect.
Figure 1 shows descriptive information on pledge fulfillment in the 12 countries included. The first main finding is that governing parties fulfilled a clear majority of pledges at least partially: 60 percent (5,439 of the 9,133 pledges were fulfilled at least partially). There is substantial variation in levels of pledge fulfillment, and the aggregate figures suggest that governing parties in single-party executives are more likely to fulfill their election pledges than parties in coalitions. The highest rate of fulfillment for governing parties is found in the UK, where all five governments were single-party governments with parliamentary majorities; the UK governing parties fulfilled 86 percent (494 of 575 pledges) at least partially. The single-party minority governments in Sweden also fulfilled a remarkably high 87 percent (112 of 129) of their pledges at least partially, while the Swedish majority coalition of 2006-10 fulfilled a lower percentage of its
pledges: 68 percent (92 of 135). However, the Swedish minority coalition that took office in 2010 fulfilled a higher percentage of pledges in its pre-election coalition platform: 82
percent (182 of 223). There are also relatively high rates of pledge fulfillment in the two single-party Portuguese governments. The lowest overall rates of pledge fulfillment are found in Ireland, Bulgaria, Austria and Italy. These governments include several relatively short-lived coalitions, and in the Austrian and Italian cases broad coalitions. Two of the Austrian coalition governments include the far-right populist Freedom Party, which had little government experience at the national level and faced ongoing internal disagreements, which also led to the early termination of the first cabinet. US presidential parties fulfilled a higher percentage of their election pledges than governing parties in most coalition systems, but less than governing parties in parliamentary systems where single-party governments are the norm.
[Figure 1 about here]
Figure 1 also contains information on the fulfillment of pledges made by non-executive parties. Opposition parties’ pledges have a reasonable likelihood of being fulfilled, particularly when opposition parties face minority governments and/or coalitions. In Germany, for instance, 42 percent of opposition parties’ pledges were fulfilled at least partially. Non-presidential parties in the US also saw relatively high percentages of their pledges fulfilled. In most periods, non-presidential parties held congressional majorities. In the UK, pledges made by opposition parties are less likely to be fulfilled, which accords with the general view of the UK as a winner-takes-all
majoritarian system. The particularly high percentage of fulfillment for opposition parties facing minority coalitions should be treated with caution since this figure is based on pledges made by one Irish party in 1997. The country study of Italy does not include information on opposition parties’ pledges.
Table 2 presents the first multivariate models. Each of the 7,770 observations refers to a campaign pledge made by one or more parties that held executive office after the election.3
The dependent variable is whether the pledge in question was at least partially fulfilled (1) or not (0). The models include only governing parties’ pledges, exclude status quo pledges, and count pledges made by more than one governing party once, as described above. This accounts for the smaller number of cases in Table 2 compared to the total number of governing parties’ pledges reported in Figure 1. Status quo pledges are a minority of pledges and are very likely to be fulfilled; of the 9,133 pledges made by governing parties, 871 were status quo pledges. Of these 871 pledges, 768 or 88 percent were at least partially fulfilled and there is little variation in the fulfillment rate across different types of government. While status quo pledges can be substantively important promises, they are qualitatively different from pledges to change the current state of affairs, which makes it appropriate to exclude them from the
multivariate analyses.
[Table 2 about here]
3
The data have a hierarchical structure to which a multilevel model could be applied; pledges are nested in 81 party platforms of pre-election coalition platforms, which are nested in campaigns/governments, which are nested in countries. There are, however, few observations at some of the higher levels (12 countries and a maximum of four different election programs within any of our governments), which makes multilevel modeling problematic. Two of the explanatory variables, Relevant portfolio and Agreement between coalition partners, vary within programs, which makes us prefer individual pledges as the unit of analysis, rather than platforms.
The headline finding from Table 2 is that parties in single-party governments, both with and without legislative majorities, significantly outperform parties in coalitions on pledge fulfillment. Governing parties in single-party majority governments by
definition control the chief executive, all ministries, have an ideological range of zero, a Herfindahl index of one and a distance of zero to the median legislator. Model 1 therefore excludes these variables. In Model 1 the negative coefficients for the variables Coalition majority and Coalition minority indicate that parties in these types of government are significantly less likely to fulfill their pledges than parties in single-party majority
governments, which is the reference category. The coefficients for Coalition majority and Coalition minority governments are also significantly different from the coefficient for Single-party minority governments (p=.00), indicating that parties in coalitions are significantly less likely to fulfill their pledges than parties in single-party minority governments. The magnitude of the effects of the coalition variables is also substantial. The odds ratios for Coalition majority and Coalition minority governments (eb
of .36 and .37) indicate that the odds of pledge fulfillment in these types of government are 64 and 63 percent lower than for single-party majority governments.
Model 1 also reveals surprisingly that parties in single-party minority
governments are not significantly less likely to fulfill their pledges than parties in single-party majority governments. On the contrary, governing parties in single-single-party minority governments are significantly more likely to fulfill their pledges according to Model 1, although this positive affect becomes borderline significant in Model 2, which adds additional explanatory variables. The positive and significant effect also becomes clearly insignificant when we exclude the duration variable from Model 1. Despite the lack of
robustness of the significant positive effect of Single-party minority government, the absence of a significant negative effect is noteworthy.
The single-party governments deserve further analysis, particularly with respect to the comparison between the 15 majority and 16 minority single-party governments. This analysis highlights that majority governments do not outperform minority governments, even those of a relatively short duration. Model 1 of Table 3 examines pledges made by parties that entered party governments and distinguishes between the 11 single-party minority governments that lasted longer than three years and the five single-single-party minority governments that lasted less than three years. None of the 15 single-party majority governments lasted less than three years. Neither of the minority government coefficients is significant, indicating that the likelihood of pledge fulfillment for single-party minority governments is not significantly lower than for single-single-party majority governments. The government with the shortest duration in this model is the single-party minority Canadian Liberal Party government 2004-06, which lasted just over a year and nonetheless fulfilled 72 percent (63 of 87) of its pledges at least partially.
[Table 3 about here]
With respect to these single-party minority governments, we further explored (1) agreements with opposition parties, (2) seat share and control of the median legislator as highlighted by Crombez’s (1996) model, and (3) the presence of negative investiture rules which strengthen the executive relative to the legislature (details are in the Supporting Information). Agreements with opposition parties do not have a consistent effect on the likelihood of pledge fulfillment, although there is some evidence that the Spanish minority governments benefited from this arrangement. Neither seat share nor
control of the median legislator accounts for variation in pledge fulfillment among
minority governments. Our data exhibit relatively little variation in these variables; of the 11 single-party minority governments outside the US, all consisted of the largest party in the legislature with an average of 45 percent of the legislative seats, and only one had less than 40 percent of seats. Eight controlled the median legislator, and the three that did not hold the median legislator, one Spanish government and two Canadian governments, did not fulfill markedly fewer pledges than those that did. There is some evidence that negative investiture rules are associated with higher rates of pledge fulfillment. Both Sweden and Portugal have negative investiture rules, which strengthen minority governments relative to the legislature, and the minority governments in Sweden and Portugal have high rates of pledge fulfillment. In a multivariate analysis reported in the Supporting Information, the presence of a negative investiture procedure is associated with a significantly higher likelihood of pledge fulfillment by parties in single-party minority governments.
We now turn to the variables Chief executive and Relevant portfolio, which take different values for parties in governing coalitions. Model 2 in Table 2 includes these and other controls. The coefficients for Coalition majority and Coalition minority remain negative and significant in Model 2, indicating that the likelihood of pledge fulfillment is significantly lower in these situations than in single-party majority governments. Both of the coalition coefficients differ significantly from the Single-party minority coefficient, but not significantly different from each other (p=.99). As expected Chief executive has a positive and significant coefficient in Model 2. The odds of pledge fulfillment are 55
percent higher if the party receives the Chief executive. We do not, however, find significant effects associated with Relevant portfolio or Ideological range.
Model 2 in Table 3 is restricted to the subset of cases concerning coalitions in which there is variation in the occupancy of the chief executive and relevant ministries within each coalition.4
This model confirms the finding that holding the post of chief executive within coalitions has a marked and significant positive effect on the likelihood of pledge fulfillment. Again, the effect associated with holding the relevant ministerial portfolio falls just short of statistical significance. This non-finding is contrary to the expectation from the model ministerial-portfolio allocation, but in line with models of coalition bargaining in which ministers are constrained by the compromises reached with their coalition partners.
The variables Ideological range and Herfindahl index do not affect pledge fulfillment in coalitions according to Model 2 (Table 3). The variable Agreement has a positive and significant coefficient, indicating that pledges are more likely to be fulfilled if they are supported by more than one of the coalition members.
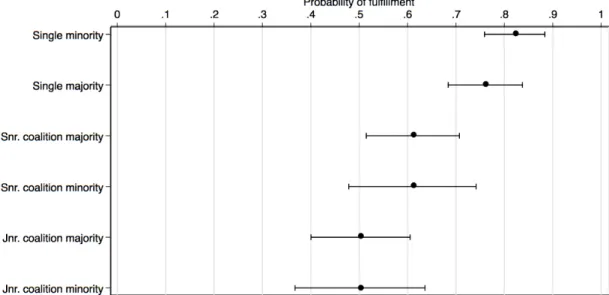
Figure 2 depicts the key findings as predicted probabilities. The highest
probabilities of pledge fulfillment are found in single-party governments and there is little difference between governments with and without legislative majorities after controlling
4
Italy is excluded from this model because all election pledges are sourced from common programs of pre-election coalitions, which means there is no variation in the variables Chief executive or Relevant ministry. Although there were also pre-election coalitions in Bulgaria and Sweden, we also have pledges from some coalition parties’ individual election platforms for those countries.
for other relevant variables including government duration. Parties in coalitions are generally less likely to fulfill their election pledges. Senior coalition members, which hold the chief executive, are somewhat more likely to fulfill their election pledges than junior coalition members.
[Figure 2 about here]
With the exception of Presidentialism, the institutional variables included in the models in Table 2 are insignificant. The US is the only presidential system in the analysis, and the significant negative coefficient indicates that pledges in the US presidential
system are significantly less likely to be fulfilled than pledges in other systems. Semi-presidentialism, bicameralism, federalism and EU membership do not have significant effects on pledge fulfillment. Since Portugal is the only semi-presidential system in our analysis, the variable Semi-presidentialism is the same as a dummy variable for Portugal.
Regarding the other control variables, the significant effect of financial resources is noteworthy. Overall, pledge fulfillment is significantly more likely in times of
economic growth, although the effect is not consistent throughout the subsets of cases. Resources in terms of time also have a positive effect on pledge fulfillment, and we noted that minority governments are disproportionately short-lived. With respect to governing experience, Models 1 and 2 of Table 2 indicate that parties with no prior experience are less likely to fulfill their election pledges than parties that were incumbents when they made their election pledges. However, this effect becomes insignificant in the subset of coalition cases (Model 2 of Table 3). The coefficients of the other control variables are insignificant or not robust.
the following additional tests, among others: 1) models that explore the effect of minority governments’ agreements with non-executive parties or legislators; 2) models applied to subsets of cases, such as only the parliamentary cases (excluding the US); 3) models with fixed effects for countries; 4) models with an additional categorization of types of
pledges in a subset of countries; 5) multinomial models with the three-category
dependent variable; and 6) models with programs as units of analyses, which exclude the variables that vary within programs. The main findings highlighted here are robust to these alternative specifications. Our main finding that single-party governments do better than coalitions in terms of pledge fulfillment is robust even in a model similar to Model 1 that includes country fixed effects. This fixed-effects model uses only within-country variation and is therefore very demanding given our data. When adding the additional controls for Chief executive and other variables to this fixed-effects model, the coefficients for Coalition majority and Coalition minority, although still negative,
become insignificant. This could be due to the lack of sufficient within-country variation in these variables. It may also be that the difference between single-party and coalition governments is due to the fact that single-party governments by definition hold the chief executive.
Conclusions
We presented the first comparative study on the fulfillment of election pledges across a broad range of countries and institutional settings. The findings concern one of the central principles of democratic theory: that parties make promises to voters during election campaigns and then fulfill those promises if they enter government office after elections
(Mansbridge 2003, 515). The evidence shows that parties act according to this principle to a considerable extent. Parties that hold executive office after elections generally fulfill substantial percentages, sometimes very high percentages, of their election pledges, while parties that do not hold executive office generally find that lower percentages of their pledges are fulfilled.
The fulfillment of pledges by governing executive parties varies across
governments in ways that reflect power-sharing arrangements. The main power-sharing arrangement that impacts upon pledge fulfillment distinguishes between single-party governments and coalitions, not between governments with and without legislative majorities. We found the highest percentages of pledge fulfillment for governing parties in the UK, Sweden, Portugal, Spain and Canada, most of which governed in single-party executives. We found lower percentages for governing parties in Germany, the
Netherlands, Austria, Bulgaria, Ireland and Italy, most of which governed in coalitions. Pledge fulfillment by US presidential parties lies at the higher end of coalition
governments, which suggests that US presidents are more constrained than governing parties in single-party parliamentary systems, but less constrained than most governing parties in multiparty coalitions. We hope that our study encourages further empirical research using the same measures of pledge fulfillment, which expands the countries and time-periods covered to include more institutional variation and non-Western
democracies.
Our study provides evidence of the effectiveness of governing parties that do not hold legislative majorities. Single-party minority governments generally consist of large centrally located parties that control the median legislator, which indicates that their
minority status is a sign of strength rather than weakness (Crombez 1996). Our findings add to previous research which demonstrates that minority governments and divided government can work effectively in terms of legislative productivity (Strøm 1990; Mayhew 2005). We also found that that negative investiture rules, which are associated with longer tenure, are also associated with a higher likelihood of pledge fulfillment by parties in minority governments. Future research could devote more attention to
specifying and testing the impact of legislative procedures on the strength of the program-to-policy linkage, particularly in research that includes more minority governments with greater variation in legislative rules on government formation and termination.
Which party controls the chief executive explains some of the variation in pledge fulfillment within coalitions, but the evidence indicates that the difference between holding and not holding this post is not always large. By contrast, according to some prominent models of policymaking, the party of the chief executive has far greater control over policy than do its coalition partners (Austen-Smith and Banks 1988; Baron 1991; Huber 1996; Diermeier and Feddersen 1998; Thies 2001; Dewan and Hortala-Vallve 2011). Moreover, we do not find clear evidence that a party’s pledges are more likely to be fulfilled if it obtained the relevant ministerial portfolio after the election (cf. Laver and Shepsle 1996). Instead, the findings are more in line with theories that
highlight mechanisms of collective policymaking and constraints on ministers (Warwick 1999; Dunleavy and Bastow 2001). These findings may encourage theorists to further specify models of policymaking to identify the conditions under which the effects of these offices are most marked. The advantage of holding these positions may depend on
the presence or absence of certain mechanisms for interministerial coordination or parliamentary control that make chief executives and ministers accountable (e.g. Martin and Vanberg 2004; Kassim 2013).
The effects of government type and economic conditions on pledge fulfillment indicate that parties do not fully adjust what they promise to the political and economic constraints they will encounter in government. If parties did respond accurately to such expectations, they would make more modest commitments when they expect to enter coalitions or when the economy is weaker, so that the probability of pledge fulfillment would be the same, regardless of these conditions. While more modest commitments in these conditions would result in higher levels of pledge fulfillment, they would not necessarily serve the democratic process well. Parties make pledges not only with a view to fulfilling them, but also to serving another two requirements of representation:
bringing together internal party factions and appealing to voters during election campaigns.
References
Austen-Smith, David and Jeffrey S. Banks. 1988. “Elections, coalitions and legislative outcomes.” American Political Science Review 82: 405-22.
Baron, David P. 1991. “A spatial bargaining theory of government formation in a parliamentary system.” American Political Science Review 85: 137-64.
Budge, Ian, Hans-Dieter Klingemann, Andrea Volkens, Judith Bara and Eric Tanenbaum. 2001. Mapping Policy Preferences: Estimates for Parties, Electors, and Governments
1945–1998. Oxford: Oxford University Press.
Budge, Ian, David Robertson and Derek Hearl. eds. 1987. Ideology, Strategy and Party
Change: Spatial Analysis of Post-War Election Programs in Nineteen Democracies.
Cambridge: Cambridge University Press.
Crombez, Christophe. 1996. Minority governments, minimal winning coalitions and surplus majorities in parliamentary systems. European Journal of Political Research 29(1): 1-29.
Dewan, Torun and Rafael Hortala-Vallve. 2011. “The Three As of Government Formation: Appointment, Allocation, and Assignment.” American Journal of Political
Science 55(3): 610-27.
Diermeier, Daniel and Timothy J. Feddersen. 1998 “Cohesion in legislatures and the vote of confidence procedure.” American Political Science Review 92: 611-21.
Downs, Anthony. 1957. An Economic Theory of Democracy. New York: Harper.
Dunleavy, Patrick and Simon Bastow. 2001. “Modelling coalitions that cannot coalesce: A critique of the Laver-Shepsle approach.” West European Politics 24(1): 1-16.
Grossback, Lawrence J., David A.M. Peterson and James A. Stimson. 2005. “Comparing Competing Theories on the Causes of Mandate Perceptions.” American Journal of
Political Science 49: 406-419.
Huber, John D. 1996. “The Impact of Confidence Votes on Legislative Politics in Parliamentary Systems.” American Political Science Review 90:269-82.
Huber, John D. and Charles R. Shipan. 2002. Deliberate Discretion? The Institutional
Foundations of Bureaucratic Autonomy. Cambridge: Cambridge University Press.
Huber, Evelyne. and John D. Stephens. 2001. Development and Crisis of the Welfare
State: Parties and Politics in Global Markets. Chicago: Chicago University Press.
ISSP Research Group 2008. International Social Survey Programme: Role of Government IV - ISSP 2006. GESIS Data Archive, Cologne. ZA4700 Data file Version 1.0.0.
Kassim, Hussein. 2013. “The Europeanization of Member State Institutions.” In Simon Bulmer and Christian Lequesne eds. The Member States of the European Union, 2nd
ed. Oxford: Oxford University Press, pp. 279–312.
Klingemann, Hans-Dieter, Richard I. Hofferbert and Ian Budge. 1994. Parties, Policies
and Democracy. Boulder: Westview Press.
Klingemann, Hans-Dieter, Andrea Volkens, Judith Bara, Ian Budge and Michael
McDonald. 2006. Mapping Policy Preferences II: Estimates for Parties, Electors, and
Governments in Eastern Europe, European Union and OECD 1990-2003. Oxford:
Oxford University Press.
Krukones, Michael G. 1984. Promises and Performance: Presidential Campaigns as
Laver, Michael and Kenneth A. Shepsle. 1996. Making and Breaking Governments:
Cabinets and Legislatures in Parliamentary Democracies. New York: Cambridge
University Press.
Lijphart, Arend. 1999. Patterns of democracy: Government forms and performance in
thirty-six countries. New Haven, CT: Yale University Press.
Lowe, Will, Kenneth Benoit, Slava Mikhaylov and Michael Laver. 2011. “Scaling Policy Preferences from Coded Political Texts.” Legislative Studies Quarterly 36(1): 123-55. Mainwaring, Scott P. and Timothy R. Scully. 1995. “Introduction.” In Scott P.
Mainwaring and Timothy R. Scully eds. Building Democratic Institutions: Party
Systems in Latin America. Stanford, Calif.: Stanford University Press, pp. 1-34.
Manin, Bernard. 1997. The Principles of Representative Government. Cambridge: Cambridge University Press.
Mansbridge, Jane. 2003. “Rethinking Representation.” American Political Science
Review 97: 515-28.
Mansergh, Lucy E. and Robert Thomson. 2007. “Election Pledges, Party Competition and Policymaking.” Comparative Politics 39(3): 311-29.
Martin, Lanny W. and Georg Vanberg. 2004. “Policing the Bargain: Coalition Government and Parliamentary Scrutiny.” American Journal of Political Science 48(1): 13–27.
Mayhew, David. 2005. Divided We Govern: Party Control, Lawmaking, and
Investigations, 1946-2002 2nd
edition. New Haven: Yale University Press.
McDonald, Michael and Ian Budge. 2005. Elections, Parties, Democracy: Conferring the
McGann, Anthony J. and Michael Latner. 2013. “The Calculus of Consensus Democracy: Rethinking Patterns of Democracy Without Veto Players.” Comparative Political
Studies 46 (7): 823-50.
Naurin, Elin. 2011. Election Promises, Party Behaviour and Voter Perceptions. New York: Palgrave Macmillan.
Naurin, Elin. 2014. “Is a Promise a Promise? Election Pledge Fulfilment in Comparative Perspective Using Sweden as an Example.” West European Politics 37(5): 1046-64. Pomper, Gerald M. 1968. Elections in America: Control and Influence in Democratic
Politics. New York: Dodd, Mead and Company.
Pomper Gerald M. and Susan S. Lederman. 1980. Elections in America: Control and
Influence in Democratic Politics, 2nd ed. New York: Longman.
Powell, Bingham G. 2000. Elections as Instruments of Democracy: Majoritarian and
Proportional Views. New Haven: Yale University Press.
Powell, Bingham G. and Guy Whitten. 1993. “A Cross-National Analysis of Economic Voting: Taking Account of the Political Context.” American Journal of Political
Science 37(2): 391-414.
Rasch, Bjørn Erik, Shane Martin and José Antonio Cheibub. 2015. Parliaments and Government Formation: Unpacking Investiture Rules. Oxford: Oxford University Press.
Robertson, David. 1976. A Theory of Party Competition. London: Wiley.
Royed, Terry J. 1996. “Testing the Mandate Model in Britain and the United States: Evidence from the Reagan and Thatcher Eras.” British Journal of Political Science 26: 45-80.
Saalfeld, Thomas. 2013. “Economic Performance, Political Institutions and Cabinet Durability in 28 European Parliamentary Democracies, 1945-2011”. In Wolfgang C. Müller, Hanne Marthe Narud. Party Governance and Party Democracy. New York: Springer, pp.51-79.
Strøm, Kaare. 1990. Minority Government and Majority Rule. Cambridge: Cambridge University Press.
Strøm, Kaare, Wolfgang C. Müller and Torbjörn Bergman. 2010. Cabinets and Coalition
Bargaining: The Democratic Life Cycle in Western Europe. Oxford: Oxford
University Press.
Sulkin, Tracy. 2009. “Campaign Appeals and Legislative Action.” Journal of Politics 71: 1093-1108.
Thies, Michael. F. 2001. “Keeping Tabs on Partners: The Logic of Delegation in Coalition Governments.” American Journal of Political Science 45(3): 580-98.
Thomson, Robert. 2011. “Citizens’ evaluations of the fulfillment of election pledges: Evidence from Ireland.” Journal of Politics 73: 187-201.
Tsebelis, George. 2002. Veto players: How political institutions work. Princeton, NJ: Princeton University Press.
Tsebelis, George, & Chang, Eric. 2004. “Veto players and the structure of budgets in advanced industrialized countries.” European Journal of Political Research 43(3): 449-76.
Warwick, Paul V. 1999. “Ministerial autonomy or ministerial accommodation? Contested bases of government survival in parliamentary democracies.” British Journal of
Tables and figures
Table 1. The 12 countries and 57 governments included Single-party executives with legislative majorities (15 governments)
Bulgaria: 1997-2001, ODS
Canada: 1993-97, Liberals; 1997-2000, Liberals; 2000-04, Liberals; 2011-15, Conservatives Ireland: 1977-81, Fianna Fáil
Portugal: 2005-09, PS
Spain: 1989-93, PSOE: 2000-04, PP
UK: 1974-79, Labour; 1979-83, Conservative; 1983-87, Conservative; 1987-92 Conservative; 1992-97, Conservative
United States: 1977-81, Democrats
Single-party executives with legislative minorities (16 governments)
Bulgaria: 2009-13, GERB
Canada: 2004-06, Liberals; 2006-08, Conservatives; 2008-11, Conservatives Ireland: 1987-89, Fianna Fáil
Portugal: 1995-99, PS
Spain: 1993-96, PSOE†; 1996-2000, PP†
Sweden: 1994-98, Social Democrats†; 1998-2002, Social Democrats†; 2002-06, Social Democrats† United States: 1981-85, Republican; 1985-89, Republican; 1989-93, Republican; 1993-97, Democrats; 1997-2001, Democrats
Coalition executives with legislative majorities (22 governments)
Austria: 2000-03, ÖVP/ FPÖ; 2003-07, ÖVP/ FPÖ; 2007-08, SPÖ/ ÖVP; 2008-13, SPÖ/ ÖVP Bulgaria: 1995-96, BSP/NS; 2001-05, NDSV/DPS; 2005-09, BSP/NDSV/DPS‡
Germany: 2002-05, SPD/ Greens; 2005-09, CDU-CSU/ SPD; 2009-13, CDU-CSU/ FDP
Ireland: 1982-87, Fine Gael/Labour; 1989-92, Fianna Fáil/ Progressive Democrats; 1992-94, Fianna Fáil/ Labour; 2002-07, Fianna Fáil/Progressive Democrats; 2007-11, Fianna Fáil/ Progressive Democrats/ Greens; 2011-2016, Fine Gael/Labour
Italy: 2001-06, Berlusconi II’s coalition (FI/ AN/ LN/ UDC/ NPSI/ PRI)‡; 2008-11, Berlusconi IV’s coalition (PdL/ LN/ MpA/ PID)‡
Netherlands: 1986-89, CDA/ VVD; 1989-94, CDA/ PvdA; 1994-98, PvdA / VVD/ D66 Sweden: 2006-10, Moderate Party/ Centre Party/ People’s Party/ Christian Democrats‡
Coalition executives with legislative minorities (4 governments)
Ireland: 1997-02, Fianna Fáil/ Progressive Democrats†
Italy: 1996-98: Prodi I’s Ulivo coalition (PDS/ PPI/ RI/ FdV/ UD)†‡; 2006-08, Prodi II’s coalition Unione (DS/ DL/ PRC/ RnP-PdCI/ IdV/ FdV/ UDEUR)‡
Sweden: 2010-14, Moderate Party/ Centre Party/ People’s Party/ Christian Democrats‡
Note: †: minority governments that had an agreement with one or more opposition parties or parliamentarians to maintain support. ‡: includes pledges made by governing parties that were part of pre-election coalitions. Dataset does not include opposition parties in Italy.
Table 2. Factors affecting executive governing parties’ pledge fulfillment
Model 1 Model 2
eb b (s.e.) p eb b (s.e.) p
Government type (reference: single-party majority)
Single-party minority 1.53 .43 (.18) .02 1.45 .37 (.19) .05 Coalition majority .36 -1.01 (.18) .00 .41 -.89 (.24) .00 Coalition minority .37 -1.00 (.32) .00 .41 -.89 (.36) .02 Chief executive 1.55 .44 (.15) .00 Relevant portfolio 1.26 .23 (.14) .10 Ideological range 1.05 .05 (.17) .77 Herfindahl index .72 -.33 (.47) .49 Presidentialism .31 -1.16 (.39) .00 .32 -1.15 (.40) .00 Semi-presidentialism 1.28 .25 (.34) .48 1.22 .20 (.35) .57 Bicameralism 1.13 .12 (.22) .59 1.06 .06 (.22) .78 Federalism .99 -.01 (.21) .95 .92 -.09 (.21) .68 EU-member .94 -.06 (.22) .77 .91 -.09 (.22) .67 GDP growth 1.11 .11 (.04) .01 1.10 .10 (.04) .01 Duration in years 1.44 .36 (.06) .00 1.39 .33 (.06) .00
Governing experience (reference: incumbents)
Opposition parties with experience .73 -.32 (.16) .04 .74 -.30 (.17) .08
Opposition parties without experience .48 -.74 (.17) .00 .46 -.78 (.18) .00
Number of pledges (/10) .99 -.01 (.01) .32 .99 -.01 (.01) .28
Pre-election coalition 2.58 .95 (.28) .00 1.72 .54 (.30) .07
Ideological distance to median legislator 1.08 .07 (.18) .68
Decade (reference: 1970s)
1980s .67 -.40 (.29) .17 .67 -.41 (.32) .20
1990s .78 -.25 (.31) .42 .81 -.21 (.31) .51
2000s .89 -.12 (.29) .68 .89 -.12 (.30) .70
Sub-set of pledges tested .79 -.24 (.18) .18 .79 -.23 (.20) .25
Constant .80 -.22 (.37) .55 .75 -.29 (.62) .64
Log pseudolikelihood -4860.90 -4836.23
chi2 (p) 531.13 (.00) 677.81 (.00)
n pledges (programs) 7,770 (81) 7,770 (81)
Note: Logit models with dependent variable partially/fully fulfilled=1 and not fulfilled=0. Standard errors clustered by program. Countries weighted equally.
Table 3. Single-party governments and coalitions examined separately Model 1 Single-party governments Model 2 Coalitions eb b (s.e.) p eb b (s.e.) p
Government type (reference: majority governments of at least 3 years)
Majority governments of less than 3 years .74 -.30 (.25) .22
Minority governments of less than 3 years .93 -.07 (.32) .83
Minority governments of at least 3 years 1.01 .01 (.24) .96 1.27 .24 (.52) .64
Chief executive 1.39 .33 (.14) .02
Relevant portfolio 1.24 .21 (.11) .06
Ideological range 1.09 .09 (.30) .76
Herfindahl index .81 -.21 (.48) .66
Agreement between coalition partners 1.90 .64 (.24) .01
Presidentialism .43 -.85 (.79) .28
Semi-presidentialism 1.43 .36 (.67) .59
Bicameralism .98 -.02 (.65) .98 1.26 .23 (.25) .36
Federalism .80 -.22 (.62) .72 .89 -.11 (.19) .57
GDP growth .96 -.04 (.06) .55 1.14 .13 (.06) .03
Governing experience (reference: incumbents)
Opposition parties with experience .63 -.46 (.33) .16 .80 -.22 (.15) .15 Opposition parties without experience .32 -1.14 (.29) .00 .74 -.30 (21) .14
Number of pledges (/10) .99 -.01 (.02) .75 .98 -.02 (.01) .20
Pre-election coalition 2.34 .85 (.47) .07
Ideological distance to median legislator 1.30 .26 (.30) .38 .87 -.14 (.22) .53 Decade (reference: 1970s for M1;
1980s for M2)
1980s .96 -.04 (.38) .92
1990s 1.75 .56 (.46) .22 1.41 .34 (.21) .11
2000s .97 -.03 (.49) .95 2.28 .82 (.24) .00
Sub-set of pledges tested .85 -.16 (.36) .66 1.15 .14 (.26) .60
Constant 3.91 1.36 (.47) .00 .34 -1.07 (.58) .06
Log pseudolikelihood -1750.47 -2612.69
chi2 (p) 102.71 (.00) 612.51 (.00)
n pledges (programs) 2,946 (31) 4,021 (45)
Note: Logit models. Dependent variable partially/fully fulfilled=1 and not fulfilled=0. Standard errors clustered by program. Countries weighted equally. Model 1 contains pledges from single-party executives in Bulgaria, Canada, Ireland, Portugal, Spain, Sweden, UK and US. Model 2 contains pledges from coalitions with variation in the variables Chief executive and Relevant ministry in Austria, Bulgaria, Germany, Ireland, the Netherlands and Sweden. Excludes Italy and the Swedish coalition from 2010-14, for which we only have pledges from pre-election coalitions.