Bruno Alexandre Caetano Afonso
Dissertation presented to obtain the Ph.D degree in Evolutionary
Biology
Instituto de Tecnologia Química e Biológica António Xavier | Universidade Nova de Lisboa
Natural selection and evolution of behaviour
and its variability in experimental populations
Oeiras,
Bruno Alexandre Caetano Afonso
Dissertation presented to obtain the Ph.D degree in Evolutionary
Biology
Instituto de Tecnologia Química e Biológica António Xavier | Universidade Nova de Lisboa
Oeiras, August 2016
Natural selection and evolution of
behaviour and its variability in
experimental populations
Esta dissertação foi desenvolvida com o apoio financeiro da Fundação para a Ciência e Tecnologia e do Fundo Social Europeu, no âmbito do Quadro Comunitário de Apoio, através da bolsa de referência SFRH/BD/51177/2010.
This dissertation was developed with the financial support of Fundação para a Ciência e Tecnologia and the European Social Fund, in the context of the Community Support Framework, through the scholarship with reference SFRH/BD/51177/2010.
3
Acknowledgements
Henrique Teotónio and Rui Costa, for enrolling in such an outlandish project and providing me the broadest view of the scientific process I could ever have longed for;
Ania Pino, for the genotyping of the inbred lines;
Ivo Chelo, Alessa Silva and Fredilson Melo, for the fecundity assays done on the inbred lines;
Sara Carvalho and Christine Goy, for their help in expanding and freezing all inbred lines;
Helena Mestre, for all the agar plates she has done for my experiments; João Garcia, for applying a tremendous amount of patience and expertise on my computing issues;
Rex Kerr and Nicholas Swierczek, for their detailed tutorial on the Multi-Worm Tracker;
The Evolutionary Genetics and the Neurobiology of Action laboratories, for the countless valuable scientific insights;
Thiago Carvalho, for opening to me the door of the Ph. D. Programme in Integrative Biomedical Sciences (PIBS) of Instituto Gulbenkian de Ciência; Isabel Gordo and Christen Mirth, for their highly professional approach as a thesis committee;
Élio Sucena, for patiently waiting for this dissertation to come out;
Instituto Gulbenkian de Ciência, for being such a special place to do science;
Champalimaud Research, for all the ‘N’joyment’ brought to my scientific environment;
À minha família, pelos convites para jantar, telefonemas e por estarem sempre disponíveis mesmo enquanto eu não estava.
5
Contents
List of figures ... 9 List of tables ... 13 Summary ... 15 Resumo... 19 Chapter 1 : Introduction... 23Variability in behaviour and its sources ... 26
The adaptive value of behaviour variation... 29
Detecting natural selection on phenotypes ... 31
Evolution of quantitative phenotypes ... 36
Aims of this thesis ... 39
References ... 42
Chapter 2 : Materials and methods... 47
Taking advantage of experimental evolution ... 48
Inbreeding ancestral and evolved populations from experimental evolution ... 52
Tracking behaviour using the Multi-Worm Tracker (MWT) ... 57
Experimental design for C. elegans tracking ... 59
Quantification of the behavioural features... 63
Behaviour statistics under analysis ... 76
Ensuring statistical independence among nematode tracks under analysis ... 80
Taking advantage of inbred line fecundity measurements ... 85
Estimating selection gradients on behaviour centrality and behaviour variability ... 86
Principal components analyses on behaviour centrality and variabilty for reduction of multicollinearity in the multivariate selection surfaces ... 91
Measuring the influence of covariates on the behaviour statistics ... 93
6 Estimating broad-sense heritability in behaviour centrality and
behaviour variability features ... 98 References ... 100 Chapter 3 : Results ... 105 Univariate selection surfaces show extensive directional and stabilizing natural selection on behaviour ... 105 Univariate selection surfaces mostly show selection for an increase in behaviour variability ... 109 No evidence for different strength of directional selection on behaviour variability and centrality ... 112 The majority of significant features in the best multivariate selection surfaces of behaviour are behaviour variability features ... 115 Multivariate selection surface on principal components shows as well selection on behaviour median and MAD principal components ... 122 Evolutionary response of behaviour centrality is widespread and substantially different in the populations and inbred lines ... 129 Behaviour variability has mostly increased upon evolution in both populations and inbred lines ... 133 Evolutionary responses in behaviour centrality and variability are more congruent with the univariate rather than the multivariate selection coefficients ... 137 All original behaviour centrality and variability features show
heritability in the ancestral population ... 151 Chapter 4 : Discussion... 153
Selection has favoured higher locomotory activity and more isolation between individuals ... 155 Selection for higher behaviour variability is widespread and relevant on the evolution of behaviour ... 158 Behaviour and its variability might have evolved under indirect
selection ... 161 Sexual dimorphism and inbreeding effects are likely on behaviour and its variability ... 170 Final remarks ... 172
7 References ... 173 Appendix 1: Best model equations for behaviour MAD as a function of sampling time. ... 177 Appendix 2: Nematode track and individual sample sizes. ... 177
Appendix 2.1: Sample sizes associated to each population in each environment. ... 177 Appendix 2.2: Sample sizes associated to each inbred line in each environment. ... 178 Appendix 3: Univariate elasticities of selection on all behavioural
features. ... 186 Appendix 3.1: Univariate selection coefficients on behaviour centrality. ... 187
Appendix 3.1.1: Univariate elasticities of selection on behaviour median ... 187 Appendix 3.1.2: Univariate selection estimates for behaviour
centrality features. ... 203 Appendix 3.2: Univariate elasticities of selection on behaviour
variability features. ... 208 Appendix 3.1.2: Univariate selection estimates for behaviour
variability. ... 219 Appendix 4: Linear approximations of the multivariate selection surfaces ... 223
Appendix 4.1: Multivariate selection gradient estimates on features included in the best model after stepwise regression. ... 223 Appendix 4.2: Steps involved in the stepwise regressions that have led to the best multivariate linear approximation of the selection surfaces using the original features... 225 Appendix 4.3: Stepwise regression steps that have led to the best multivariate linear approximation of the selection surface using the principal components of the original features ... 227 Appendix 4.4: Selection gradients of the principal components involved in the linear approximation of the multivariate selection surfaces .... 228
8 Appendix 4.5: Principal component loadings obtained from the
separate principal components analyses on behaviour centrality and
behaviour variability features. ... 231
Appendix 4.5.1: Principal component loadings obtained from the behavioural features present in the multivariate selection surface in NaCl 25 mM... 231
Appendix 4.5.2: Principal component loadings obtained from the behavioural features present in the multivariate selection surface in NaCl 305 mM. ... 236
Appendix 5: Evolution of behaviour feature centrality. ... 239
Appendix 5.1: Evolution of each behavioural feature median in the populations. ... 239
Appendix 5.2: Evolution of each behavioural feature median observed in the inbred lines. ... 247
References ... 255
Appendix 6: Evolution of behaviour variability. ... 256
Appendix 6.1: Evolution of each behavioural feature MAD in the populations. ... 256
Appendix 6.2: Evolution of behavioural feature MAD in the inbred lines. ... 262
Appendix 7: Male frequency in tracking plates of the populations. ... 268
Appendix 8: Heritabilities estimated in the ancestral population. ... 269
Appendix 8.1: Heritabilities of behaviour centrality (median). ... 269
9
List of figures
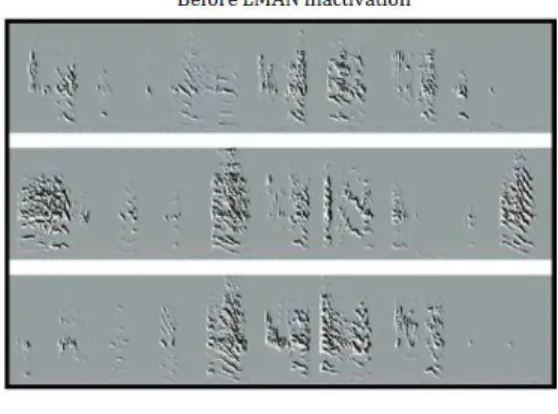
Figure 1.1 – Juvenile zebra finch song sequence and frequency lose
variability and become stereotyped after inactivation of LMAN.. ... 27
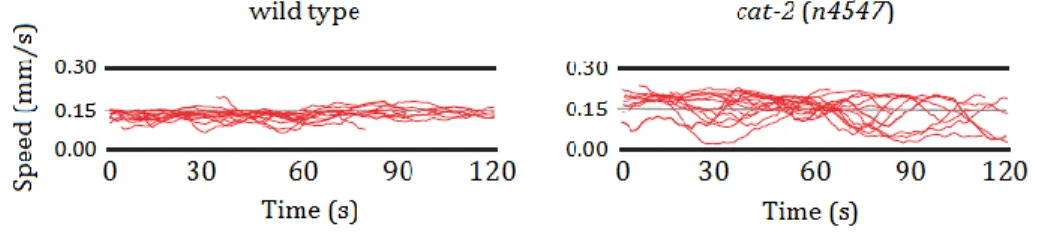
Figure 1.2 – Speed bouts from several individual C. elegans nematodes
showing speed variability is increased in a tyrosine hydrolylase deletion mutant compared to wild-type nematodes. ... 28
Figure 1.3 – Different modes of selection acting on a single trait. ... 33 Figure 1.4 – Individual selection surface on two traits, z1 and z2, showing
positive correlational selection between these two traits. ... 34
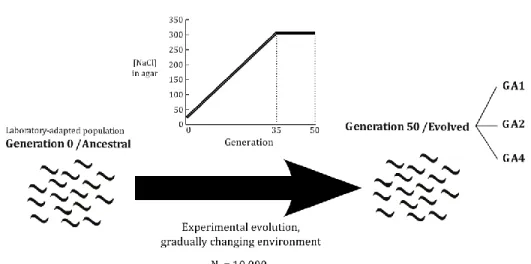
Figure 2.1 – The experimental evolution design as done in Theologidis et
al., 2014. ... 49
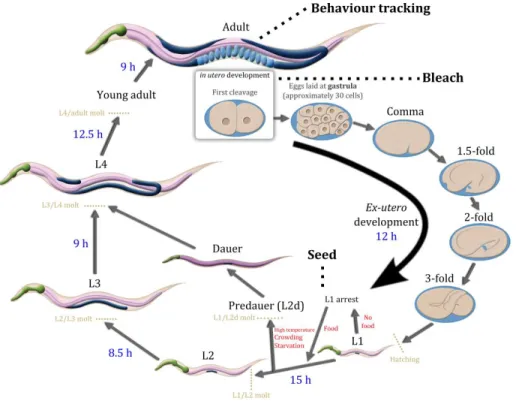
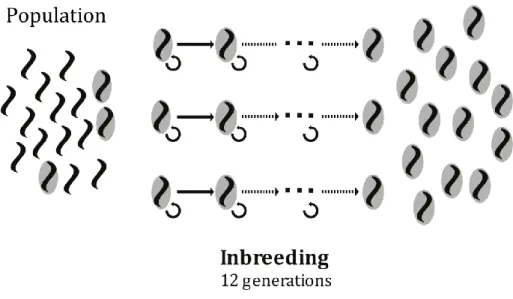
Figure 2.2 – The life-cycle of Caenorhabditis elegans. ... 51 Figure 2.3 – The inbreeding scheme. ... 54 Figure 2.4 – Heterozygosity in ancestral inbred lines (generation 0) and
evolved inbred lines (generation 50). ... 56
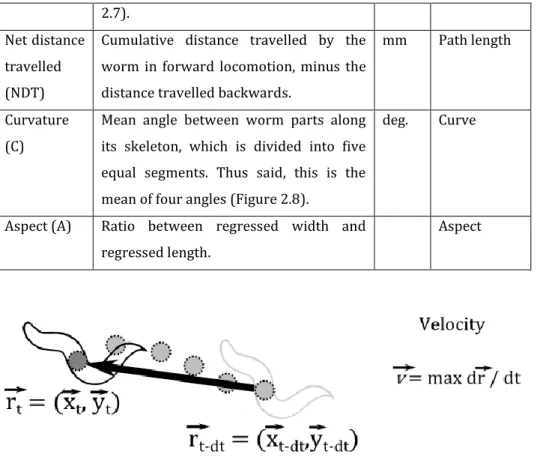
Figure 2.5 – Illustrative scheme of velocity measured in each nematode
by the MWT. ... 65
Figure 2.6 – Illustrative scheme of turning rate measured in each
nematode by the MWT. ... 65
Figure 2.7 – Illustrative scheme of both regressed length (LR) and
regressed width (WR). ... 66
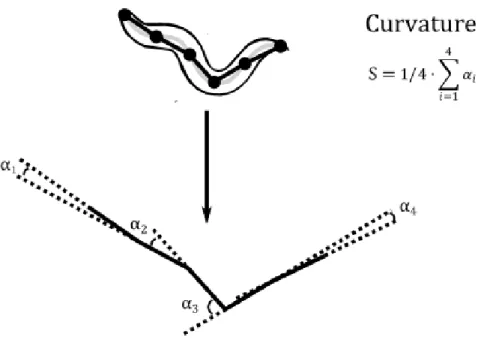
Figure 2.8 – Illustrative scheme of curvature. ... 66 Figure 2.9 – Scheme illustrating length and width measurements made
by the MWT on each individual nematode. ... 68
Figure 2.10 – Illustration of exploration rate. ... 75 Figure 2.11 – Illustration of distance to nearest neighbour. ... 76 Figure 2.12 – The diversity of distributions among the behavioural
10
Figure 2.13 – Statistical independence is achieved with worm tracks at
least 40 seconds long, with 80-second intervals in between. ... 84
Figure 3.1 – Linear, directional selection on behaviour centrality shown
by univariate elasticities of selection pressures on feature median genotypic values. ... 106
Figure 3.2 – Quadratic selection on behaviour centrality shown by
univariate elasticities of selection pressures on feature median genotypic values. ... 108
Figure 3.3 – Linear, directional elasticities of selection on behaviour
variability genetic values shown by univariate selection pressures on each of the feature MADs. ... 110
Figure 3.4 – Quadratic selection on behaviour variability shown by
univariate elasticities of selection pressures on feature median breeding values. ... 111
Figure 3.5 – Comparison of elasticities of selection measured in
behaviour median and MAD. ... 114
Figure 3.6 – Multivariate selection gradients on the genotypic values of
the features included in the best linear approximation of the selection surfaces in NaCl 25 mM and NaCl 305. ... 118
Figure 3.7 – Selection gradients estimated on the principal components
of behaviour and behaviour variability in NaCl 25 mM and NaCl 305 mM. ... 123
Figure 3.8 – Selection gradients estimated on the best linear
approximations of the selection surfaces using principal components of behaviour centrality and of behaviour variability both in NaCl 25 mM and in NaCl 305 mM. ... 127
Figure 3.9 – Evolution of behaviour centrality, measured by the median.
11
Figure 3.10 – Biplots of evolutionary responses of behaviour centrality
(median) in inbred lines and populations, both in NaCl 25 mM and in NaCl 305 mM. ... 133
Figure 3.11 – Evolution of behaviour variability, measured by the MAD.
... 134
Figure 3.12 – Biplots of evolutionary responses of behaviour variability
(MAD) in inbred lines and populations, both in NaCl 25 mM and in NaCl 305 mM. ... 136
Figure 3.13 – Biplots of the univariate directional elasticities of selection
on behaviour centrality and the respective evolutionary responses observed in the populations, both in NaCl 25 mM and NaCl 305 mM. ... 138
Figure 3.14 – Biplots of the univariate directional elasticities of selection
on behaviour centrality and the respective evolutionary responses observed in the inbred lines, both in NaCl 25 mM and NaCl 305 mM. ... 140
Figure 3.15 – Biplots of the univariate directional elasticities of selection
on behaviour variability and the respective evolutionary responses observed in the populations, both in NaCl 25 mM and NaCl 305 mM. ... 141
Figure 3.16 – Biplots of the univariate directional elasticities of selection
on behaviour variability and the respective evolutionary responses observed in the inbred lines, both in NaCl 25 mM and NaCl 305 mM. ... 143
Figure 3.17 – Biplots of the multivariate directional selection gradients
on behaviour and the respective evolutionary responses observed in the populations, both in NaCl 25 mM and NaCl 305 mM. ... 145
Figure 3.18 – Biplots of the multivariate directional elasticities of
selection on behaviour and the respective evolutionary responses observed in the inbred lines, both in NaCl 25 mM and NaCl 305 mM. ... 146
Figure 3.19 – Biplots of the multivariate directional elasticities of
selection on principal components of both behaviour centrality and variability and their respective evolutionary responses observed in the populations, both in NaCl 25 mM and NaCl 305 mM. ... 148
12
Figure 3.20 – Biplots of the multivariate directional elasticities of
selection on principal components of both behaviour centrality and variability and their respective evolutionary responses observed in the inbred lines, both in NaCl 25 mM and NaCl 305 mM. ... 150
Figure 3.21 – Heritabilities of behaviour centrality and variability
13
List of tables
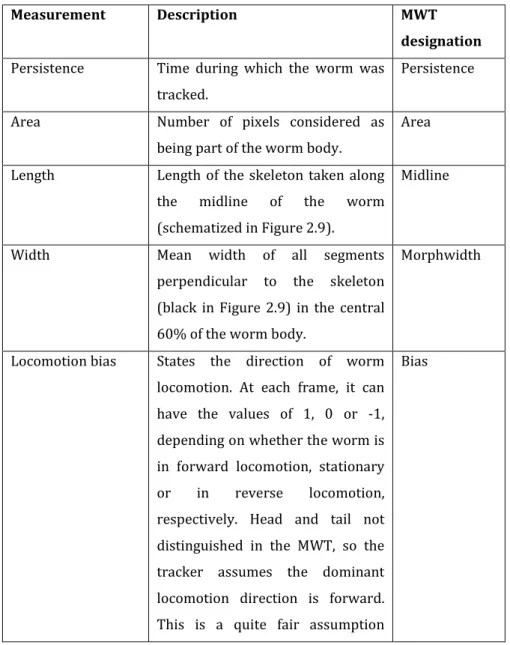
Table 2.1 – Description of the behavioural features used directly from
the Choreography output for analysis. ... 64
Table 2.2 – Other measurements extracted by Choreography, which were
used to generate other behavioural features. ... 67
Table 2.3 – Behavioural features generated from the measurements that
came as an output of Choreography and described in Tables 2.1 and 2.2. ... 69
Table 2.4 – Estimates of the effects of generation on the covariates
measured in the populations, in NaCl 25 mM. ... 94
Table 2.5 – Estimates of the effects of generation on the covariates
measured in the populations, in NaCl 305 mM. ... 94
Table 2.6 – Estimates of the effects of generation on the covariates
measured in the inbred lines, in NaCl 25 mM. ... 94
Table 2.7 – Estimates of the effects of generation on the covariates
measured in the inbred lines, in NaCl 305 mM. ... 95
Table 2.8 – Transformations applied to the behaviour centrality
(median) features. ... 96
Table 2.9 – Transformations applied to the behaviour variability (MAD)
features. ... 97
Table 3.1 – Variance inflation factors (VIF) of the features included in the
best linear approximation of the selection surface in NaCl 25 mM. ... 120
Table 3.2 – Variance inflation factors (VIF) of the features included in the
best linear approximation of the selection surface in NaCl 305 mM... 121
Table 3.3 – Variance inflation factors (VIF) of feature median and MAD
principal components included in a linear approximation of the selection surface in NaCl 25 mM using principal components. ... 124
Table 3.4 – Variance inflation factors (VIF) of feature median and MAD
principal components included in a second linear approximation of the selection surface in NaCl 305 mM, this one using principal components. ... 125
Table 3.5 – Variance inflation factors (VIF) of feature median and MAD
principal components included in the best linear approximation of the selection surface in NaCl 25 mM using principal components. ... 128
Table 3.6 – Variance inflation factors (VIF) of feature median and MAD
principal components included in the best linear approximation of the selection surface in NaCl 305 mM using principal components... 129
15
Summary
Behaviour has evolved in animal species as an output from the function of energetically expensive nervous systems. Notwithstanding, the ability to perform behaviour seems to have persisted in animal species until today, hence behaviour in general might have a significant adaptive value. Such value has been demonstrated experimentally in some instances.
However, in the latest years, it has been hypothesized that not only the performance of a given behaviour, but also the variability of behaviours performed can have an adaptive value. On one hand, variability in behaviour is usually high when an animal attempts to learn a skill – for it explores different possible behaviours – and decreases throughout learning – for the animal then exploits the actions most reinforced. On another hand, behaviour variability can be both increased and reduced through specific neural activity. Last, but not least, it has also been shown in experimental populations that learning can be adaptive.
Since natural environments are generally ever-changing and unpredictable, it seems reasonable to presume that an animal might need to learn novel actions quite frequently in order to have more chances of reproducing. This frequent novel action learning could imply frequent exploration of different behaviours, which would imply frequent generation of behaviour variability. Consistently with this idea, it has been found that individuals with higher behaviour variability show higher learning rates. However, the adaptive value of behaviour variability had never been assessed experimentally.
In this thesis, I have measured several behavioural features – ranging from postural to locomotor – using the Multi-Worm Tracker (MWT) in experimental populations of Caenorhabditis elegans to assess whether such adaptive value could really exist. These populations – one ancestral
16 and three derived – were involved in a 50-generation experimental evolution in a changing environment, in which NaCl concentration of Petri dishes has progressively increased from 25 to 305 mM from generations 0 to 35 and maintained in 305 mM between generations 35 and 50. On one hand, this progressive increase allowed a constant environmental change that would eventually trigger the need to frequently explore novel actions that could help facing the environmental stress caused by the increasing osmotic pressure. On the other hand, a progressive NaCl concentration increase could mitigate selection pressures at the physiological level because C. elegans can physiologically acclimate to increasing NaCl concentrations if they are imposed gradually. By using different summary statistics of the behavioural features tracked, one can distinguish between specific behaviours being performed and the variability of behaviours being performed. The first mode of behaviour is captured by a location statistic; here, the median along tracking time of each individual nematode tracked is used and this mode of behaviour was termed as behaviour centrality. The second mode of behaviour was termed as behaviour variability and was captured using a scale statistic, here the median absolute deviation from the median (MAD) along tracking time. Behaviour was always quantified in the environment in which experimental evolution has begun – NGM with 25 mM NaCl – and in the environment in which experimental evolution has ended – NGM with 305 mM NaCl.
The adaptive value of behaviour and its variability was assessed by estimating approximations of natural selection surfaces on the ancestral population in both the aforementioned environments. For these estimations, fecundity and behaviour were quantified in inbred lines derived from the ancestral population. The univariate quadratic approximations of the selection surface – those estimated using one behavioural feature at a time – have shown widespread directional and
17 stabilizing selection on behaviour and its variability. The directional selection was highly congruent with the evolutionary responses observed. However, the univariate selection surfaces do not distinguish between direct selection on a behavioural feature and indirect selection on that feature, due to correlation to another one. In an attempt to distinguish these, selection coefficients of several behavioural features – including both behaviour centrality and variability features – were simultaneously estimated through multivariate approximations of the selection surfaces. Yet, when these multivariate selection surfaces were taken into account, direction of selection was opposite to the evolutionary responses observed in many features. Also, the regressions used to estimate the multivariate selection surfaces were highly multicollinear, rendering the obtained estimates unstable and very susceptible to changes depending on the features included in the regression. To circumvent this multicollinearity, approximations of the multivariate selection surfaces were estimated using principal components of both behaviour centrality and variability altogether. In these, multicollinearity was still present, but in a lower degree and evolutionary responses were again little congruent with the selection coefficients there estimated, for most of the feature principal components were under selection but have not evolved.
These results suggest that even if there was direct selection favouring evolution of behaviour and its variability, such a direct selection seemed to be overruled by a stronger, indirect selection, due to correlation to unmeasured phenotypes, which has shaped the observed evolutionary response. Therefore, an adaptive value of behaviour variability cannot be neither endorsed, nor excluded, but does not seem likely under this experimental setting. For a direct demonstration or exclusion of this theory, learning rate of inbred lines with different behaviour variabilities should also be assessed, ideally by performing an operant learning task.
19
Resumo
O comportamento evoluiu nas espécies animais como resultado da função de sistemas nervosos dispendiosos a nível energético. Não obstante, a capacidade de executar um determinado comportamento parece ter persistido nas espécies animais até à actualidade, o que sugere um valor adaptativo significativo para o comportamento em geral. Tal valor foi demonstrado experimentalmente em vários casos.
No entanto, nos últimos anos tem sido colocada a hipótese de que não só a execução de um dado comportamento, mas também a variabilidade no espectro de comportamentos manifestados pode ter um valor adaptativo em si mesma. Por um lado, a variabilidade no comportamento é elevada quando um animal está a aprender algo novo – porque este explora vários comportamentos possíveis – e diminui à medida que o animal avança no processo de aprendizagem – porque o animal vai restringindo o seu leque de comportamentos àqueles que são mais reforçados ao longo da aprendizagem. Por outro lado, a variabilidade no comportamento pode aumentar e diminuir como consequência de actividade neuronal específica. Por último, mas não menos importante, foi também demonstrado em populações experimentais que a aprendizagem pode ser adaptativa.
Uma vez que os ambientes naturais podem alterar-se com frequência e de forma imprevisível, parece razoável presumir que um animal necessite constantemente de aprender novas acções de forma a ter mais hipóteses de se reproduzir. Esta aprendizagem frequente de novas acções implicaria a exploração constante de novos comportamentos, o que implicaria a geração de variabilidade no comportamento. Em concordância com esta ideia, foi também demonstrado que indivíduos que manifestam maior variabilidade no comportamento mostram
20 também uma maior taxa de aprendizagem. Porém, o valor adaptativo da variabilidade no comportamento nunca foi testado experimentalmente. Nesta tese, medi várias características comportamentais – desde características posturais a locomotoras – usando o Multi-Worm Tracker (MWT) em populações experimentais de Caenorhabditis elegans para testar a existência de um valor adaptativo para a variabilidade no comportamento. Estas populações – uma ancestral e três derivadas – estiveram envolvidas numa evolução experimental de 50 gerações num ambiente em alteração, no qual a concentração de NaCl nas placas de Petri foi aumentando de 25 mM para 305 mM desde a geração 0 à 35, tendo sido mantida em 305 mM entre as gerações 35 e 50. Por um lado, o aumento progressivo da concentração de NaCl permite um alteração ambiental constante que poderia desencadear a necessidade frequente de explorar novas acções que poderiam ajudar a lidar com o stress ambiental causado pelo aumento da pressão osmótica do meio. Por outro lado, uma vez que C. elegans pode aclimatar-se a nível fisiológico ao aumento da concentração de NaCl se tal for imposto gradualmente, uma possível pressão selectiva ao nível fisiológico poderia ser atenuada. Usando diferentes estatísticas sumárias das características comportamentais quantificadas, podemos distinguir entre a execução de comportamentos específicos e a variabilidade nos comportamentos executados. O primeiro modo de comportamento é descrito por estatística de localização; neste caso, foi usada a mediana dos valores obtidos ao longo da monitorização de cada indivíduo e este modo comportamental foi designado por centralidade do comportamento. O segundo modo de comportamento foi designado por variabilidade do comportamento e descrito por uma estatística de escala, no caso o desvio absoluto mediano em relação à mediana dos valores de cada característica ao longo do tempo de monitorização. O comportamento foi sempre quantificado no ambiente no qual evolução experimental se
21 iniciou – NGM com NaCl a 25 mM – e no ambiente em que a evolução experimental terminou – NGM com NaCl a 305 mM. O valor adaptativo do comportamento e da sua variabilidade foi avaliado estimando aproximações das superfícies de selecção natural sobre população ancestral em ambos os ambientes mencionados. Para estas estimações, foram quantificados o comportamento e a fecundidade de linhas endogâmicas derivadas da população ancestral. As aproximações quadráticas das superfícies de selecção univariadas – estimadas usando uma característica comportamental de cada vez – mostraram uma ampla selecção direccional e estabilizadora no comportamento e na sua variabilidade. A selecção direccional, por sua vez, foi altamente congruente com a resposta evolutiva observada. Porém, as superfícies univariadas de selecção não distinguem entre selecção directa numa característica comportamental e a selecção indirecta nessa característica, devido à correlação desta com outra característica. Numa tentativa de fazer esta distinção, foram estimados coeficientes de selecção em várias características comportamentais em simultâneo – incluindo características de centralidade e variabilidade do comportamento – por aproximações das superfícies de selecção multivariadas. No entanto, em muitas das características a direcção sugerida pela selecção tendo em conta as superfícies de selecção multivariadas era oposta à resposta evolutiva observada. Além do mais, as regressões usadas para estimar as superfícies de selecção multivariadas eram em larga medida multicolineares, o que leva a que as estimativas obtidas sejam instáveis e susceptíveis a alteração drástica dependendo do conjunto de características incluídas na regressão. Com o intuito de resolver a multicolinearidade, foram estimadas aproximações das superfícies de selecção multivariadas usando componentes principais da centralidade e variabilidade do comportamento em conjunto. Nestas superfícies de selecção, a multicolinearidade ainda estava presente, embora em grau
22 muito menor, e a resposta evolutiva destes componentes também era pouco congruente com a direcção sugerida pela selecção, uma vez que a maioria destes componentes estava sob selecção mas não mostrou resposta evolutiva.
Estes resultados sugerem que mesmo tendo existido selecção directa a favorecer a evolução do comportamento e da sua variabilidade, tal selecção foi contraposta por uma selecção mais forte e indirecta, devido à correlação com características não quantificadas nesta tese; esta selecção indirecta, por sua vez, terá sido a selecção que comandou a resposta evolutiva observada. Deste modo, um valor adaptativo para a variabilidade no comportamento não pode ser suportado nem excluído por estes dados, mas parece pouco provável neste contexto experimental. Para demonstrar ou excluir esta possibilidade directamente, a taxa de aprendizagem destas linhas endogâmicas da população ancestral deverá também ser quantificada, idealmente através da execução de uma tarefa que envolva um condicionamento operante.
23
Chapter 1: Introduction
We have always been amazed with the diversity of behaviour in the living world. From the locomotion in many forms – swimming, crawling, walking, running –, passing through strategies for parental care, hunting, escaping, up to aggressive behaviour in competition for resources and sexual partners, many are the forms by which living organisms behave. The concept of behaviour when applied to life seems very intuitive to any of us, yet it is still controversial at the scientific level (Levitis et al., 2009). What is behaviour? We can say it is an action that involves the physical motion of a living organism and performed under a given context that is the surrounding environment. We should recognize, however, that this phenomenon is widely observed among living systems. Many bacteria, for instance, are able to move their single-cell bodies according to their chemical environment through the rotation of long appendages called flagella (Wadhams and Armitage, 2004). Single-cell (Glaser, 1924) and colonial protists (Holmes, 1903) are also able to locomote through small appendages called cilia, which are widely dispersed throughout their cells. Sponges crawl along the soil at speeds up to 4 mm/day through propagation of cell contraction waves (Bond and Harris, 1988) and show periodic and extensive overall body contractions (Nickel, 2004), even though they are so simple animals as they have no tissue organization (Hickman Jr. et al., 2011). Even plants, such as Mimosa pudica, show leaf movements in response to mechanic stimuli (Weintraub, 1952).
In the context of this thesis, I define behaviour as the motion of a living organism’s body produced by forces generated inside that same organism. This motion can involve the entire body or only body parts, as long as these remain integrated in the whole organism. Behaviour is a property of an individual organism and not of a body part; even when behaviour only involves a single body part of a given organism; the agent
24 performing behaviour is the organism, not the body part. As an example, many vertebrate species shed a body part – usually a limb or the tail – as an extreme strategy to escape from predators, a phenomenon termed as autotomy. In many cases, that body part is able to move after being shed from the remainder of the body (Higham et al., 2013), but that body part is not behaving, according to the definition used in this thesis. The absence of motion can also be considered as behaviour, but only if there are no physical constraints for that motion to occur. For instance, rats react defensively to the presence of potential predators by assuming an immobile posture termed as freezing, which has been interpreted as a fear response (Blanchard and Blanchard, 1971). Under this definition, freezing should be considered as a behavioural response, because there is no physical constraint for their movement to occur, but rats engage in an inaction period that is considered as an action by itself. I shall recognize that this definition of behaviour is rather incomplete, for it does not include phenomena such as skin colour change in cephalopods, which allows both camouflage within the surrounding environment and also communication among conspecifics (Messenger, 2001). Nevertheless, this definition will suffice for the sake of this thesis and shares similarities with recently published definitions. These latest definitions also emphasize that behaviour is an individual property generated inside the organism (Levitis et al., 2009) and inseparable from its external and internal contexts (Gomez-Marin et al., 2014).
In most animals, behaviour is produced as a result of the activity of a nervous system, in which neurons have a pivotal role. Neurons are cells that propagate electric signals generated by ion fluxes through their cell membranes. This whole process demands energy in the form of electric potential difference. This potential difference is generated by the differential permeability of neuron membranes to ions, on one hand, and by ionic gradients generated alongside the neuron membrane, on the
25 other hand. In a regular resting state of a neuron, the gradients generated are mainly constituted by an excess of potassium ions (K+) in the internal
side of the membrane and an excess of sodium ions (Na+) on the external
side. Neuron membranes have specific ion channels, through which K+
and Na+ flow by diffusion. In the resting state, neurons maintain an ionic
gradient by actively importing K+ and exporting Na+ through a Na+/K+
pump. It is this active import and export process through the Na+/K+
pump associated with the leakage through diffusion of these ions in the reverse direction that generates the voltage alongside the neuron membrane. Every time a neuron is activated and an impulse is generated, the accumulated energy is spent, ion channels are opened in large numbers, ions will diffuse heavily, cancelling the gradient generated at rest and the potential difference is reversed; this process propagates as a wave throughout the membrane of each neuron. After that propagation, the potential difference has to be rebuilt at the membrane (Kandel et al., 2012). This voltage management in neurons requires a very high amount of energy (Attwell and Laughlin, 2001; Du et al., 2008). Consequently, nervous systems are very expensive. The adult human brain, for instance, represents 2% of the body mass, yet it is responsible for around 20% of total body energy expenditure (Kety, 1957; Sokoloff, 1960).
It is marvellous to realize that, notwithstanding paramount energy expenditure, the overwhelming majority of animal species have a nervous system, with a complexity that ranges from the diffuse systems of cnidarians to the highly structured systems in mammals (Hickman Jr. et al., 2011). It has been recognized also that a major function of the nervous system is to generate behaviour (Simmons and Young, 2010). The pervasive evolution of nervous systems can be considered a very significant landmark in the evolution of animal species and suggests that throughout evolution of animal species animals investing energy in an expensive nervous system might have reproduced more than animals
26 that refrain from such an investiment. This advantage is believed to hold in present times and therefore it is generally believed that behaviour has a significant adaptive value (Tinbergen, 1963).
Variability in behaviour and its sources
Animal behaviour can vary due to a multitude of factors, from motivational states and prior experiences to the variable nature of external stimuli (Renart and Machens, 2014). However, even when these factors seem experimentally controlled and an animal senses well-defined stimuli, behavioural responses can be highly variable (Fiske and Rice, 1955). This within-individual variation in behavioural output is known as behaviour variability1 (Renart and Machens, 2014).
This variabilty occurs due to two main reasons. On one hand, the nervous system is inherently noisy, as any other biological system involving a relatively low number of molecules (Schrödinger, 1944; Katz and Miledi 1950, 1951; Elowitz et al. 2002; Faisal et al. 2008); this noise arises mostly from random fluctuations of molecular activity and position (Elowitz et al., 2002). On the other hand, individual animals seem able to actively change levels of behaviour variability in a more deterministic manner, by activating specific neural circuits. An anterior brain region called the lateral magnocellular nucleus of the nidopallium (LMAN) was
1 In this thesis I use the concept of variability as used in neuroscience, which
would be equivalent to variation in an evolutionary biology perspective. In evolutionary biology terms, variability is seen as the potential or propensity to display variation (Wagner and Altenberg, 1996). Here I assume that, in evolutionary biology terms, the variation observed is positively correlated with the variability as a potential. In other words, I assume that the more variation observed in behaviour of an animal, the higher the potential that animal has to generate variation in behaviour, hence the higher the behaviour variability of that animal.
27 found to be crucial in generating variability in zebra finch male song (Ölveczky et al., 2005; Figure 1.1), allowing the finches to produce song trials, which are essential for song learning (Kao et al., 2005; Tumer and Brainard, 2007). In mammals, circuits lying in the interface between the cerebral cortex and the basal ganglia are hypothesized to be involved in the generation of behaviour variability (Costa, 2011), yet no neural circuits have been found to generate behaviour variability.
Figure 1.1 – Juvenile zebra finch song sequence and frequency lose variability
and become stereotyped when LMAN is inactive. The figure shows an example zebra finch song before and during LMAN inactivation. Adapted from Ölveczky et al., 2005.
28 Nonetheless, it has been found in mammals that the amount of behaviour variability before learning predicts learning rate of a given task in such a way that animals initially having a higher behaviour variability learn faster (Wu et al., 2014). that reinforcement decreases behaviour variability (Jin and Costa, 2010; Santos et al., 2015; Takikawa et al., 2002) and punishment increases it (Galea et al., 2013). In the nematode C.
elegans, dopaminergic activity through D2-like receptors has been found
to decrease locomotion speed variability (Omura et al., 2012; Figure 1.2). Furthermore, it has also been found in C. elegans that RIM interneuron increases variability in neural activity of AIB, AVA and RIM itself in response to odours and also introduces variability in behaviour responses to those odours (Gordus et al., 2015).
Figure 1.2 – Speed bouts from several individual C. elegans nematodes showing
speed variability is increased in a tyrosine hydrolylase deletion mutant compared to wild-type nematodes. Tyrosine hydroxylase is the enzyme that catalyses the conversion of L-tyrosine to L-DOPA, the immediate precursor of dopamine (Chase and Koelle, 2007). Adapted from Omura et al., 2012.
These findings clearly indicate that behaviour variability is not only the outcome of stochastic noise associated to general physical and chemical phenomena involving all molecules, but it is also regulated by specific physiological processes in a deterministic manner.
29
The adaptive value of behaviour variation
It seems reasonable to point a high adaptive value to behaviour in general because the nervous system underlying it is very expensive. Direct demonstrations of natural selection acting on behaviour are scarce, but quite significant. Mosebach-Pukowski has provided one of the first, by showing that Vanessa caterpillar crowding protects them from insectivorous songbirds as isolated caterpillars are eaten more readily than those in a cluster (Mosebach-Pukowski, 1937). In another example, male sticklebacks fan their eggs by constantly swimming in their nest spots; prevention of fanning kills the eggs and artificial ventilation rescues them (Tinbergen, 1951). Seido Ohnishi found that larval feeding rate of both Drosophila melanogaster and Drosophila simulans are positively correlated with their egg-to-adult viability (Ohnishi, 1979). On the other hand, behaviour variability has been contextualized in the exploration-exploitation trade-off. Animals tend to explore through a range of actions in order to reach actions that lead to high amount of reward in the long run – i.e. high value (Sutton and Barto, 1998) – and this exploration implies an increase in behaviour variability. In contrast, after an animal finds an action or set of actions that have high value, it will tend to exploit them by executing them more frequently (Sutton and Barto, 1998) and as a result behaviour variability will likely decrease. As the surrounding environment is mostly unknown by an individual animal and the animal cannot sample the value of all possible actions – as a virtually infinite number of actions are possible –, there is a constant need for a behavioural decision between exploiting known actions of known value and exploring new actions of unknown value, which can be higher or lower than the value of the known actions (Cohen et al., 2007; Sutton and Barto, 1998). In this context, the predictability of the environment might also influence the levels of behaviour variability
30 presented by an individual. If the environment is somehow constant and the sets of behavioural strategies with the highest values remain the same, it is likely that once an individual reaches one of these strategies after some action exploration – during which the individual should have high behaviour variability –, it will also likely exploit those strategies further and therefore reduce its behaviour variability. Conversely, if the environment is less predictable and the sets of behavioural values with highest value is changing often, it is likely that individuals will retain a high behaviour variability in the long run because even when they do find a high-value behavioural strategy in a given environment, that same behavioural strategy might later have a lower value when the environment changes and might no longer be exploited. As a consequence, the individual might then engage in action exploration once again.
Generation of behaviour variability has also been hypothesized to be a fundamental in the process of learning novel actions (Costa, 2011; Wu et al., 2014). More specifically, learning rate can be increased when initial behaviour variability is higher in the behaviour aspects relevant for the execution of a given task (Wu et al. 2014). This argument assumes that the ability to learn novel actions is also adaptive in itself, which can be the case, as documented by evidence gathered from experimental evolution (Mery and Kawecki, 2002). Thus said, if behaviour variability has an adaptive value, individuals with different levels of behaviour variability should have different fitnesses – i.e. behaviour variability should be under natural selection – and populations should be able to respond to that selection and behaviour variability should then evolve.
31
Detecting natural selection on phenotypes
The detection of natural selection on any set of phenotypes comes from the very simple premise that in a trait under selection, individual fitness is a function of the individual trait value. Therefore, a quantitative descriptor of selection such as the selection differential of a trait has been defined as a covariance between the trait and fitness (Price, 1970, 1972; Robertson, 1966). However, selection differentials only refer to the total amount of selection exerted on the trait and do not distinguish between direct selection on the trait and indirect selection due to correlation to another directly selected trait. Karl Pearson had actually set the ground to solve this issue by regressing traits on each other (Pearson, 1903), but a systematic approach was still needed. Russell Lande had actually started a general algebraic approach to measure direct natural selection on several traits. He defined selection coefficients as partial derivatives of fitness on the population trait means by modelling fitness as a multivariate function of the traits with an approximation obtained using a Taylor series (Lande, 1979). This approach was extended to describe individual relative fitness as a function of the individual multiple traits, in what was called the quadratic approximation of the individual selection surface (Lande and Arnold, 1983),
𝑤 = 1 + ∑ 𝑏𝑖 𝑛 𝑖=1 (𝑧𝑖− 𝑧̅) + ∑ ∑𝑖 1 2𝛾𝑖𝑗(𝑧𝑖− 𝑧̅𝑖)(𝑧𝑗− 𝑧̅𝑗) 𝑛 𝑗=1 𝑛 𝑖=1 (1.1)
This equation can be obtained through an ordinary least squares regression and describes the relative fitness of an individual, w, as a function of n traits, being 𝑧̅ the population mean value of trait i and z𝑖 i the
32 relative fitness of 1, the coefficient bi is a linear coefficient of trait i and γij
are quadratic coefficients of the combination of traits i and j. When traits in combination follow a multivariate normal distribution, the linear and the quadratic coefficients are uncorrelated; in this case, the coefficients bi
are the selection gradients βi, which are the linear coefficients of a linear
ordinary least squares regression. Otherwise, selection gradients have to be obtained from a linear regression including only the linear terms (Walsh and Lynch, 2014),
𝑤 = 1 + ∑ 𝛽𝑖 𝑛 𝑖=1
(𝑧𝑖− 𝑧̅) . 𝑖 (1.2)
Selection gradients measure selection on the population phenotypic means. Their values are the slopes of the selection surface and quantify directional selection. If they are positive, selection favours an increase in the population mean phenotypic value (Figure 1.3a), whereas if they are negative, fitness declines according to population phenotypic mean and therefore selection favours a decrease in population phenotypic mean.
Quadratic selection measures selection on the population phenotypic covariances (Figure 1.3b,c,d). If i=j in Equation 1.5, the coefficient γij turns
out to be a quadratic selection coefficient on trait i, which measures selection on the population phenotypic variance of trait i (Lande and Arnold, 1983; Phillips and Arnold, 1989). If the coefficient is negative, the fitness function is concave (Figure 1.3b,c,d), with a hilltop that is the fitness optimum and selection is considered stabilizing if the fitness optimum is inside the population fitness range (Figure 1.3b,d); if the quadratic selection gradient is positive, the fitness curvature is convex
33 and selection is disruptive if the fitness optimum is inside the population fitness range.
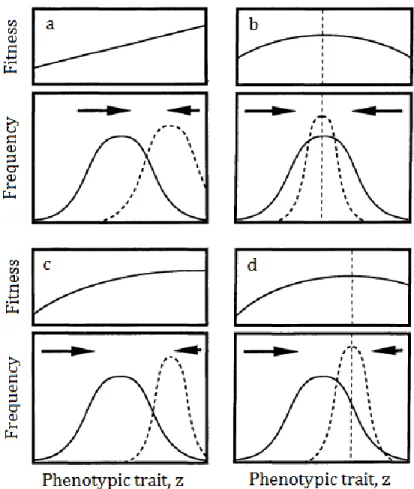
Figure 1.3 – Different modes of selection acting on a single trait. Solid,
bell-shaped lines represent the trait distribution before selection; dashed bell-bell-shaped lines are the trait distributions after selection, based on the fitness functions lying above. A straight dashed line indicates the fitness optimum when it is within the population phenotypic range. a. Directional selection, where the fitness function is linear and, therefore, the quadratic selection coefficient in Equation 1.5 would be zero. In this case, the selection gradient is positive, as fitness increases as the phenotypic value z increases. b. Stabilizing selection, where there is no linear selection. Therefore, only the population variance decreases, whereas the population mean does not change. In this case, the
34
quadratic selection coefficient is negative, as the fitness function is concave, and selection gradient would be zero. c. A combination of directional and non-linear selection. The selection gradient is positive and the quadratic selection coefficient is negative, but the fitness optimum is outside the population phenotypic range. d. A combination of directional and stabilizing selection. The coefficients can be similar to those in c, yet the fitness optimum is within the population phenotypic range. Both in c and d, selection acts both on population mean and variance. Adapted from Phillips and Arnold, 1989.
If i≠j in Equation 1.5, γij will then be a correlational selection coefficient,
which indicates selection on the population covariance between traits i and j (Figure 1.4). A positive coefficient can be interpreted as selection for increase in covariance between traits, whereas a negative coefficient can be interpreted as selection for decrease in covariance between traits.
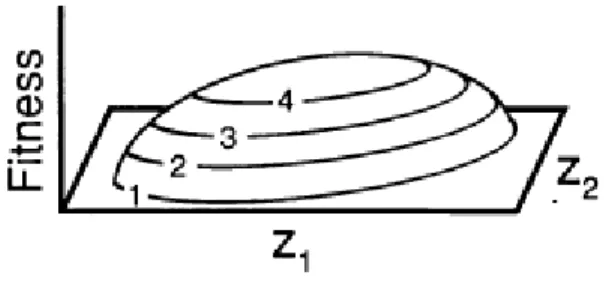
Figure 1.4 – Individual selection surface on two traits, z1 and z2, showing
positive correlational selection between these two traits. Geometrically, correlational selection can be recognized when the major axis of the surface is not parallel to either of the phenotypic axes in question, which is the case here. Adapted from (Phillips and Arnold, 1989).
The simplicity of the quadratic approximation made its use very widespread in order to estimate selection coefficients and infer modes of
35 selection (see Kingsolver et al., 2001). However, selection coefficients thus obtained will be biased if there are environmental effects affecting the individual phenotypes and these covary with fitness. In such a case, the phenotypic differences that translate into fitness differences are not only rooted in the genetic effects on that phenotype but also in its environmental effects. To exclude the environmental effect on fitness, Mark Rausher has devised a modification of the quadratic approximation of the selection surface that allows estimation of selection coefficients that are based not on individual phenotypes, but on mean phenotypes of families of individuals, taking their genetic relationship into account (Rausher, 1992). These approximations of the selection surface are estimated by regressions that resemble the ones applied by Lande and Arnold for phenotypic selection (Lande and Arnold, 1983) but they look at selection on families instead of individual phenotypes. Therefore, the equations are very similar to equations 1.1 and 1.2, respectively, but with Rausher’s notation they will take the forms below,
𝑤 = 1 + ∑ 𝐵𝑖 𝑛 𝑖=1 (𝑧̃𝑖− 𝑧̃𝑖̅) + ∑ ∑ 1 2𝛤𝑖𝑗(𝑧̃𝑖− 𝑧̃𝑖̅)(𝑧̃𝑗− 𝑧̃̅)𝑗 𝑛 𝑗=1 𝑛 𝑖=1 (1.3) 𝑤 = 1 + ∑ 𝐵𝑖 𝑛 𝑖=1 (𝑧̃𝑖− 𝑧̃̅) . 𝑖 (1.4)
In the equations above, directional selection pressures B and quadratic selection pressures Γ are, respectively, the linear and quadratic selection coefficients that result from regression of family-mean fitnesses on the family mean phenotypic values (Rausher, 1992). The regression coefficients B and Γ here estimated equal the coefficients β and γ estimated on phenotypes in the absence of environmental covariances
36 with fitness. The tilde emphasizes that these are family-mean values, not individual phenotypes.
Evolution of quantitative phenotypes
For any trait to evolve by selection – being natural or artificial selection –, selection acting on a population at a given generation has to lead to heritable phenotypic change in the following generation. If individuals with different phenotypes show different corresponding genotypes, then the trait has a genetic variance underlying it and this variance – measured along all individuals of a population – is useful to measure the degree of inheritance of a phenotype in an estimate we call heritability. The fraction of phenotypic variance (VP) that corresponds to genetic
variance (VG) is the broad-sense heritability (H2; (Falconer and Mackay,
1995),
𝐻2=𝑉𝐺 𝑉𝑃
(1.5)
We can then partition genetic variance into three main variance components: the additive genetic variance (VA), the dominance genetic
variance (VD) and the interaction or epistatic genetic variance (VI). The
additive variance is the only of these components which is heritable from parents to offspring and it is, thus, fundamental for any evolution to occur. The additive effects are the genetic effects expected to persist through segregation of parental genomes and recombination that gives rise to the offspring genomes. Based on the additive variance, we can also calculate a more strict heritability, the narrow-sense heritability (h2),
37 ℎ2=𝑉𝐴
𝑉𝑃
(1.6)
This narrow-sense heritability will be crucial in determining to what extent in a population the offspring will respond to selection taking place on their parents.
Heritability is a population property and therefore contingent on the population in question. This is because inheritance of a given phenotype from a given parent to its offspring depends on the other parent – drawn from that population – with which it is mating. In other words, the additive effects on a phenotype passed from one parent to its offspring – the breeding values (Falconer and Mackay, 1995) – depend on the other parent, which is sampled from the population, which has a given distribution of allelic frequencies. On the other hand, heritability of a phenotype will also depend on the environment, not only because the organism’s surrounding environment affects the phenotype in a specific manner (Schlichting and Pigliucci, 1998), but also because the genetic effects on the phenotype depend on the environment (Falconer and Mackay, 1995; Yang, 2014).
Therefore, the response of a population to one generation of selection –
i.e., the change in population phenotypic mean – is contingent on the
narrow-sense heritability and can be measured using the breeder’s equation (Fisher, 1930), stated as
38 In this equation, S is the selection differential, which in context of natural selection is the covariance of the trait with fitness (Price, 1970, 1972; Robertson, 1966). However, traits should not be just looked in isolation, because natural selection occurs on individuals, which have not one, but an infinite amount of traits – including behaviours – that may be correlated to some degree and selected together. Therefore, as a given behaviour may contribute directly to natural selection, other behaviours will also be selected even if they do not contribute directly to fitness differences, for they are expressed in the same individuals, hence they are correlated to the first one. This first behaviour we say it is under direct selection and the others under indirect or correlated selection (Pearson 1903; Lande and Arnold 1983). Therefore, the breeder’s equation as described in the above equation for one trait is not satisfactory to describe evolution of multiple traits. A multivariate version of the breeder’s equation (Lande, 1979) can be written as the following matrix equation R = 𝐆β, extended below
[ 𝑅1 ⋮ 𝑅𝑞 ] = [ 𝐺11 ⋯ 𝐺1𝑞 ⋮ ⋱ ⋮ 𝐺1𝑞 ⋯ 𝐺𝑞𝑞 ] [ 𝛽1 ⋮ 𝛽𝑞 ], (1.8)
where R is now a response to selection vector in q traits; each value reports the response to selection of a single trait. G is the additive genetic covariance matrix, which is a symmetric matrix of additive genetic covariances between traits. Its diagonal has the additive genetic variances of each trait (G11 to Gqq). The off diagonals are the additive
genetic covariances between traits (G12 to G1q). In quantitative genetics
literature, it has been also widely known as the G-matrix (Phillips and McGuigan, 2006). β is the vector of directional selection gradients, which
39 describe the strength of directional selection by assessing to what extent fitness changes linearly as a function of each trait, after taking into account the correlations this trait may have with all other traits (Lande, 1979; Lande and Arnold, 1983).
Aims of this thesis
In the first place, this thesis aims to assess whether there can be natural selection acting on behaviour variability.
The question is, for instance, whether locomoting at a specific velocity or with a specific curvature are the only outputs of behaviour that are relevant for individual fitness or, as an alternative, whether locomoting at variable velocities and curvatures can also be relevant for that individual fitness. In the first case, an animal would engage in a somewhat constant or fixed behavioural strategy and exploring different strategies would not be of much relevance. In the second case, the animal could also explore different strategies in a given period of time or engage in several strategies during that time, besides possibly exploiting a given behavioural strategy. The expectation here was that when a population is exposed to a novel environment, its individuals would no longer respond behaviourally in an optimized manner that could be driven by a hard-wired neural network, in which case selection on behavioural variability, if present, would favour its decrease. Instead, the need to adjust behaviourally to the novel environment would imply the acquisition of vital experiences that would unlikely be hard-wired from birth because these populations had not experienced these environmental challenges before. By imposing a novel environment on these populations, we would
40 be, under this reasoning, exerting a selection pressure that would favour individuals that have more ability to incorporate experiences through learning and, because learning rate is higher on individuals that generate more behaviour variability, we would generate a selection favouring increased behaviour variability.
To accomplish this aim, I have used experimental populations of
Caenorhabditis elegans that have undergone experimental evolution in a
changing environment for 50 generations. From the ancestral population, I have derived inbred lines and I have performed univariate quadratic approximations of selection surfaces using both inbred line fecundity – used as a fitness component – and inbred line behaviour variability of a single behavioural feature at a time. Then, I have standardized the selection coefficients obtained by the behaviour mean of all inbred lines derived from the ancestral population and thus obtained elasticities of selection. These elasticities of selection allowed the comparison of selection coefficients among different behavioural features.
A second aim of this thesis is to compare selection on behaviour variability with selection on specific behaviour values. On one hand, as referred above, selection on behaviour variability would imply selection for enlarging or shrinking the range of possible behaviours that an individual can generate. If selection favoured increased behaviour variability, then individuals that explore a larger range of alternative behavioural strategies would have higher fitness. Conversely, if selection favours decreased behaviour variability, then selection might favour a decreased exploration of possible behaviours by each individual; instead, it might favour the exploitation of fewer behavioural strategies. On the other hand, a more canonical selection on behaviour implies selection on specific behavioural strategies put into practice by a given individual. The question here is which selection acting on behaviour matters the most,
41 whether it is selection acting on behaviour variability or selection acting on specific behaviours. For this purpose, I have estimated also univariate elasticities of selection for specific behaviour values using the inbred lines of the ancestral population and compared these estimates with elasticities of selection for behaviour variability in terms of their absolute magnitude. The more positive or negative these elasticities of selection on a given feature, the stronger the selection on that feature; conversely, the closer these elasticities of selection are to zero, the weaker selection is. Thus, to compare the strength of selection of behaviour variability features with the strength of selection on specific behaviour features, I have compared their absolute values of the elasticities of selection. A third aim of this thesis is to assess effectively the adaptive value of behaviour variability. For that purpose, it is necessary to distinguish between direct and indirect selection acting on behaviour and behaviour variability. The univariate selection coefficients only quantify the total amount of selection acting on each feature and do not distinguish between selection acting directly on a feature from selection acting indirectly on a feature due to correlation with a directly selected feature. Therefore, I have also performed multivariate linear approximations of the selection surface using inbred line fecundity and all linear terms of all features, including both the features related to behaviour in itself and the features related to behaviour variability.
Finally, this thesis aims to analyse whether there was evolution of both behaviour and behaviour variability and how that evolution is related to the detected natural selection. Namely, this thesis aims to address the extent to which evolution of behaviour and its variability follow the directions pointed out by the estimated selection coefficients. To assess whether there was evolution of behaviour and its variability, the respective behavioural features were compared in the ancestral and
42 evolved populations. This comparison was also done using inbred lines, as the respective behavioural features in ancestral condition – measured in all the inbred lines derived from the ancestral population – were compared with the features in the evolved condition – using all inbred lines derived from all the evolved populations. The relationship between natural selection and evolution on all features was assessed by comparing the signs of the evolutionary responses observed – both in the populations and in the inbred lines – with the signs of both univariate and multivariate selection coefficients estimated for each feature. If the evolutionary responses were of the same sign of the selection coefficients, then evolution would have occurred in the direction pointed by the respective selection surfaces.
References
Attwell, D., and Laughlin, S.B. (2001). An Energy Budget for Signaling in the Grey Matter of the Brain. J. Cereb. Blood Flow Metab. 21, 1133–1145.
Blanchard, R.J., and Blanchard, D.C. (1971). Defensive reactions in the albino rat. Learn. Motiv. 2, 351–362.
Bond, C., and Harris, A.K. (1988). Locomotion of sponges and its physical mechanism. J. Exp. Zool. 246, 271–284.
Chase, D., and Koelle, M.R. (2007). Biogenic amine neurotransmitters in C.
elegans. WormBook.
Cohen, J.D., McClure, S.M., and Yu, A.J. (2007). Should I stay or should I go? How the human brain manages the trade-off between exploitation and exploration. Philos. Trans. R. Soc. Lond. B Biol. Sci. 362, 933–942.
Costa, R.M. (2011). A selectionist account of de novo action learning. Curr. Opin. Neurobiol. 21, 579–586.
Du, F., Zhu, X.-H., Zhang, Y., Friedman, M., Zhang, N., Uğurbil, K., and Chen, W. (2008). Tightly coupled brain activity and cerebral ATP metabolic rate. Proc. Natl. Acad. Sci. 105, 6409–6414.
43
Elowitz, M.B., Levine, A.J., Siggia, E.D., and Swain, P.S. (2002). Stochastic Gene Expression in a Single Cell. Science 297, 1183–1186.
Falconer, D.S., and Mackay, T.F.C. (1995). Introduction to Quantitative Genetics (Essex, England: Longman).
Fisher, R.A. (1930). The genetical theory of natural selection (Oxford University Press).
Fiske, D.W., and Rice, L. (1955). Intra-individual response variability. Psychol. Bull. 52, 217–250.
Galea, J.M., Ruge, D., Buijink, A., Bestmann, S., and Rothwell, J.C. (2013). Punishment-Induced Behavioral and Neurophysiological Variability Reveals Dopamine-Dependent Selection of Kinematic Movement Parameters. J. Neurosci.
33, 3981–3988.
Glaser, O. (1924). Temperature and forward movement of Paramecium. J. Gen. Physiol. 7, 177–188.
Gomez-Marin, A., Paton, J.J., Kampff, A.R., Costa, R.M., and Mainen, Z.F. (2014). Big behavioral data: psychology, ethology and the foundations of neuroscience. Nat. Neurosci. 17, 1455–1462.
Gordus, A., Pokala, N., Levy, S., Flavell, S.W., and Bargmann, C.I. (2015). Feedback from Network States Generates Variability in a Probabilistic Olfactory Circuit. Cell.
Hickman Jr., C.P., Roberts, L.S., and Keen, S.L. (2011). Animal Diversity (London: McGraw-Hill Higher Education).
Higham, T.E., Russell, A.P., and Zani, P.A. (2013). Integrative Biology of Tail Autotomy in Lizards. Physiol. Biochem. Zool. 86, 603–610.
Holmes, S.J. (1903). Phototaxis in Volvox. Biol. Bull. 4, 319–326.
Jin, X., and Costa, R.M. (2010). Start/stop signals emerge in nigrostriatal circuits during sequence learning. Nature 466, 457–462.
Kandel, E., Schwartz, J., Jessell, T., Siegelbaum, S., and Hudspeth, A.J. (2012). Principles of Neural Science, Fifth Edition (McGraw Hill Professional).
Kao, M.H., Doupe, A.J., and Brainard, M.S. (2005). Contributions of an avian basal ganglia–forebrain circuit to real-time modulation of song. Nature 433, 638–643. Kety, S.S. (1957). The general metabolism of the brain in vivo. In Metabolism of the Nervous System, (London: Pergamon), pp. 221–237.