Total tree weight for Eucalyptus
globulus Lab.(#)
By
RAUL MANUEL ALBUQUERQUE SARDINHA
Associate Professor, Wood growth-wood quality relationships Agriculture and Forrestry Institute, University of Lisbon, Tapada da Ajuda, Lisboa.
JOAQUIM ROQUE DE MELO
Forestry graduate, Wood Tecnology Laboratory. Agriculture and Forestry Institute, University of Lisbon, Tapada da Ajuda, Lisboa.
MARIA HELENA AFONSO MORAIS
Chemical graduate, National Agrarian Research Institute, Quinta do Marquês, Oeiras. Keywords
Eucalyptus globulus Lab. Tree components
Wood sp. gravity Green volume Dry weight
RESUMO
Este estudo foi executado no sentido de quantificar as várias componentes da biomassa eucaliptal potencialmente utilizáveis na indústria de pasta de papel. O estudo em referência diz respeito à Serra de Ossa que se pode iconsiderar representativa da região sub-mediterrânea.
Do presente estudo conclui-se que para o eucaliptal em estudo, os valores de desperdícios em bicadas e casca em relação à exploração tradicional atingem 2,3 e 17% respectivamente, o que representa para as duas componentes 2,17 t/ha e 11,6 t/ha. (*)
(*) This work sponsored by the «Instituto Nacional de Investigação Cientí fica», «Instituto Nacional de Investigação Agrária» and «Portucel» (Nationalized pulp industry) was carried out in the «Centro de Estudos Florestais», Lisboa.
92 ANAIS DO INSTITUTO SUPERIOR DE AGRONOMIA
Os modelos preditivos dos desperdícios na idade do l.° corte (10 anos) reve laram que os vários componentes considerados podem ser preditos com inteira segurança, utilizando como variável descritiva o DAP ou a variável combinada
(DAi>)JH.
SYNOPSIS
This study was undertaken to determine the potencial of whole Eucalyptus
globulus Lab. trees explored in a 10 year rotation as a source of wood pulp,
employing the kraft process. The first part related with wood production in a site representative of sub-mediterranean region is here discribed.
It was concluded from this study that approximately 2.3 % of top wood and 17 % of bark in relation to actual merchantable wood amounting to 2.17 ton/ha and 11.6 ton/ha respectively are now wasted by the industry that faces its major drawback for expansion in the lack of wood raw material.
Regression equations were studied to predict total dry tree components weight. The models developped showed that tree weight can be confidently used by appliying DBH alone or, the combined variable (DBH)2H or sp. gr. of an increment core to the equations given.
INTRODUCTION
The growth of the actual mill capaeity of the portuguese pulp industry based in eucalipts wood, that represents 75% of total wood pulp produced, finds in the lack of suitable wood supply its major expansion bottleneck. The surpassing of this situation, vital for the maintenance of their competitivety capaeity in the european market, advises the application of the total wood production now still left on the ground as wastes. This necessity is still stressed by the actual economics of the practice of forestry in Portugal were labor costs showed a sharp increase in the last 3 years and the stumpage price are low as compared to other european countries.
The implementation of any action towards a better utilization of
E. globulus wood production demands a different emphasis in the
quantitative measurement of the sample trees. The units of volume of the merchantable bole or merchantable size trees which are at present time being exclusively used in portuguese forest inventories is no longer an adequate perspective for those concerned with untra- ditional uses of wood.
The writers are advocates of the Complete Tree Concept: biolo- gical and technological investigation of the entire tree as have been advocated by Young (1966, 1968), Keays (1968) and Hakkila (1971).
Within the framework of this basic philosophy our Institution started a compreensive, biological and technological investigation on
E. globulus stands in order to find out the ecological impact on the
balance of nutrients and water as a result of a more intensive exploi- tation as well as the pulping potencial of forest residuais, mainly tops and bark.that are the main forseable fibre resource usually left on the E. globulus forest ground.
This paper reports volumes, and dry weight of E. globulus main components. Regression equations are presented to predict total (abo- veground) dry tree weight within a sizable eucalipt plantation at Serra de Ossa we may consider representative of sub-mediterranean region in Portugal. These are not supposed to be used for the entire range of
E. globulus plantation in Portugal. The best results will be certainly
obtained when prediction models are made in a broader site areas where E. globulus has been planted. However, this information will make it easier to evaluate the economics of removing the components unused in total-stand harvesting situations as well as their impact from the technological and economic mill point of view.
SITE CHARACTERIZATION
All climatic data of Serra de Ossa (38° 44' to 38° 46' N — Io 32' to Io 33' W) were obtained from Portugal Weather Bureau from weather reporting stations in close proximity of the sampled plots. Aecording to SROA, the ecological site classification is of the sub- -mediterranean and Atlanto-mediterranean-sub-mediterranean, type.
The eucalipt plantations are on grauwacks and schists lithosols belonging to E or in a small scale to D+E land capability classes. 0)
TABLE 1 — Climatic data at the two near weath&r reporting station Precipitation, (mm) Temperature.(°C) Total Insolatkm, (hours) Total Evaporaticm. (mm) Évora 716.8 15.6 2 900.9 2 050.8 Portalegre 948.6 15.2 2 573.5 1 729.5 Mean values 1966-1970)
(i) In Portugal, SROA (Soil Surveying and Mapping Bureau) works with 5 land capability classes identified in decreasing order of capability from A to E.
94 ANAIS DO INSTITUTO SUPERIOR DE AGRONOMIA EXPERIMENTAL PROCEDURE
Fiéld procedure
Two plots were selected as representative of Serra de Ossa, plan- tations were E. glóbulus has been extensively planted (6 000 ha) and is at the moment the biggest contigous eucalipt area. Each plot was demarcated to contain 100 trees numbered serially along the planting
rows.
From each plot, 4 trees were randomly selected subject to the following restrictions: a) trees with marked sweep along the stem lenght were excluded: b) trees with marked abnormal crown or with any evidence of die-back were also excluded.
In each plot, breast height diameter was measured by a forest caliper and recorded. The height of a randon sample of ten trees in each plot was also measured with a Blum Leise hipsometer, together with the heights of the ten trees of greastest girth, to serve as an estimate of mean height of dominante.
Within tree sampling
After the trees were felled, total height was remeasured with a tape from the tip to the terminal shoot adding thereafter the stump height.
From each sampled tree, cross sectional bolts, 0,40 m lenght, were taken at the following percentage leveis of total height: 5 %, 15%, 35 % and 75 %. An increment core was also taken at DBH height and sealed in a polyethylene bag to minimize moisture loss during trans- port to the laboratory. Top wood was defined as that part of the main stem with a diameter less or equal to 0.06 m.
Laboratory procedure
In the laboratory, discs 0.05 m thick, were sawn from the midle of the 0.40 m lenght bolts. The green diameters, outside and inside bark, to the nearest 1 mm was measured. The actual green weight of both sample components were determined to the nearest 0.1 gr while green volumes were determined by a modifyed displacement procedure described by FPL (USA, 1956). The oven dry weights were also deter mined. Because of the within tree variation in moisture content
(fig. 1), an average moisture content for each entire tree was calcula- ted by weighting the average moisture content of the two consecutive discs by the volume of the section between two discs. A similar method was used to calculate a weighted average bark moisture content whose within tree variation was also recorded (fig. 2).
in (O -Q X) O 100 90 <3* 80
\ \ \
\ \ \
y=108,727-7-038X+0.625X-0.022X3; r2= 0.678 ' \ v\ \ \.
\ \ x\ \
' \ x.\
70í
'x. X. \\ X. \U. C. L. L.C.L. Fig. 05
10
15 Sample height (m)1 — Wood moisture content (o. d. basis) variation with tree height.
Specific gravity was determined on a green volume o.d. basis and moisture was computed on an o.d. weight basis.
Because specific gravity varies with height within a tree (fig. 3), a weighting procedure, similar to that described above for determining a weighted average moisture content, was used to calculate a weighted average specific gravity for each tree so that:
X
M
o
is
tu
re
co
n
te
n
t
(o
.d
.b
as
is
)
96 ANAIS DO INSTITUTO SUPERIOR DE AGRONOMIA
90 80 70 60 . , U.C.L / / / / /
/ /
L.C.L. / / / / N. I S. k * ___ 9=84,21 ^-6,509X+0.83QX-0.025X?í
R<= 0.162 5 10 Sample height (m) 15Fig. 2 — Bark moisture content (o. d. basis) variation with tree height.
1 n Tsg = — I 2 i n /£ i H, (R* + R*+1 + R, Ri+1) (G, + Gi+1) H, (Hf + Rf+1 + R, R+11) Where:
Tsg = tree specific gravity, g/cm3, i, n = disc leveis.
Hi = bolt height at ith levei, cm. Ri = average disc radius at ith levei, cm. Gi = disc sp. gr, at ith levei. g/cm3.
Sample height (m)
Fig. 3 — Variation of basic sp. gr. with tree height. RESULTS AND DISCUSSION
Tree volumes
Average total-tree volume at the end of a ten year rotation ranged from 171.6 to 229.1 m3/ha. In terms of mean plot tree comiponents the bark volume ranged from 26.1 to 31.7 m3/ha. In relation to total- -tree barked volume this still unused fibre material representa 16.0 to 17.9% and 2.1 to 2.5% in relation to the actual used wood material for bark and top wood respectively.
Tree weights
The total standing crop dry-weight and its distribution by com- ponents for the two plots are listed in table 2.
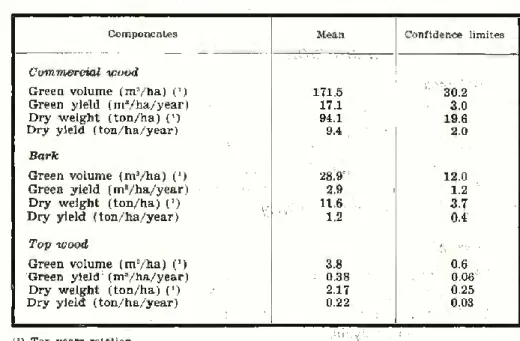
Table 3 presents the means and the confidence limits of the varia- bles used in this analysis.
ANAIS DO INSTITUTO SUPERIOR DE AGRONOMIA 98
TABLE 2 — Plot characterization
Plot Pi Plot P2
N.° of trees/ha 833 813
N." of fails/ha 278 437
Mean DBH, cm 18.88 ± 2.37 17.21 ± 1.20
Mean height, m 20.45 ± 1.25 19.20 ± 0.73
Total comercial green volume (o.
b.), m3/h 229.1 ± 50.6 171.6 ± 23.7
Total comercial green volume (u.
b.), m3/ha 197.4 ±41.9 145.5 ±18.4
Top wod green volume, m3/ha 4.13 ± 1.28 3.62 ± 0.58 Top wood percentage (green basis) 2.27 ± 1.54 2.51 ± 0.51 Bark volume, (green basis), m3/ha 31.67 ± 12.21 26.09 ± 9.20 Bark percentage (') 15.89 ± 1.87 17.81 ± 2.04 l1) Calcudate in relation to u. b. comercial wood.
The potencial wood and bark material production for the first rotation of 10 years, provided their quality should prove acceptable, is about 2.17 ton/ha of top wood and 11.6 ton/ha of bark.
TABLE 3 — Statistical values of the varidbles charaterizing Serra de Ossa E. globulus productivity
Componentes Mean Confidence lii
Commercial wood
Green volume (m3/ha) (') 171.5 '• 30.2
Green yield (m3/ha/year) 17.1 3.0
Dry weight (ton/ha) (') 94.1 19.6
Dry yield (ton/ha/year) 9.4 2.0
Bark
Green volume (m3/ha) (’) 28.9' 12.0
Green yield (m3/ha/year) 2.9 1.2
Dry weight (ton/ha) (*) u
Dry yield (ton/ha/year) 11.61.2 3.70.4
Top wood
Green volume (m3/ha) (J) 3.8 0.6
Green yield (m3/ha/year) 0.38 0.06
Dry weight (ton/ha) (J) 2.17 0.25
Dry yield (ton/ha/year) 0.22 0.03
■ -C
As can be seen from the proceeding results and in fig. 4, there is not a significative difference in the distribution of dry weight by components between the two plots, although inicial planting spacing was cleary different (1,111 plants/ha and 1,250 plants/ha for plot PI and plot P2 respectively). It is interesting to note what seems to be the existence of an optimum plant stocking in accordance with the soil moisture availability. In fact we can see a high rate of mortality 36 % in plot P2 as compared with 25 % in plot Pl, both under the same sil- vicultural and management technique. Although we still have not con- clusive quantitative results in soil moisture variation, soil water
229.1
non' 9 ' TOTAL VOLUME (m3/haj
_________ 1974 1455 W00D VOLUME u.b.(m3/haj 18.88 16-51 DBH o, b. (cm) 2045 1920 ~' HEIGHT(m) 225 240
Fig. 4 — Dendrometric sample plot charactertstics
retention and depletation under E. glóbúlus plantation and their rela- tions to the stocking, it seems the water is likely to be the limiting factor on eucalypts wood production in sub-mediterranean region. Although the number of plots was very small to make it possible to try any regression analysis relating the influence of the number of stems/ha, and DHB or basal area/ha to total tree wood biomas/ha the results presented do not seem to suggest an inverse relationship between that number of stems and total standing crop as it is
gene-100 ANAIS DO INSTITUTO SUPERIOR DE AGRONOMIA
rally described in the literature. This undoubtly seems to reflect the fact that as the number of stems decreases, live crown and thus the amount of foliage per ha. have not increased significantly leading to an increased growth. However this inverse relationship stands true for top wood weight percentage.
From the ipoint of view of tree sp. gr. the influence of compass plantation and the controverse influence of rate of growth in that characteristic was not clearly seen in this study. However, the deve- lopment of sp. gr. within the tree seems to be in a way affected for in plot P2, that shows clearly a different trend (fig. 3). This further demonstrates, when comparing within tree trends, the need to account for both stocking (area occupancy) and stand density (crowding within the area stocked) when considering the growth and yield of
E. glóbulus stands. The influence of compass plantation and their
relationship with crown struture and specific gravity will be in the future throughly investigated.
Regression equations
To provide a means of determining the potencial yield of E. glo-
bulus plantations through easier dendrometric. measurements, Stan
dard regression and multiple regression analysis were applied to data (Steel and Torrie, 1960).
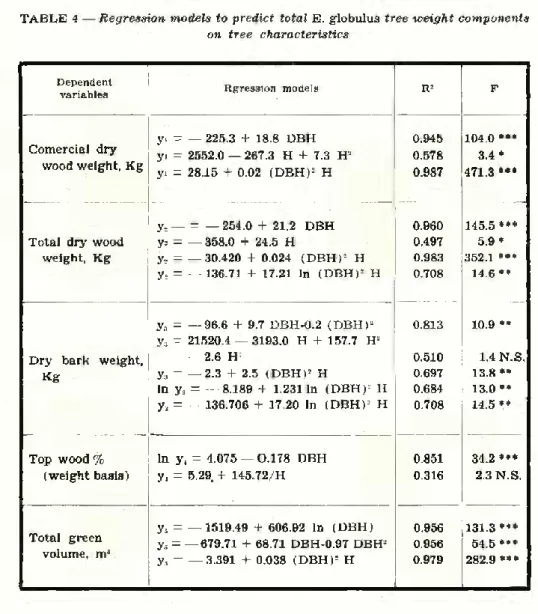
The results (Table 4) showed that volumes and weights can be confidently determined by applying DBH alone to the apropriate equations in table 4. The coefficients of determination ranged from 0.945 to 0.960, indicating a strong relationship between those depen- dent variables and DBH. The analysis made also showed that DBH alone is a better predictor than total height. The improvement made in the predictive capacity of the models by inclusion of tree height or (DBH)2 H was very small for comercial dry wood and total wood weights respectively (range 4.2 to 2.3%). For the bark models no benefit could be found even when we tried the allometric model as has been described in previous researches (Johnstone, 1973; Phillips, 1977). This is probably due to the fact that E. glóbulus is exploited in even-aged plantations (8-10 years old revolution) and the simila- rities in plot soil factors. Assuming this to be true, as can be
sug-TABLE 4 — Regression models to predict total E. globulus tree weight components
on tree characteristics
Dependent
variables Rgression models R2 F
Comercial dry wood weight, Kg y. = — 225.3 + 18.8 DBH y. = 2552.0 — 267.3 H + 7.3 H5 y. = 28.15 + 0.02 (DBH)5 H 0.945 0.578 0.987 104.0 *** 3.4 * 471.3 ***
Total dry wood weight, Kg y, — = — 254.0 + 21.2 DBH y? = — 358.0 + 24.5 H y, = —30.420 + 0.024 (DBH)2 H y, = —136.71 + 17.21 ln (DBH)5 H 0.960 0.497 0.983 0.708 145.5 *** 5.9 * 352.1 *** 14.6 **
Dry bark weight, Kg y3 = —96.6 + 9.7 DBH-0.2 (DBH)* y3 = 21520.4 — 3193.0 H + 157.7 H2 — 2.6 H' y3 = — 2.3 + 2.5 (DBH)5 H ln y3 = —8.189 + 1.231 ln (DBH)2 H y3 = — 136.706 + 17.20 ln (DBH)5 H 0.813 0.510 0.697 0.684 0.708 10.9 ** 1.4 N.S. 13.8 ** 13.0 ** 14.5 ** Top wood % (weight basis) ln y4 = 4.075 — 0.178 DBH y, = 5.29. + 145.72/H 0.851 0.316 34.2 *** 2.3 N.S. Total green volume, m3 y3 = —1519.49 + 606.92 ln (DBH) y5 = —679.71 + 68.71 DBH-0.97 DBH5 ys = —3.391 + 0.038 (DBH)5 H 0.956 0.956 0.979 131.3 *** 54.5 *** 282.9 ***
gested from the xnean height data presented in fig. 4, any attempt to assess E. globulus site productivity in terms of the conventional height-age relationship may result in erroneous conclusions. From the results presented, comparisons of productivity in terms of tree bio- mass — considering the components here included — seems to be also unadvisable and requiring increasing sampling effort.
Since there is evidence that sp. gr. appears to be under genetic control it seems clear the desirability, from the point of view of wood
102 ANAIS DO INSTITUTO SUPERIOR DE AGRONOMIA
quality and for genetic selection, the overall assessment of the entire tree sp. gr. from small wood samples from the standing trees.
The weighted increment borings sp. gr. were calculated by the formula:
Csg = OcaX 0.111);+ (Icb X 0.333) + (Ioc X 0.556)
were Csg stands for increment core sp. gr. and the subscripts A, B and C refer to the three discrete portions of the increments cores (tlie third near the pith, in the center of the core, and the third near the bark, respectively).
The results listed in table 5 showed that the weighted sp. gr. of DBH increment borings can be confidently used to predict total tree basic density (R2=0.740).
It was also showed that a clear improvement in the predictive capacity of the model could be reached using the core portion Icc (R2=0.932) or even core portion IcA (R-’ = 0.800). This last positive relationship means that sp. gr. of young trees may, therefore, be used to estimate their sp. gr. in later years. It was also found (see Table 5) that trees with a high specific gravity at an early age (core portion A) continue to produce wood with a high sp. gr. during
subsequent growth.
TABLE 5 — Regression models to predict basic specific gravity of comercial
•wood increment cores
Regression models R= F y = 0.036 + 0.974 C„ 0.740 17.1 ** y = 1.138 —0.286/ICA 0.800 24.0 ** y = 0.035 + 1.145 I,.I( 0.585 8.5 * y = 0.075 + 0.881 ICc 0.932 81.9 *** ICc = 1.180 — 0.312/ca 0.792 22.8**
y = Basic sp. gr. of comercial wood (g/cm3); C,g. Ica, Icb and Ice are also expressed
LITERATUREí CITTED
Anon. —1956 — technical Note n.° B — 14. United States Department of Agri- culture, Forest Products Laboratory.
Johnstone, J. L. — Dry Matter Production and Complete-tree Utilization of Lodge- pole Pine in Alberta. (Unpublished D. Ph. thesis, University of British Columbia).
Hakkila, P. — 1971 —Branches, stump and roots as a future raw material source
in Finland. pp — 51-62. In: Forest Biomass Studies, University of Maine Press. H. Young, ed.
Keays, J. L. — 1968—Whole-tree utilization studies: selection of tree components for pulping research. Can. Dep. Forst. Rural Develop., Forest. Br., Prod. Lab., Inform. Rep. VP-x-35.
—1971 — Complet-tree utilization. Resume of literature review. in: Forest biomass studies. Univ. Maine. Life Sei. Agr. Exp. Sta., Misc. Publ. 132, 93-102.
Phillips, D. R. — 1971 —Total tree weights and volumes of understory hardwoods.
Tappi 60 (6): 68-71.
Seel, R. C. D. and Torrie (1960). Principies and Procedures of Statistics. McGraw- -Hill Book.
Young, H. E. —1966 — World forestry based on the complete tree concept. Proc. Sixth World Forest. Congr., Madrid, Spain: 2835-2839.