Spatial distribution of sunflower cultivars and the relationship
between growth features
1Distribuição espacial de cultivares de girassol e relações entre variáveis de
crescimento
Thomas Newton Martin2*, Paulo Sérgio Pavinato3, Leandro Homrich Lorentz4, Renice Paula Zielinski3 e Rosana
Refatti3
Abstract -This work aimed to evaluate the performance of six genotypes of sunflower under two spatial distributions between plant rows, and verify the cause effect relation between growth features. The experiment was carried at experimental area of Federal Technological University of Paraná (Campus Dois Vizinhos), evaluating six sunflower cultivars and two spatial distributions (40 and 80 cm between rows), remaining the total plant population similar, 55.000 plants by hectare. It was performed a path analysis, identifying the features that have most influence on sunflower grain yield and one hundred grain weight, also multiple regression analysis was used to estimate the equation for grain yield and one hundred grain weight. It was verified that sunflower genotypes do not present different performances under the evaluated spatial distributions, however, the genotypes showed to be significantly different for most of the features evaluated. Direct effect under grain yield was observed for the features number of plants and stem diameter at 15 days, while the indirect effects were observed for plant stature via stem diameter, both at 15 days. For the feature one hundred grain weight it was verified that only plant stature at 90 days promoted a direct effect, but negative.
Key words -Helianthus annuusL. Multivariate analysis. Plant growth.
Resumo -O objetivo desse trabalho foi avaliar o desempenho de seis genótipos de girassol submetidos a duas distribuições espaciais entre fileiras de plantas e verificar a relação causa e efeito entre as variáveis de crescimento. O experimento foi realizado na área experimental da Universidade Tecnológica Federal do Paraná (Campus Dois Vizinhos), avaliando-se
seis cultivares de girassol em duas distribuições espaciais (40 e 80 cm entre fileiras), mantendo-se a população de plantas semelhante, de 55.000 plantas por hectare. Foi realizada a análise de trilha, identificando as variáveis que possuem mais influência sobre a produção de grãos e massa de cem grãos do girassol, bem como se utilizou a análise de regressão múltipla, para estimativa da equação para a produtividade de grãos e a massa de cem grãos. Verificou-se que os genótipos de girassol não possuem comportamento diferenciado quanto às distribuições espaciais avaliadas, já para os genótipos, observa-se que a maioria das variáveis apresenta diferença significativa entre si. Os efeitos diretos sobre a produção de grãos são observados para as variáveis número de plantas e diâmetro das hastes aos 15 dias, enquanto que os efeitos indiretos foram observados para estatura de plantas via diâmetro das hastes, ambos aos 15 dias. Para a variável massa de cem grãos verifica-se somente que a estatura de plantas aos 90 dias ocasiona efeito direto, mas negativo.
Palavras-chave -Helianthus annuusL.. Análise multivariada. Crescimento de Plantas.
*Autor para correspondência
1Recebido para publicação em 14/10/2010; aprovado em 03/11/2011
Pesquisa desenvolvida no Estado do Paraná
2Departamento de Fitotecnia, Centro de Ciências Rurais, Universidade Federal de Santa Maria, Campus Universitário, Camobi, Santa Maria-RS, Brasil,
97.105-900, martin.ufsm@gmail.com
3Universidade Tecnológica Federal do Paraná, Campus Dois Vizinhos, Dois Vizinhos-PR, Brasil, 85.660-000, pavinato@utfpr.edu.br, renicepaula@
hotmail.com, rosanarefatti@hotmail.com
the interest features from a correlation matrix. It is defined by Cruz and Regazzi (1997) as a standardized regression from the expansion of multiple regressions, when complex inter-relationships are involved. Bezerra Netoet al. (2010), using multivariate methods (UPGMA, Tocher and Canonical Variables) to study genetic diversity in genotypes ofRicinus communis L., verified that the methods show similar results. Therefore, multivariate techniques are used as tools to assist the researcher in plant breeding programs.
Therefore, this work aimed to evaluate the performance of six sunflower genotypes under different spatial distribution between plant rows, and verify the cause effect relation between the growth features.
Material and methods
The experiment was carried at experimental area of Federal Technological University of Paraná (Campus Dois Vizinhos), located in Dois Vizinhos, PR. The region is physiographically known as Third Plateau of Paraná, presenting an altitude of 520 m, latitude of 25°44” S and longitude of 53°04” W. The climate is subtropical humid mesothermic, according to Köppen classification system (MAACK, 1968). The soil is an Oxisol by Soil Taxonomy (1999) and a Nitossolo Vermelho Distroférrico úmbrico, clayey texture, by Bhering and Santos (2008).
Sunflower sowing was run in November 08, 2007, putting two seeds each seed hole, by hand. After ten days of germination it was realized the thinning, remaining 55.000 plants by hectare. Plant weeds were controlled before sowing, with herbicide glyphosate (5 L ha-1) and after
germination was run two hand weeding (6 and 14 leafs). Pests, like ‘vaquinha’ (Diabrotica speciosa), ‘lagarta preta’ (Chlosyne lacinia saundersii) and ‘percevejos’ (Nezara viridula, Piezodorus guildinii and Euschistus heros) were controlled by Tiametoxam+Lambda cialotrina (Engeo Pleno), in the dose of 300 mL of i.a. ha-1, and
also by Azoxistrobina + Ciproconazol (Priori Xtra), in the dose of 500 mL of i.a. ha-1, applied by the moment
of bud formation and flowering. The precipitation was normal in the growth season, running ideal condition for sunflower production.
The experimental design was in randomized blocks, with four replicates, distributed by a bifactorial model (six genotypes x two spatial distributions). The genotypes evaluated were: Paraíso 24, Paraíso 20, Paraíso 33, Morgan 374, Hélio 358 and Agrobel, and the rows spacing evaluated were 0.40 and 0.80 m, remaining total population similar in both spaces (55.000 pl ha-1).
The features evaluated were: head diameter (DCAP, cm), plant stature (EST, cm), stem diameter
Introduction
Sunflower is a species extremely adaptable to
variable environmental conditions (GOMESet al., 2006;
MELLOet al., 2006) and diversified crop managements,
like irrigation (UNGAROet al., 2000) and fertilization, among other factors. According to Bonacinet al. (2009), this crop demands a good fertilization, being very sensitive to boron deficiency. Currently, sunflower is used for oil extractions for biofuels production, as byproduct
of foods (BONACIN et al., 2009) and as bird’s food
(SAAD et al., 2007). In Brazil, the crop demand had
been supplied by the domestic market (VIEIRA, 2005). Moreover, the crop presents great results as crop rotation and succession, considering the conversion and energy
balance in the soil-plant system (SANTOSet al., 2001).
Some studies were carried with sunflower trying to determine the plants growth as function of achene’s vigor and sowing plant density, which were of 45.000 and 70.000 plants by hectare, both with row spacing of 0.70 m (BRAZ; ROSSETTO, 2009). The Results showed better development with lower plant density, but was not evaluated row spacing, what would change the results. The knowledge of spatial plant distribution is primordial to maximize plant potential to extract environmental resources, besides the possibility to change crop managements avoiding weed infestation. For corn, studies of spatial plant distribution promoting increases in grain yield are frequently highlighted (SANGOI et al., 2002; TOLLENAAR; LEE, 2002), however studies with sunflower are very incipient.
One possible way to expand sunflower production by farmers is avoiding higher investments during crop implantation. So, it is convenient that the machinery already utilized on the farm could be adaptable for this crop. One of the most expensive equipment is the seed sower, which is normally used for corn and soybean in the region and in most Brazilian cultivated areas. The seed sower can be adaptable for sunflower, once the ideal row spacing varies from 0.40 m (commonly used for soybean) to 0.90 m (commonly used for corn). However, a few studies have related spatial distribution of sunflower to grain yield and to the features involved in plant development.
(DH, cm) and the number of green leaves (NFV), using a mean of three plants per plot. The evaluations were run in six growth stages: 15 (1), 30 (2), 45 (3), 60 (4), 75 (5) and 90 (6) days after germination (DAG), as follow: EST1, NFV1, DH1, EST2, NFV2, DH2, EST3, NFV3, DH3, EST4, NFV4, DH4, EST5, NFV5, DH5, EST6, NFV6 and DH6, respectively. Also, was determined one hundred grain weight (MCG, g) and grain yield (PG, kg ha-1)
at maturity, correcting to 13% moisture.
At the beginning, it was estimated the correlation matrix between all features evaluated. After, was made the diagnosis of multicollinearity, identified from the condition number (NC), given by the quotient between the highest eigenvalue, which needs to be lower than 100. By the singular matrix X’X was established the level of multicollinearity, given by the product of the respective element of diagonal matrix X’X with the variance residual component. In case of collinearity detection, it was extracted problematic features, on the way that those features do not interfere in the coefficient estimation of the following analysis. After, were run the path analysis (CRUZ; REGAZZI, 1997) and the estimation of a multiple regression equation by the Stepwise method, following the methodology proposed by Draper and Smith (1966) and Elian (1988), with the remaining features over the grain yield and the one hundred grain weight, separately.
Variance analysis and mean multiple comparison test by Duncan at 5% of error probability were determined by the software SOC/NTIA (EMBRAPA, 1997), whereas the multicollinearity diagnosis, path analysis and multiple linear regression were determined by the software Genes (CRUZ, 2006).
Results and discussion
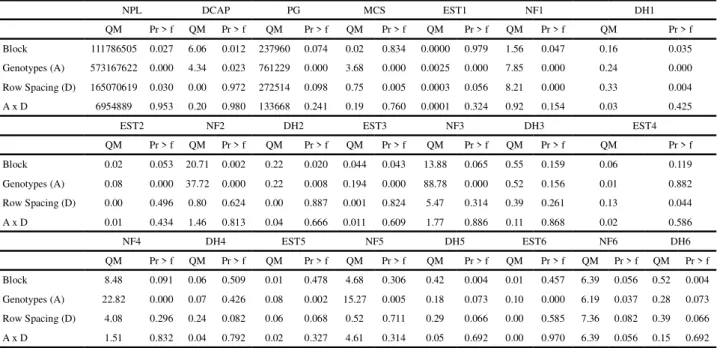
According to the data obtained in the experiment (TAB. 1), it was not detected significant interaction between genotypes x plant spacing in none of the features evaluated. Thereby, the study was focused on the main treatment effects. The lack of interaction between genotype x row spacing was also obtained by other authors as Modolo et al. (2010) and Kvitschal et al. (2010), working with corn plants. Thus, the genotypes had similar classifications regardless of row spacing, but averages can be altered in each row spacing.
About the genotypes, it was observed that they were significantly different for the features number of plants by hectare (NPL), head diameter (DCAP), grain yield (PG), one hundred grain weight (MCG), plant stature (EST1, EST2, EST3, EST5 and EST6), number of green leaves (NFV1, NFV2, NFV3, NFV4, NFV5 and NFV6) and stem
Table 1 - Analysis of variance, square means (QM), probability (Pr > f) for the features number of plants by hectare (NPL ha-1),
head diameter (DCAP, cm), grain yield (PG, kg ha-1), one hundred grain weight (MCG, g) and plant stature (EST1), number of
green leaves (NFV1) and stem diameter (DH1) at 15, 30, 45, 60, 75 and 90 days after germination of the genotypes and row spacing evaluated (0.40 and 0.80 m). UTFPR (Campus Dois Vizinhos), 2008
Gl: Block = 3; GL: Genotypes (A) = 5; Gl: Row Spacing (D) = 1; GL: AxD = 5
NPL DCAP PG MCS EST1 NF1 DH1
QM Pr > f QM Pr > f QM Pr > f QM Pr > f QM Pr > f QM Pr > f QM Pr > f Block 111786505 0.027 6.06 0.012 237960 0.074 0.02 0.834 0.0000 0.979 1.56 0.047 0.16 0.035 Genotypes (A) 573167622 0.000 4.34 0.023 761229 0.000 3.68 0.000 0.0025 0.000 7.85 0.000 0.24 0.000 Row Spacing (D) 165070619 0.030 0.00 0.972 272514 0.098 0.75 0.005 0.0003 0.056 8.21 0.000 0.33 0.004 A x D 6954889 0.953 0.20 0.980 133668 0.241 0.19 0.760 0.0001 0.324 0.92 0.154 0.03 0.425
EST2 NF2 DH2 EST3 NF3 DH3 EST4
QM Pr > f QM Pr > f QM Pr > f QM Pr > f QM Pr > f QM Pr > f QM Pr > f Block 0.02 0.053 20.71 0.002 0.22 0.020 0.044 0.043 13.88 0.065 0.55 0.159 0.06 0.119 Genotypes (A) 0.08 0.000 37.72 0.000 0.22 0.008 0.194 0.000 88.78 0.000 0.52 0.156 0.01 0.882 Row Spacing (D) 0.00 0.496 0.80 0.624 0.00 0.887 0.001 0.824 5.47 0.314 0.39 0.261 0.13 0.044 A x D 0.01 0.434 1.46 0.813 0.04 0.666 0.011 0.609 1.77 0.886 0.11 0.868 0.02 0.586
NF4 DH4 EST5 NF5 DH5 EST6 NF6 DH6
diameter (DH1 and DH2), and were not different for stem diameter (DH3, DH4, DH5 and DH6) and plant stature (EST4), these results shows that there are differences in the growth cycle in each genotype, mainly in the growth period studied (TAB. 2).
About spatial distribution, significant differences were observed for the features number of plants by hectare (NPL), one hundred grain weight (MCG), number of green leaves (NFV1) and stem diameter (DH1), and were not significant for grain yield (PG), head diameter (DCAP), plant stature (EST1, EST2, EST3, EST4, EST5 and EST6), number of green leaves (NFV2, NFV3, NFV4, NFV5 and NFV6) and stem diameter (DH2, DH3, DH4, DH5 and DH6) (TAB. 2). The mean plant stature was 1.75 m, being higher than results obtained by EMBRAPA (2003) in Campinas, SP, of 1.58 m. This highlights the climate effect over the crop, especially in regions with more long days and good rain distribution during the crop season, what can promote higher plant stature.
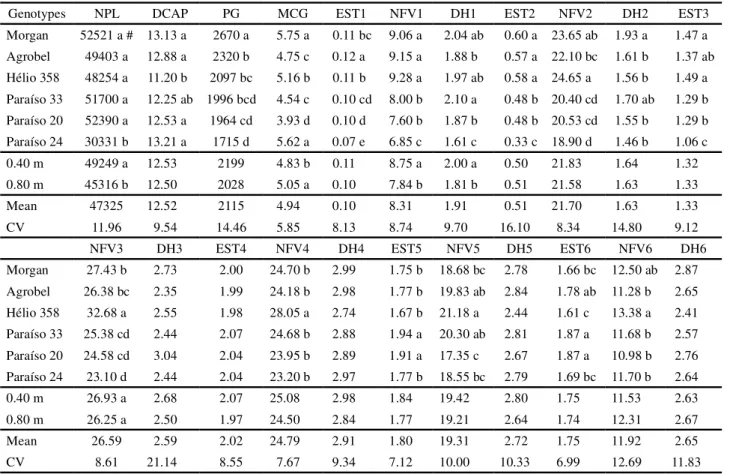
Table 2 - Mean, variation coefficient (CV) for the features number of plants by hectare (NPL ha-1), head diameter (DCAP, cm), grain yield
(PG, kg ha-1), one hundred grain weight (MCG, g), plant stature (EST1), number of green leaves (NFV1) and stem diameter (DH1) at 15, 30, 45,
60, 75 and 90 days after germination of the genotypes and row spacing evaluated (0.40 and 0.80 m). UTFPR (Campus Dois Vizinhos), 2008
#: Means not linked by the same letter in the column for genotypes and row spacing are different at 5% of error probability by Duncan’s test
Genotypes NPL DCAP PG MCG EST1 NFV1 DH1 EST2 NFV2 DH2 EST3
Morgan 52521 a # 13.13 a 2670 a 5.75 a 0.11 bc 9.06 a 2.04 ab 0.60 a 23.65 ab 1.93 a 1.47 a Agrobel 49403 a 12.88 a 2320 b 4.75 c 0.12 a 9.15 a 1.88 b 0.57 a 22.10 bc 1.61 b 1.37 ab Hélio 358 48254 a 11.20 b 2097 bc 5.16 b 0.11 b 9.28 a 1.97 ab 0.58 a 24.65 a 1.56 b 1.49 a Paraíso 33 51700 a 12.25 ab 1996 bcd 4.54 c 0.10 cd 8.00 b 2.10 a 0.48 b 20.40 cd 1.70 ab 1.29 b Paraíso 20 52390 a 12.53 a 1964 cd 3.93 d 0.10 d 7.60 b 1.87 b 0.48 b 20.53 cd 1.55 b 1.29 b Paraíso 24 30331 b 13.21 a 1715 d 5.62 a 0.07 e 6.85 c 1.61 c 0.33 c 18.90 d 1.46 b 1.06 c
0.40 m 49249 a 12.53 2199 4.83 b 0.11 8.75 a 2.00 a 0.50 21.83 1.64 1.32
0.80 m 45316 b 12.50 2028 5.05 a 0.10 7.84 b 1.81 b 0.51 21.58 1.63 1.33
Mean 47325 12.52 2115 4.94 0.10 8.31 1.91 0.51 21.70 1.63 1.33
CV 11.96 9.54 14.46 5.85 8.13 8.74 9.70 16.10 8.34 14.80 9.12
NFV3 DH3 EST4 NFV4 DH4 EST5 NFV5 DH5 EST6 NFV6 DH6
Morgan 27.43 b 2.73 2.00 24.70 b 2.99 1.75 b 18.68 bc 2.78 1.66 bc 12.50 ab 2.87 Agrobel 26.38 bc 2.35 1.99 24.18 b 2.98 1.77 b 19.83 ab 2.84 1.78 ab 11.28 b 2.65 Hélio 358 32.68 a 2.55 1.98 28.05 a 2.74 1.67 b 21.18 a 2.44 1.61 c 13.38 a 2.41 Paraíso 33 25.38 cd 2.44 2.07 24.68 b 2.88 1.94 a 20.30 ab 2.81 1.87 a 11.68 b 2.57 Paraíso 20 24.58 cd 3.04 2.04 23.95 b 2.89 1.91 a 17.35 c 2.67 1.87 a 10.98 b 2.76 Paraíso 24 23.10 d 2.44 2.04 23.20 b 2.97 1.77 b 18.55 bc 2.79 1.69 bc 11.70 b 2.64
0.40 m 26.93 a 2.68 2.07 25.08 2.98 1.84 19.42 2.80 1.75 11.53 2.63
0.80 m 26.25 a 2.50 1.97 24.50 2.84 1.77 19.21 2.64 1.74 12.31 2.67
Mean 26.59 2.59 2.02 24.79 2.91 1.80 19.31 2.72 1.75 11.92 2.65
CV 8.61 21.14 8.55 7.67 9.34 7.12 10.00 10.33 6.99 12.69 11.83
During the crop cycle the plant spacing can have a great influence in weed control, which could promote damages in the development of sunflower plants. As lower is the row and plant spacing, lower will be the available space to weed development, what promotes also a better plant distribution over the cultivated area. The competition with weeds can promote daily losses of 1.1 and 2.5 kg ha-1 in sunflower crop (oil and grain yield, respectively)
when the critical period of interference was from 21 to
30 DAG (BRIGHENTIet al., 2004). Other data research
has showed that grain yield losses can be from 20 to 70% when weed plants are competing with sunflower in the field (VIDAL; MEROTTO JÚNIOR, 2001).
When is talking about the number of plants by hectare (NPL), it was determined that the genotype Paraíso 24 presented much lower plants by area, differing from the other genotypes, which were not different each other and were almost the desired number (55,000 pl ha-1). The genotype with higher
grain yield (PG) was Morgan (2,670 kg ha-1) (TAB. 2). Grain
obtained by Castro (1999), whose values reached 2,100 kg ha-1, and Amorim et al. (2008), whose greatest grain yield was
1,642 kg ha-1. Also, Portoet al. (2008) obtained values from
1,401 to 2,381 kg ha-1 in four years of sunflower evaluation
in many places, including six Brazilian States studied (Goiás, Mato Grosso, Mato Grosso do Sul, Minas Gerais, São Paulo and Distrito Federal). The feature one hundred grain weight (MCG) was higher in Morgan and Paraíso 24 genotypes, being the worst in Paraíso 20. Comparisons between other features are described in Table 2.
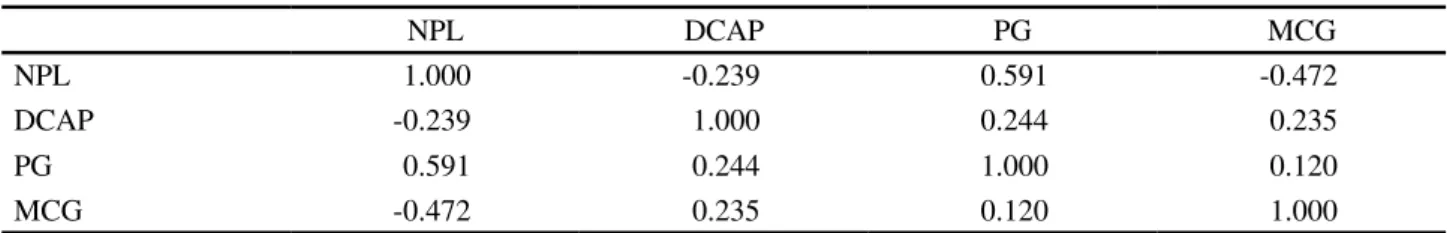
Some morphologic and production relations were established between features evaluated (TAB. 3). Increasing the number of plants by area is possible to obtain higher grain yield (rNPL,PG= 0.591), however with lower one hundred grain weight (rNPL,MCG= -0.472), as function of smaller head diameter (rNPL,DCAP= -0.239) and big amount of energy spent with plant development in beginning of the crop cycle. In other words, the number of plants by area is positively associated with plant initial development features
(EST, NFV and DCAP). Amorim et al. (2008) obtained
positive values of correlation between grain yield and head diameter (r = 0.63) and between grain yield and one thousand grain weight (r = 0.55), that data contrasts with the results presented in this study.
Before the estimation of direct and indirect effects of the growth features on grain yield and one hundred grain weight was run a multicollinearity analysis. It was verified that all explicative features under the grain yield and one hundred grain weight generated a condition number (NC) of 230.10 and 145.74, respectively (multicollinearity of moderate intensity). After the inspection of data set, was verified that the features responsible for the multicollinearity were EST1, NFV1, DH1, EST3, NFV3 and DH3, those features were eliminated, obtaining, after that, a NC of 64.42 and 42.03 for PG and MCG, respectively. In this way, is not expected any erroneous estimation of the path analysis coefficients or of the multiple linear regression.
About the determination coefficients (R2) generated
in path analysis, it was identified similar values for grain yield and one hundred grain weight, 0.777 and 0.745
Table 3 - Correlation matrix partial, between the features number of plants by hectare (NPL ha-1), head diameter (DCAP, cm), grain
yield (PG, kg ha-1) and one hundred grain weight (MCG, g). UTFPR (Campus Dois Vizinhos), 2008
respectively, what indicates that those features cam be described by the features evaluates, whereas the residual variable was 0.472 and 0.505, respectively.
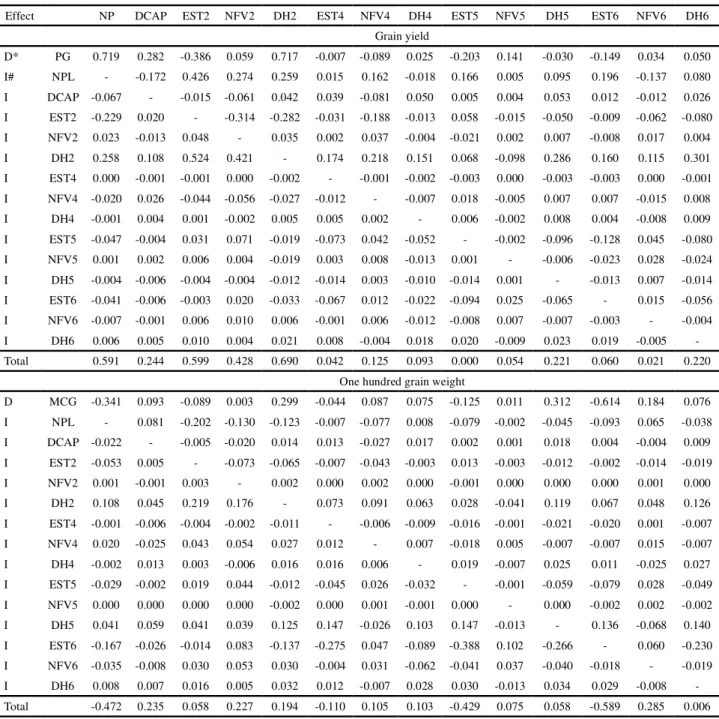
The most associated features with sunflower grain yield are the number of plants by hectare and stem diameter at 30 days, with high and positive direct effect, as well as the correlation coefficient (0.719 and 0.519 - NPL; 0.717 and 0.690 - DH2, respectively) (TAB. 4). The correlation between head diameter and grain yield indicates a true relation between them, once presents the magnitude and signal similar to their direct effect and can be considered moderate (r = 0.282), being small the effect of head diameter on grain yield. A different behavior can be observed with the features EST2 and NFV2 (0.599 and 0.428, respectively), where their high and positive correlation coefficients are not as function of direct but of indirect effects, via NPL and DH2, what implicates in strategic selection mistakes to chose tall plants and with many leaves, when is trying to increase crop grain yield. Other features evaluated did not present expressive effects on grain yield. So, the features with direct and relevant effects on sunflower grain yield are number of plants by area and stem diameter at 30 days. About the indirect effects, is possible to verify that plant stature at 30 days occasioned an indirect effect on grain yield, via stem diameter at 30 days.
The one hundred grain weight suffered a direct and negative effect of plant stature at 75 and 90 days, in other words, as higher is the plant stature lower will be the one hundred grain weight (TAB. 4). About indirect effects, none of the features presented higher than the residual value, which was a medium value (0.505), on this way, is impossible to infer about indirect effects on one hundred grain weight. Studies made by Amorimet al. (2008) showed that the features head diameter, percentage of normal grain and one thousand grain weight had direct and positive effects on grain yield, being possible to use that features in indirect genotype selection, what complement the data presented here.
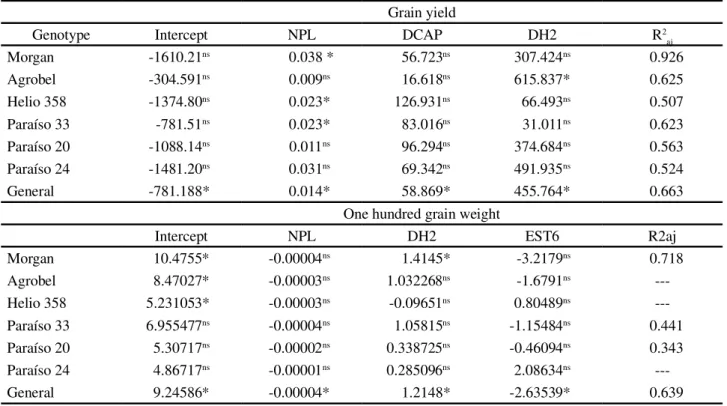
Multiple linear regression equations of sunflower grain yield and one hundred grain weight are presented on Table 5. It was detected significance for most of
NPL DCAP PG MCG
NPL 1.000 -0.239 0.591 -0.472
DCAP -0.239 1.000 0.244 0.235
PG 0.591 0.244 1.000 0.120
Table 4 - Direct and indirect effects on the main features grain yield (PG, kg ha-1) and one hundred grain weight (MCG, g) of the
secundary features number of plants by area (NPL), head diameter (DCAP), plant stature (EST), number of green leaves (NFV) and stem diameter (DH). UTFPR (Campus Dois Vizinhos), 2008
*D = direct effect;#I = indirect effect via
Effect NP DCAP EST2 NFV2 DH2 EST4 NFV4 DH4 EST5 NFV5 DH5 EST6 NFV6 DH6
Grain yield
D* PG 0.719 0.282 -0.386 0.059 0.717 -0.007 -0.089 0.025 -0.203 0.141 -0.030 -0.149 0.034 0.050 I# NPL - -0.172 0.426 0.274 0.259 0.015 0.162 -0.018 0.166 0.005 0.095 0.196 -0.137 0.080 I DCAP -0.067 - -0.015 -0.061 0.042 0.039 -0.081 0.050 0.005 0.004 0.053 0.012 -0.012 0.026 I EST2 -0.229 0.020 - -0.314 -0.282 -0.031 -0.188 -0.013 0.058 -0.015 -0.050 -0.009 -0.062 -0.080 I NFV2 0.023 -0.013 0.048 - 0.035 0.002 0.037 -0.004 -0.021 0.002 0.007 -0.008 0.017 0.004 I DH2 0.258 0.108 0.524 0.421 - 0.174 0.218 0.151 0.068 -0.098 0.286 0.160 0.115 0.301 I EST4 0.000 -0.001 -0.001 0.000 -0.002 - -0.001 -0.002 -0.003 0.000 -0.003 -0.003 0.000 -0.001 I NFV4 -0.020 0.026 -0.044 -0.056 -0.027 -0.012 - -0.007 0.018 -0.005 0.007 0.007 -0.015 0.008 I DH4 -0.001 0.004 0.001 -0.002 0.005 0.005 0.002 - 0.006 -0.002 0.008 0.004 -0.008 0.009 I EST5 -0.047 -0.004 0.031 0.071 -0.019 -0.073 0.042 -0.052 - -0.002 -0.096 -0.128 0.045 -0.080 I NFV5 0.001 0.002 0.006 0.004 -0.019 0.003 0.008 -0.013 0.001 - -0.006 -0.023 0.028 -0.024 I DH5 -0.004 -0.006 -0.004 -0.004 -0.012 -0.014 0.003 -0.010 -0.014 0.001 - -0.013 0.007 -0.014 I EST6 -0.041 -0.006 -0.003 0.020 -0.033 -0.067 0.012 -0.022 -0.094 0.025 -0.065 - 0.015 -0.056 I NFV6 -0.007 -0.001 0.006 0.010 0.006 -0.001 0.006 -0.012 -0.008 0.007 -0.007 -0.003 - -0.004 I DH6 0.006 0.005 0.010 0.004 0.021 0.008 -0.004 0.018 0.020 -0.009 0.023 0.019 -0.005 -Total 0.591 0.244 0.599 0.428 0.690 0.042 0.125 0.093 0.000 0.054 0.221 0.060 0.021 0.220
One hundred grain weight
D MCG -0.341 0.093 -0.089 0.003 0.299 -0.044 0.087 0.075 -0.125 0.011 0.312 -0.614 0.184 0.076 I NPL - 0.081 -0.202 -0.130 -0.123 -0.007 -0.077 0.008 -0.079 -0.002 -0.045 -0.093 0.065 -0.038 I DCAP -0.022 - -0.005 -0.020 0.014 0.013 -0.027 0.017 0.002 0.001 0.018 0.004 -0.004 0.009 I EST2 -0.053 0.005 - -0.073 -0.065 -0.007 -0.043 -0.003 0.013 -0.003 -0.012 -0.002 -0.014 -0.019 I NFV2 0.001 -0.001 0.003 - 0.002 0.000 0.002 0.000 -0.001 0.000 0.000 0.000 0.001 0.000 I DH2 0.108 0.045 0.219 0.176 - 0.073 0.091 0.063 0.028 -0.041 0.119 0.067 0.048 0.126 I EST4 -0.001 -0.006 -0.004 -0.002 -0.011 - -0.006 -0.009 -0.016 -0.001 -0.021 -0.020 0.001 -0.007 I NFV4 0.020 -0.025 0.043 0.054 0.027 0.012 - 0.007 -0.018 0.005 -0.007 -0.007 0.015 -0.007 I DH4 -0.002 0.013 0.003 -0.006 0.016 0.016 0.006 - 0.019 -0.007 0.025 0.011 -0.025 0.027 I EST5 -0.029 -0.002 0.019 0.044 -0.012 -0.045 0.026 -0.032 - -0.001 -0.059 -0.079 0.028 -0.049 I NFV5 0.000 0.000 0.000 0.000 -0.002 0.000 0.001 -0.001 0.000 - 0.000 -0.002 0.002 -0.002 I DH5 0.041 0.059 0.041 0.039 0.125 0.147 -0.026 0.103 0.147 -0.013 - 0.136 -0.068 0.140 I EST6 -0.167 -0.026 -0.014 0.083 -0.137 -0.275 0.047 -0.089 -0.388 0.102 -0.266 - 0.060 -0.230 I NFV6 -0.035 -0.008 0.030 0.053 0.030 -0.004 0.031 -0.062 -0.041 0.037 -0.040 -0.018 - -0.019 I DH6 0.008 0.007 0.016 0.005 0.032 0.012 -0.007 0.028 0.030 -0.013 0.034 0.029 -0.008 -Total -0.472 0.235 0.058 0.227 0.194 -0.110 0.105 0.103 -0.429 0.075 0.058 -0.589 0.285 0.006
the genotype features evaluated alone, and in the total amount when evaluated the genotypes group. Most of the determination coefficients were higher than 0.60, rising to 0.926. Based on the obtained values, is possible to estimate grain yield and one hundred grain weight from the presented features on Table 5. From these results can be identified the genotypes with desired characteristics to
participate in genetic improvement programs, developing, on this way, more productive cultivars. Following
this idea, Amorim et al. (2007) used univariate and
Table 5 - Multiple linear regression parameters of grain yield (PG, kg ha-1) and of one hundred grain weight (MCG, g), according
to the features number of plants by area (NPL, ha-1) head diameter (DCAP, cm), stem diameter at 30 days (DH2, cm) and plant
stature at 90 days (EST6, m), adjusted determination coefficient (R2aj) followed each genotype and multiple linear regression for
the genotypes group on corrected grain yield. UTFPR (Campus Dois Vizinhos), 2008 Grain yield
Genotype Intercept NPL DCAP DH2 R2
aj
Morgan -1610.21ns 0.038 * 56.723ns 307.424ns 0.926
Agrobel -304.591ns 0.009ns 16.618ns 615.837* 0.625
Helio 358 -1374.80ns 0.023* 126.931ns 66.493ns 0.507
Paraíso 33 -781.51ns 0.023* 83.016ns 31.011ns 0.623
Paraíso 20 -1088.14ns 0.011ns 96.294ns 374.684ns 0.563
Paraíso 24 -1481.20ns 0.031ns 69.342ns 491.935ns 0.524
General -781.188* 0.014* 58.869* 455.764* 0.663
One hundred grain weight
Intercept NPL DH2 EST6 R2aj
Morgan 10.4755* -0.00004ns 1.4145* -3.2179ns 0.718
Agrobel 8.47027* -0.00003ns 1.032268ns -1.6791ns
---Helio 358 5.231053* -0.00003ns -0.09651ns 0.80489ns
---Paraíso 33 6.955477ns -0.00004ns 1.05815ns -1.15484ns 0.441
Paraíso 20 5.30717ns -0.00002ns 0.338725ns -0.46094ns 0.343
Paraíso 24 4.86717ns -0.00001ns 0.285096ns 2.08634ns
---General 9.24586* -0.00004* 1.2148* -2.63539* 0.639
ns and*: not significant and significant at 5% of error, respectively
Conclusions
1. It was verified that sunflower genotypes does not present a differentiated behavior for the evaluated features in relation to spatial distribution. About genotypes, it was observed significant differences on grain yield (and in most of the evaluated features) between cultivars, highlighting the cultivar Morgan;
2. The direct effects on grain yield are observed for the features number of plants by area and stem diameter at 30 days, whereas the indirect effects are observed for plant stature via stem diameter, both at 30 days. One hundred grain weight was affected just by plant stature at the end of crop cycle, being negative that effect.
References
AMORIM, E. P.et al. Correlações e análise de trilha em girassol.
Bragantia, v. 67, n. 02, p. 307-316, 2008.
AMORIM, E. P.et al. Divergência genética em genótipos de girassol.
Ciência e Agrotecnologia, v. 31, n. 06, p. 1637-1644, 2007.
BEZERRA NETO, F. V. et al. Descritores quantitativos na
estimativa da divergência genética entre genótipos de mamoneira utilizando análises multivariadas.Revista Ciência Agronômica, v. 41, n. 02, p. 294-299, 2010.
BHERING, S. B.; SANTOS, H. G.Mapa de solos do Estado do Paraná:legenda atualizada. Rio de Janeiro: EMBRAPA/ IAPAR, 2008. 74 p.
BONACIN, G. A. et al. Características morfofisiológicas de
sementes e produção de girassol em função de boro no solo. Revista Brasileira de Engenharia Agrícola e Ambiental, v. 13, n. 02, p. 111-116, 2009.
BRAZ, M. R. S.; ROSSETTO, C. A. V. Crescimento de plantas de girassol em função do vigor de aquênios e da densidade de semeadura. Ciência Rural, v. 39, n. 07, p. 1989-1996, 2009. Available at: <http://www.scielo.br/pdf/cr/v39n7/a264cr1519. pdf>. Acessed: 04 nov. 2009.
BRIGHENTI, A. M. et al. Períodos de interferência de plantas daninhas na cultura do girassol.Planta daninha, v. 22, n. 02, p. 251-257, 2004.
CASTRO, C. et al. Doses e métodos de aplicação de nitrogênio
CRUZ, C. D.; REGAZZI, A. J.Modelos biométricos aplicados ao melhoramento genético. 2. ed. Viçosa: UFV, 1997. 390 p. DRAPER, N. R.; SMITH, R. Applied regression analysis. Nova York: John Wiley, 1966. 407 p.
ELIAN, S. N.Análise de regressão.São Paulo: IME/USP, 1988. 232 p. EMPRESA BRASILEIRA DE PESQUISA AGROPECUÁRIA (EMBRAPA). Girassol consolida-se como mais uma opção de outono-inverno. 2003. Available at: <http://www. embrapa.br/imprensa/noticias/2006/marco/noticia.2006-03-21.9229837225>. Acessed: 01 jul. 2009.
EMPRESA BRASILEIRA DE PESQUISA AGROPECUÁRIA (EMBRAPA). SOC: Ambiente de software NTIA, versão 4.2.2: Manual do usuário – ferramental estatístico. Campinas, 1997. 258 p.
GOMES, D. P. et al. Qualidade fisiológica e sanitária de sementes
de girassol produzidas na região de Timon, Maranhão.Summa Phytopathologic, v. 32, n. 03, p. 291-292, 2006.
KVITSCHAL, M. V.et al. Arranjo de plantas e produção de dois
híbridos simples de milho.Revista Ciência Agronômica, v. 41, n. 01, p. 122-131, 2010.
MAACK, R.Geografia física do Estado do Paraná.Curitiba: Banco do Desenvolvimento do Paraná, 1968. 350 p.
MARCOS FILHO, J. et al. Tamanho da semente e desempenho
do girassol: III. Comportamento das plantas em campo.Revista Brasileira de Sementes, v. 08, n. 02, p. 33-43, 1986.
MELLO, R. et al. Composição química, digestibilidade e cinética de degradação ruminal das silagens de híbridos de girassol em diferentes épocas de semeadura.Revista Brasileira de Zootecnia, v. 35, n. 04, p. 1523-1534, 2006.
MODOLO, A. J.et al. Desempenho de híbridos de milho na Região
Sudoeste do Paraná sob diferentes espaçamentos entre linhas. Revista Ciência Agronômica, v. 41, n. 03, p. 435-441, 2010.
OLIVEIRA, M. F. et al. Melhoramento do girassol.In: LEITE, R. M. V. B.; BRIGHENTI, A. M.; CASTRO, C. (Ed).Girassol no Brasil.Londrina: Embrapa Soja, 2005. p. 269-297.
PORTO, W. S. et al. Evaluation of sunflower cultivars for central
Brazil.Scientia Agricola, v. 65, n. 02, p. 139-144, 2008. SAAD, C. E. P. et al. Avaliação do gasto e Consumo voluntário
de rações balanceadas e semente de girassol para papagaios-verdadeiros (Amazona aestiva). Ciência e Agrotecnologia, v. 31, n. 04, p. 1176-1183, 2007.
SANGOI, L.et al.Sustentabilidade do colmo em híbridos de milho
de diferentes épocas de cultivo em função da densidade de plantas. Revista de Ciências Agroveterinárias, v. 01, n. 02, p. 63-72, 2002. SANTOS, H. et al. Conversão e balanço energético de sistemas de sucessão e de rotação de culturas. Ciência Rural, v. 31, n. 02, p. 191-198, 2001.
SOIL taxonomy. a basic system of soil classification for making and interpreting soil surveys, USDA-NRCS, 1999. 871 p. TOLLENAAR, M.; LEE, E. Yield potential, yield stability and stress tolerance in maize.Field Crops Research, v. 75, n. 01, p. 161-169, 2002.
UNGARO, M. R. G. et al.Parâmetros fisiológicos, produção de
aquênios e fitomassa de girassol em diferentes épocas de cultivo. Bragantia, v. 59, n. 02, p. 205-211, 2000.
VIDAL, R. A.; MEROTTO JÚNIOR, A.Herbicidologia. Porto Alegre: Edição do Autor, 2001, 152 p.
VIEIRA, O. V. Características da cultura do girassol e sua inserção em sistema de cultivo no Brasil. Revista Plantio Direto, v. 03, n. 88, p. 21-26, 2005.