RESEARCH ARTICLE
New insights into iron-gall inks
through the use of historically accurate
reconstructions
Rafael Javier Díaz Hidalgo
1, Ricardo Córdoba
1, Paula Nabais
2,3, Valéria Silva
2, Maria J. Melo
2,3*, Fernando Pina
2,
Natércia Teixeira
4and Victor Freitas
4Abstract
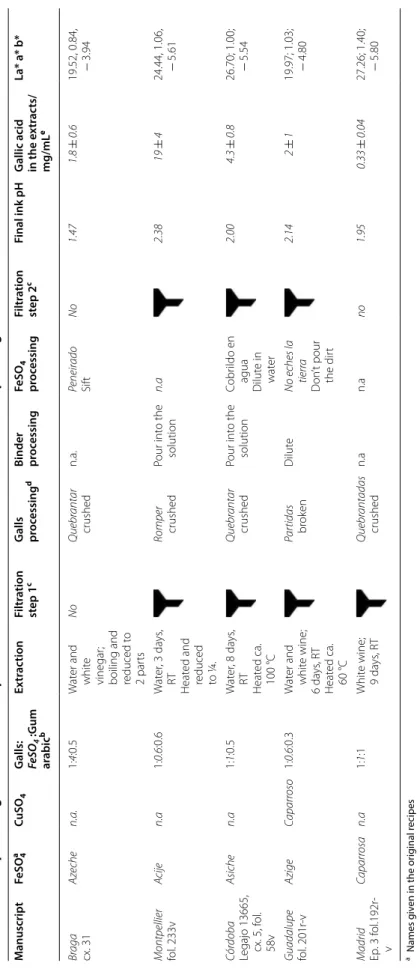
Iron-gall inks have been described as complexes of iron ions with gallic or tannic acids, available in gall extracts. To assess this working hypothesis, we have prepared medieval inks using ingredients and methods appropriate to the fifteenth to seventeenth centuries. The five historical inks studied were selected based upon research into Iberian written sources of medieval techniques. Results are supported by comparison with iron complexes with a well-char-acterized phenol counterpart: gallic, ellagic, and tannic acids as well as digalloyl and pentagalloyl glucose; as either precipitates or prepared as inks by adding gum arabic. Raman and infrared spectroscopies show that medieval writ-ing inks could not have been represented solely by iron complexes with gallic acid. Overall, writwrit-ing inks display the infrared signature of gallotannins, indicating that complexes of Fe3+-polygalloyl esters of glucose are also formed. Our results also show that the commercial tannic acid solution is far more complex than the gall extracts, and cannot be used to represent a gall extract (as described in historic written sources). High-performance liquid chromatography– electrospray ionisation, HPLC–ESI–MS, reveals that the concentration of gallic acid varies in the gall extracts, depend-ing on the extraction method and ink recipe. Importantly, in certain recipes, gallic acid is found as a minor compound, when compared with the galloyl esters of glucose.
Keywords: Iron-gall inks, Iberian written sources, Polygalloyl esters of glucose, Gallotannins, Reconstructions
© The Author(s) 2018. This article is distributed under the terms of the Creative Commons Attribution 4.0 International License
(http://creat iveco mmons .org/licen ses/by/4.0/), which permits unrestricted use, distribution, and reproduction in any medium,
provided you give appropriate credit to the original author(s) and the source, provide a link to the Creative Commons license,
and indicate if changes were made. The Creative Commons Public Domain Dedication waiver (http://creat iveco mmons .org/
publi cdoma in/zero/1.0/) applies to the data made available in this article, unless otherwise stated.
Introduction
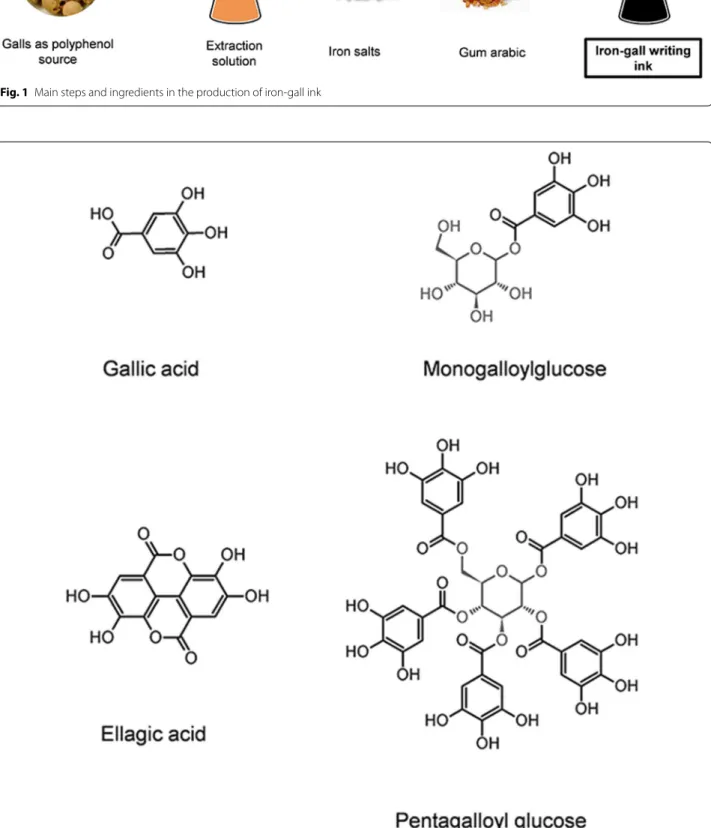
Degradation of manuscripts catalysed by iron-gall inks is a major conservation issue in heritage collections, pos-ing a serious threat to world written heritage. In Europe, iron-gall ink recipes are profusely described in medieval treatises that mention the use of plant extracts such as Quercus infectoria that were combined with iron salts [1–3], Fig. 1. The result of this mixture was an iron-poly-phenol complex, to which a polysaccharide such as gum arabic was usually added [4–8]. This writing ink recipe replaced, in part, carbon black inks that were more prone
to detachment [9]. Iron-gall inks were rendered obsolete in the twentieth century [9].
The chromophore in iron‑gall inks Iron‑polyphenol complex: the metal ion
Although the black colour is central to its use as a writ-ing ink, we know little of the origin of its colour as well as the way it turned brown over time. The fact that iron ions absorb in any region of the visible spectrum, depend-ing on the iron-coordination, only makes this subject more complex [4, 5]. In the phenolic compounds, the catechol ring with 2 hydroxyl or galloyl with 3 hydroxyl groups, provide binding sites for metal ions to chelate [4, 6, 7], Fig. 2. Because polyphenol ligands strongly stabilize Fe3+
over Fe2+, catecholate and gallate complexes of Fe2+
rap-idly oxidize in the presence of O2 to give Fe3+-polyphenol
complexes [4, 8]. This oxidation of Fe2+ is well
docu-mented in food & health research, although the chemistry
Open Access
*Correspondence: [email protected]
2 Department of Conservation and Restoration and LAQV-REQUIMTE, Faculty of Sciences and Technology, Universidade NOVA de Lisboa, 2829-516 Monte da Caparica, Portugal
Fig. 1 Main steps and ingredients in the production of iron-gall ink
of iron binding and redox processes is still not completely known [8]. Recently, Dangles et al. found evidence for the mechanism depicted in Scheme 1 [8]. In this mechanism (at neutral pH), the fast first step, the binding of Fe2+ to
the catechol, leads to its deprotonation. The large metal-binding stability constants displayed by Fe3+ are the
driv-ing force in the second step, where Fe2+ is converted into
Fe3+ [4]. In turn, Fe3+ may be reduced, forming quinone or
semiquinone species [4]. Based on this model, from these redox reactions no ester hydrolysis is expected, and conse-quently, no release of gallic acid to the solution is foreseen. Polyphenol metal ion complex: the ligands
From polyphenol research, it has been shown that “tan-nins” are found in galls largely as polygalloyl esters of glu-cose depicted in Fig. 2 [10], however the models used by the scientific community to describe the iron complexes assume that gallic or tannic acids are available in the gall extracts to bind iron [6, 11–15] (Fig. 2 and Additional file 1: Fig. S1). In fact, until 2016, the heritage commu-nity was using a structure for the IGI complex that was proved incorrect by Ponce and co-workers [6], Fig. 3. This group, using a reference prepared with gallic acid and iron (II) sulphate, proposed a new Fe3+ gallate structure
[Fe(C7O5H3)·xH2O, x = ~ 1.5−3.2], in which Fe3+ binds
to the carboxylic acid and three OH groups in the ligand (i.e., the acid and two of the three OH groups are depro-tonated) [6]. More recently, relevant contributions into Fe3+ coordination were made by Lerf and Wagner using
Mössbauer spectroscopy [15]; these authors proved that Fe3+-gallate complexes, binding through the carboxylate
group cannot be formed at the pH found in ink prepa-ration which is between 2 and 3. They propose that the iron center is best represented by iron oxyhydroxides and that these nanoparticles are “covered by a shell of polym-erized oxidation products of the phenols” [15]. Iron (II) sulphate was also detected in the precipitates, using both “balanced” and “unbalanced” inks,1 as described by Neevel [16].
In this work, we measure the concentration of gallic acid in gall extracts prepared from medieval recipes from selected written sources described in the next section, through high-performance liquid chromatography with a diode-array detector (UV–VIS) and with electrospray ionisation-mass spectrometry, HPLC–DAD and HPLC– ESI–MS, respectively. This will allow us to verify if gallic or tannic acids can be used as standards for gall extracts. Iron‑gall inks in technical written sources and references for the colour center
Medieval recipes typically contained the three basic ingredients described in Fig. 1: Fe2+ obtained from an
iron sulphate salt, a phenolic extract (tannins), and gum arabic [2, 9]. Additives, such as other metal ions and pig-ments, and different extraction conditions are described in medieval technical texts as exemplified in Table 1 and Additional file 1: Table S1 [2, 9, 17–21]. A rationale for the different procedures and ingredients that are called for the making of the inks will be discussed in this work.
Following a methodology already developed in our crit-ical edition of “The book on how to make all the colour paints for illuminating book” [22], we prepared medieval inks using the recipes that provide the ingredients and methods appropriate to their period [23]. The choice of writing inks is the result of research into selected Ibe-rian written sources of medieval techniques [17–21]. In
Scheme 1 Electron transfer from Fe2+ leads to the formation of Fe3+-phenol complexes, adapted from Dangles et al. [8]
Fig. 3 Basic unit of the structure for the Fe3+-gallate complex,
proposed by Ponce et al. [6] 1 "It assumes that there is an ideal molar ratio of FeSO
4·7H2O and TA 3.6:1, for a good, i.e., balanced ink. Other ratios are called unbalanced inks and supposed to have inferior properties and be more harmful to the paper on which the ink is written" [15].
Table 1 M ain st eps and ingr edien ts of the r ecip es in I berian tr ea tises (fif teen th t o se ven teen th); pH and gallic acid c onc en tr ation of final e xtr ac ts a Names g iv en in the or ig inal r ecipes b T he r atio is r epr esen ted in w eigh t and w as nor maliz ed f
or the gall mass; in the simple descr
iptiv e model c ommonly descr ibed in lit er atur e: “9
g/L gallic acid monoh
ydr at e; 40 g/L F eS O4 ·7H 2 O ; 80 g/L gum A rabic: 1: 4,4:8,9 ″ c St ep 1 , r ef er enc e t o filtr ation af ter e xtr ac tion; St ep 2 ref er enc e of a final filtr ation, af
ter the addition of
FeSO 4 d I n italic the or ig inal t er m f or the pr oc essing of galls , binder and ir on salt , f ollo w ed b y its English tr ansla tion e A ver age v alue , please see “ Exper imen tal ” sec tion f or mor e details; the r ef er enc e pr oposed in lit er atur e, pr epar
ed with gallic acid
, displa ys a c onc en tr ation of 9 mg/mL M anuscript FeSO 4 a CuSO 4 G alls: FeSO 4 :G um ar abic b Ex tr ac tion Filtr ation st ep 1 c G alls processing d Binder proc essing FeSO 4 pr oc essing Filtr ation st ep 2 c Final ink pH G
allic acid in the e
xtr ac ts/ mg/mL e La* a* b* Br aga cx. 31 A zeche n.a. 1: 4:0.5 W at er and whit e vinegar ;
boiling and reduced t
o 2 par ts No Q uebr antar crushed n.a. Peneir ado Sif t No 1.47 1.8 ± 0.6 19.52, 0.84, − 3.94 Montpellier fol. 233v Acije n.a 1: 0.6 :0.6 W at er , 3 da ys , RT Heat ed and reduced to ¼. Romper crushed Pour int o the solution n.a 2.38 19 ± 4 24.44, 1.06, − 5.61 Cór doba Legajo 13665, cx. 5, f ol . 58v Asiche n.a 1: 1:0.5 W at er , 8 da ys , RT Heat ed ca. 100 °C Q uebr antar crushed Pour int o the solution Cobr ildo en agua Dilut e in wat er 2.00 4.3 ± 0.8 26.70; 1.00; − 5.54 Guadalupe fol. 201r -v A zige Caparr oso 1: 0.6 :0.3 W at er and whit e wine; 6 da ys , R T Heat ed ca. 60 °C Par tidas brok en Dilut e No eches la tierr a D on ’t pour the dir t 2.14 2 ± 1 19.97; 1.03; − 4.80 Madrid Ep. 3 f ol .192r -v Caparr osa n.a 1: 1:1 Whit e wine; 9 da ys , R T Q uebr antadas crushed n.a n.a no 1.95 0.33 ± 0.04 27.26; 1.40; − 5.80
this work, these medieval inks were analysed, in situ, by colorimetry, Fourier transform infrared spectroscopy (FTIR) and Raman microscopy. Selected historical ink reproductions are compared with standards prepared complexing iron with gallic, ellagic and tannic acids as well as with digalloyl and pentagalloyl glucose, with and without gum arabic, Fig. 1 and Table 2. In addition, the simple model commonly used in literature for “bal-anced” iron-gall systems is also included: “The ink can be described as a suspension of an Fe(III) gallate precipi-tate in an aqueous solution containing iron sulphate, gal-lic acid and gum Arabic (9 g/L galgal-lic acid monohydrate; 40 g/L FeSO4·7H2O; 80 g/L gum Arabic: 1: 4,4:8,9).” [16,
24].
Methods/experimental
Except for the galls and gum arabic, all reagents used were of analytical grade. Spectroscopic or equivalent grade solvents and Millipore water were used for all the chro-matographic and spectroscopic studies. Gallnuts (“oak apples from Quercus infectoria”) and gum arabic in grains from A. senegal were purchased from Kremer. The phe-nolic compounds used to prepare references were: gallic acid (Aldrich), tannic acid (Aldrich), pentagalloyl glucose (Sigma), digalloyl glucose (Extrasynthese). Except for tan-nic acid, all compounds were pure. As discussed in detail
in “Quantification of gallic acid by HPLC–DAD and
HPLC–ESI–MS”, tannic acid proved to be a very complex
mixture of phenols, in which gallic acid was also present. Pomegranate was purchased in a local supermarket and a branch was taken from a fig tree in the Caparica Cam-pus. White wine vinegar and organic white wine were acquired in a local organic supermarket.
Preparation of historic ink reconstructions
The inks were prepared following the medieval treatises mentioned previously, Table 1 and Additional file 1:
Table S1. The translations may be found as Additional file 1: Table S1b. Unit conversion was based on “Equiva-lencias entre las pesas y medidas usadas antiguamente en las diversas provincias de España y las Legales del Sistema Métrico-Decimal”, 1886 and on “Memória sobre os pesos e medidas de Portugal, Espanha, Ingla-terra e França”, 1838 [25, 26]. This directory describes the units as used in the different cities, Additional file 1: Table S2.
Preparation of the references (iron‑polyphenol complexes) The iron-polyphenol complexes were prepared accord-ing to Ponce et al. [6], using the quantities described in Table 2. The polyphenols were completely dissolved in Millipore water, in an ultrasound bath, at 40 °C. Sub-sequently, Fe(II) sulphate heptahydrate was added to the stirred phenol solution. The latter was then divided in two: (a) to one half, gum arabic was added to pre-pare an ink that was continuously stirred for a week as indicated in Ponce et al. [6], until the pH dropped to ca. 1.8, indicating the gallic acid was deprotonated as it reacted with the iron ion; (b) the other half, was used to obtain the precipitate, hence no gum arabic was added. After a week, the precipitate was separated by centrif-ugation at a speed of 12,000 rpm, for 15 min, at 4 °C. The precipitate was collected and washed with water and centrifuged to remove unreacted starting materials and impurities. The precipitate was left to dry at room temperature, ground in an agate mortar, and then dried under vacuum.
Precipitates were analysed as powders. The historic inks were applied on filter paper, to be analysed by Raman spectroscopy and colorimetry, and glass slides, to be analysed by infrared spectroscopy, with the aid of a Pasteur pipette (ca. 50 μL per 1 cm2). The historic
inks were prepared and measured five times each to assess reproducibility.
Table 2 Preparation of the references for the iron-polyphenol complexes
a The ratio of gum arabic was based on the medieval treatises, where the galls:gum arabic ratio is mainly 1:0.5
b The ratio is in molarity and was normalized for the polyphenol concentration
Water/mL Polyphenol FeSO4 Gum arabica Polyphenol:FeSO4b Final pH
Gallic acid 40 2.35 mmol
0.442 g 2.35 mmol0.65 g
−
0.221 g 1:1 1.66
Ellagic acid 40 2.35 mmol
0.710 g 4.67 mmol1.3 g
−
0.355 g 1:2 2.21
Digalloyl glucose 1.75 0.103 mmol
0.005 g 0.103 mmol0.028 g
−
0.002 g 1:1 2.86
Pentagalloyl glucose 2.24 0.132 mmol
0.0125 g 0.264 mmol0.073 g
−
0.006 g 1:2 2.09
Tannic acid 20 1.16 mmol
1.99 g 2.35 mmol0.65 g
−
Colourimetry
L*a*b* coordinates were measured using a Microflash mobile colorimeter DataColor International with a Xenon lamp, over an 8 mm-diameter measuring area. CIELAB system was used defining the D65 illuminant and the 10º observer. The instrument was calibrated with a white tile and a black trap, and the measurements were performed on top of filter paper. The described values are the average value of three measurements, which proved to be sufficient to guarantee reproducibility.
In the Lab* cartesian system, L*, relative brightness, is represented in the z-axis. Variations in relative brightness range from white (L* = 100) to black (L* = 0). In the red-green y-axis, a* is usually found between − 60 (red-green) and + 60 (red). In the yellow-blue x-axis, b* ranges from − 60 (blue) to + 60 (yellow). The (a*, b*) pair represents the hue and chroma of the object.
Micro‑Fourier transform infrared spectroscopy
Infrared analyses were performed using a Nicolet Nexus spectrophotometer coupled to a Continuμm microscope (15 × objective) with an MCT-A detector. The spectra were collected in transmission mode, in 50 µm2 areas,
resolution setting 4 or 8 cm−1 and 128 scans, using a
Thermo diamond anvil compression cell. CO2 absorption
at ca 2400–2300 cm−1 was removed from the acquired
spectra (4000–650 cm−1). To improve the robustness of
the results, at least two spectra were acquired from dif-ferent sample spots.
Raman microscopy
Raman microscopy was carried out using a Horiba Jobin–Yvon LabRAM 300 spectrometer, equipped with a diode laser with an excitation wavelength of 785 nm and a maximum laser power of 37 mW measured at the sam-ple. Spectra were recorded as an extended scan. The laser beam was focused with a 50x Olympus objective lens and the spot size is of 4 μm. The laser power at the sample surface was between 9.5 and 0.37 mW. No evidence of ink degradation was observed during spectra acquisition. More than three spectra were collected from the same sample. A silicon reference was used to calibrate the instrument.
HPLC–DAD and HPLC–ESI–MS
HPLC–DAD: Merck-Hitachi Elite Lachrom with DAD L-2455; HLPC–ESI–MS: Finnigan Surveyor Plus HPLC fitted with a PDA Plus detector, an auto-sampler Plus and an LC quaternary pump plus coupled to a Finnigan LCQ Deca XP Plus mass detector equipped with an ESI source and an ion trap quadrupole. The mass spectrometer was operated in the negative-ion mode with the source, with a capillary temperature of 275 °C and capillary voltages of
4.5 kV. The mass spectra were recorded between 250 and 2000 m/z.
The stationary phase was a 150 × 4.6 mm i.d., 5 μm pore size reversed-phase C18 column (Merck) thermo-stated at 25 °C. The mobile phase was composed by sol-vent A, 1% (v/v) formic acid, and solsol-vent B, 100% (v/v) acetonitrile. The flow rate was 0.50 mL/min and the gradient method started with a linear gradient ranging from 90% A to 65% A in 50 min, then reaching 100% B in 5 min, a final isocratic gradient of 100% B during 7 min and a final re-equilibration isocratic gradient of 90% A for 5 min.
The historic inks, reproduced five times each, were analysed three times each. All gall extracts and full ink samples were filtered through a syringe filter of 0.45 µm pore size prior to HPLC/DAD–ESI/MS analysis. Refer-ence phenols were also injected, dissolved in water, and the detection was carried out at 280 nm. The compound quantification was achieved through a calibration curve. This calibration curve was obtained by injecting a stand-ard gallic acid (Sigma-Aldrich) with a concentration range of 0.253 to 0.00253 mg/mL and linear calibration curve (r2 = 0.9985). Each sample was prepared in
dupli-cate and injected in triplidupli-cate. Unknown concentrations were determined from the regression equation and the results were expressed as mean ± standard deviation and presented as mg mL−1 equivalents of gallic acid.
A study of the repeatability of this method from extrac-tion to HPLC analysis, used commonly in our labora-tory, gave a coefficient of variation of less than 5%. The detection (LOD) and quantification (LOQ) limits were 0.0000891 and 0,000267 mg mL−1 respectively, and they
were determined as reported elsewhere [27, 28]. Results and discussion
Selection criteria for Iberian medieval recipes dated from fifteenth to seventeenth centuries
Four Spanish and one Portuguese ink recipes, dated between fifteenth and seventeenth centuries, were cho-sen and are shown in Table 1. These recipes are repre-sentative of different institutions where the use of the writing ink was essential, such as universities, notaries, chanceries and the monastic world. The information found in these texts is critical for advancing the history of technique and the study of manuscript cultures. The first of the recipes, in chronological terms (1464), is described in Chancelaria de Braga cx. 31 (Chancellery of the Archi-episcopate of Braga) and stands out for being the old-est found in Portugal [17]. From the manuscript in the Faculty of Medicine of Montpellier, Montpellier H-490, completed between 1469–1480 and studied by Ricardo Córdoba [18], we reproduced the one recipe described for a writing ink (fol. 233v). A single writing ink recipe
is also found in the Archivo Histórico Provincial de Cór-doba, Sección de Protocolos Notariales de Córdoba (1474; cx. 5, fol. 58v), a text studied by E. Rodríguez [19], and directly related to the world of writing. On the other hand, in “Libro de los Oficios” of the Monastery of Santa Maria de Guadalupe, Cáceres, three iron-gall ink recipes are presented (fol. 201r-v). Studied by Kroustallis [20], this manual from the end of the fifteenth century con-tains scriptural knowledge linked to the monastic world. The fifth recipe is collected in the Recipe Book Ms. 9226 (fol. 192r-v) composed by Juan Vázquez del Mármol, a priest and book corrector of the Hispanic monarchy, between the sixteenth and the seventeenth centuries [21]. This manuscript covers a wide range of subjects, includ-ing woodworkinclud-ing, medicine, candle manufacture, and others. It also assembles a great number of recipes dedi-cated to writing inks [21]. Henceforth, the manuscripts and respective recipes will be designated as Braga, Mont-pellier, Córdoba, Guadalupe, and Madrid, respectively. Preparation of iron‑gall inks and reference compounds The ingredients and the steps to prepare the iron-gall inks and references are summarized in Tables 1 and 2, together with the pH of the dispersion. Colour coordi-nates are presented in Table 3.
All the recipes share three common raw materials: gall nuts, iron sulphate (in historical recipes named azije and/or caparrosa), and gum arabic. The galls and the metal ion produce dark inks, perceived as black, while the agglutinant facilitates its use as a written vehicle (by maintaining the complex dispersed in solution), Table 3. For all the ink recipes, a decrease in the pH was observed following the addition of iron sulphate, likewise in the references, Tables 1 and 2. This was expected considering that, in a very fast first step, Fe2+ binds to the catechol
ring; this binding implies a deprotonation and with it an increase in the concentration of H+ [8].
In the fifteenth century written sources, the term cap-arrosa has been used both for iron or copper sulphate, indistinctly. Caparrosa is mentioned in two recipes; in Oficios it is used together with azije, and in the sixteenth to seventeenth centuries Madrid as the only source for metal ions. Our experimental results proved that cop-per sulphate alone cannot produce a dark ink.2 So, in the seventeenth century recipe caparrosa possibly indicates a mineral containing iron sulphate or admixed with cop-per sulphate [29]. In all the recipes, the galls are broken into pieces (partidas) or crushed (quebrantadas) and not ground (moídas). According to the “Diccionario de la lengua Española from the Real Academia Española” [30], partir means to open or divide something into two or more parts, which differs from quebrar, which means to reduce to smaller fragments without grinding. Two cases mention the purification of caparrosa: one by placing it in solution to separate it from dirt (Guadalupe: no echar la tierra) and in Braga, where the iron sulphate is to be sifted to separate it from dirt (peneirado). Usually, fol-lowing the formation of the black colour, the solution is filtered; only two recipes do not mention a final filtration step, Braga and Madrid. The ingredients ratio in Table 1 show that the Braga recipe uses the highest quantity of azije; the amount of gum arabic is constant in all the recipes (ca. half of the galls in weight) except for Madrid, which presents a similar polyphenol:metal ion:gum ara-bic ratio, Table 1.
In the selected inks, the polyphenols could be extracted using water, vinegar mixed with water, white wine, or white wine mixed with water; the latter two resulted in the darkest inks, Table 1. The Madrid recipe clearly indi-cates the use of white wine to prepare the ink, while the selected recipe in Guadalupe only specifies the use of Table 3 L*, a*, b* colour coordinates for inks applied on filter paper
Inks based on L* a* b* Final colour
Gallic acid 50.54 − 0.04 − 1.48 Dark bluish
Ellagic acid 49.89 − 2.34 3.18 Dark yellowish-green
Digalloyl glucose 68.35 0.32 9.14 Dark yellow
Pentagalloyl glucose 48.09 1.16 − 4.70 Dark bluish-red
Tannic acid 33.53 0.92 − 5.02 Dark bluish-red
Braga (1464) 19.52 0.84 − 3.94 Very dark bluish-red
Montpellier (1469–1480) 24.44 1.06 − 5.61 Very dark bluish-red
Córdoba (1474) 26.70 1.00 − 5.54 Very dark bluish-red
Guadalupe (fifteenth centaury) 19.97 1.03 − 4.80 Very dark bluish-red
Madrid (sixteenth to seventeenth centuries) 27.26 1.40 − 5. 8 0 Very dark bluish-red
2 This was easily verified with the naked eye and Lab* coordinates were also obtained but are not shown in this work.
wine. Since more recipes of the same manuscript clearly indicate white wine, the latter was chosen for both the Madrid and the Guadalupe recipes.
Regarding additives, two recipes mention their use: Córdoba (fifteenth century), where pomegranate peel is added to the galls extraction, and Madrid (fifteenth to seventeenth centuries), with añil (indigo), refined sugar and alum. The latter was the easiest to apply on the sup-port, the ink being more fluid, darker and the shiniest, when compared with the other selected inks which do not have the presence of additives.
Art technological source research carried out as part of the InkCor project shows that, in most of the 253 reci-pes analysed (written or printed between 1000 and 1900), the iron (II) sulphate: gall nuts ratio varies between 1:4 and 4:1 in weight, with “an emphasis on proportions 6:6, 6:4, 6:3, 6:2” [2]. In this project, two historically repre-sentative model inks were proposed, based on “Aleppo” gall nuts with a low and a high copper content [2]. The first model ink displays the following ratio 1:1:0.5 for gall: vitriol: gum arabic in weight; in the vitriol, the cop-per sulphate, admixed with iron (II) sulphate is present in 0.01% in weight [2]. The Iberian recipes proportions are in agreement with this data, and the closest to the model historical ink with lower copper content is, pos-sibly, Braga’s.
Multi‑analytical characterization of iron‑gall inks Colorimetry
Colour coordinates L*a*b*, in Table 3 show that the Ibe-rian reconstructions are perceived as darker inks when compared to the standards (lower L* values). Iberian inks are characterized by negative b* values (blue) and close to zero, positive a* values (red axis), being perceived as a very dark bluish colour. Overall, these inks display similar Lab* values, with Braga and Guadalupe being the darker ones, with Lab* values of (19.52; 0.84; 3.94) and (19.97; 1.03; − 4.80), respectively, Table 3.
Iron-pentagallate and iron-tannate inks display the same hue, but are not as dark as the Iberian inks. Iron-gallate is characterized by very low a* and b* values and may be described as an achromatic colour grey, with L* = 50. Inks prepared with ellagic acid and digalloyl glu-cose differentiate from all the others because b* is found in the yellow axis. The higher L* values observed in the references may be related to a lower polyphenol concen-tration, compared with the reconstructions; this will be investigated in future work.
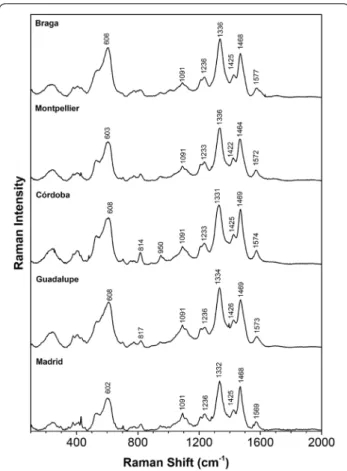
Raman microscopy
The spectra obtained for the ink reconstructions and for the iron-gallate, tannate, di- and penta-gallate based inks are represented in Figs. 4 and 5, respectively. The single
iron-gallate and tannate precipitates were also analysed and their spectra are available in Additional file 1: Fig-ures S2. Due to its fluorescence, it was not possible to obtain good S/N spectra for the iron-tannate precipitate and for this reason the bands are unresolved.
The first conclusion is that all spectra for the inks pro-duced display the fundamental pattern of an iron-gall ink as described by Lee et al. [31]. These authors consid-ered that the main four Raman bands used for a positive identification of iron-gall inks, in historic documents, are found around 1470 cm−1, between 1315 and 1350 cm−1,
490–640 cm−1 (broad) and at 400 cm−1, Table 4. A closer
examination of the region between 1315 and 1580 cm−1,
shows a well-resolved envelope characterized by two intense bands (ca 1325–36 and 1464–70 cm−1) and two
medium–low intensity peaks at (1422–1430 cm−1 and
1569–77 cm−1), the latter is found in many spectra as
a shoulder. We do not have theoretical predictions for vibrational spectra of iron-galloyl complexes, and this is the reason why we will support a first discussion of the Raman data on the study of Huguenin et al. on the acid–base equilibria of gallic acid [32]. In this publica-tion, based on theoretical predictions [33], Raman band
Fig. 4 Raman spectra for the ink reconstructions, applied on filter paper, λ = 785 nm
assignments for gallic acid (LH4) and its deprotonated
species (LH3−, LH22−, LH3−, L4−) are discussed [32]. The
Raman spectrum presented by Huguenin et al. compares well with the measured spectra, in solution, presented by Biles et al. [33]. The spectrum is dominated by two main bands at 1681 cm−1 and 1612 cm−1, the latter being the
more intense. Based on Biles et al.3 calculated values for this spectrum (presented as supplementary material in the original paper for the neutral, full protonated gal-lic acid ligand, LH4 [33]), Huguenin et al. attributes the
“vibrational band at 1681 cm−1 to the C=O stretch of the
carboxylic groups” and “the most intense band located at 1612 cm−1 to the symmetric C–C stretching vibrations of
the aromatic compound” [32]; the latter is slightly shifted during deprotonation of the phenol hydroxyl groups to 1604–7 cm−1. As expected, the 1681 cm−1 band is absent
in all deprotonated forms, and is substituted by the car-boxylate stretching at 1399 cm−1, and by a new broad
band with maxima between 1376 and 1383 cm−1, which
is a signature band for all deprotonated species; the fully deprotonated form, L4−, also displays a distinctive
OH deformation vibrational mode at 1249 cm−1. More
recently, Garrido et al. carried out DFT4 predictions and described the SERS spectra for the first mono-protonated form LH3−; it displays a different fingerprint when
com-pared with what published Huguenin et al. As we did not use SERS, we will not discuss this work any further [34].
Thus, based on Huguenin, Biles and co-workers’ assignments, and hypothesising that for the gallate com-plex we expect an LH3− based structure, we would expect
to observe the 1612 cm−1 C–C stretching in the aromatic
ring and a shift in the broad band at 1376 cm−1. This is
not the case; although we still find two main bands at circa 1470 cm−1 and a second in a variable interval 1325–
1345 cm−1. Presently, we cannot explain these very large
shifts.
For iron-gallate, Ponce et al. proposed the follow-ing assignments: C–C rfollow-ing vibrations at 1470 cm−1 and
COO− and C–O stretching modes between 1315 and
1350 cm−1. The two medium–low intensity bands, at
circa 1430 cm−1 and 1579 cm−1, were attributed to the
symmetrical and asymmetrical vibrations of a coordi-nated –COO−, to a metallic ion in their iron-gallate
pre-cipitate, stating that “the peak positions and separations (≈ 149 cm−1) are also consistent with the bridging
car-boxylate functionality observed in the crystal structure” [6]. Considering that Lerf and Wagner were not able to detect these type of bindings (with carboxylate) in their recent publications [15], we think that further research is necessary to extract more complete and consistent infor-mation from the iron-gallate Raman spectra.
Piantanida et al. presents band assignments for ink reconstructions [35]. However, in this publication the proposed assignments are largely based on the papers by Biles and Garrido; i.e., on gallic acid and not on galloyl-iron complexes. Considering that we will show that gallic acid is a minor component in most of our gall extracts
(“Quantification of gallic acid by HPLC–DAD and
HPLC–ESI–MS”) as well the contradictory assignments
present in literature, we prefer to not assign vibrational modes to the bands observed in this work, Table 4. At this point, we think it is better to use the signature bands for iron-gall inks as proposed by Lee et al. [31], and to dis-cuss the spectral patterns found. When we compare the historical inks with the iron-gallate reference, we observe that 2 of the 3 strong signature bands for iron-gall inks Fig. 5 Raman spectra for the iron-gallate, di-, penta-gallate and
tannate based inks, applied on filter paper, λ = 785 nm
3 Biles et al present a thorough discussion of the calculated vibrational modes, but we think this discussion falls outside the scope of this work [33]; however, we would like to stress that: (i) their calculated Raman spectra showed an "over expression" of C–H and O–H vibrational modes; (ii) they could "regard the vibrational bands at the 1695 and 1635 cm−1, respectively as vibrational modes characterized by CO stretch coordinates of the car-boxylic groups", but "all other internal coordinates are distributed between lots of vibrational modes and cannot be regarded as bases of characteristic
display shifts: The band at 1327 cm−1 for iron gallate, is
found in an interval between 1332 and 1336 cm−1 for
the historical ink reconstructions; likewise, the signa-ture broad band at 594 cm−1 for iron-gallate is shifted to
higher wavenumbers, displaying maxima in an interval between 601 and 608 cm−1. Considering both references
and gall inks, the bands that possibly display the higher variability are the signature band at 1325–1336 cm−1 and
the band found between 1577 and 1569 cm−1; the more
stable, is the signature band at 1468–1471 cm−1.
Over-all, the best match between the references prepared and the historical iron-gall inks lies in-between the spectral fingerprint of iron-PGG and iron-DiGG. This means that the spectra are better described by molecular structures that are characterized by an ester bond and not by a car-boxylate group.
MicroFTIR spectroscopy
In Fig. 6 a representative historical reconstruction, the Braga ink, is compared with the iron-gallate, digallate,
pentagallate and tannate precipitates. The infrared spectra of all ink reproductions are presented in Addi-tional file 1: Figure S3. Care must be taken with iron (II) sulphate, as its presence was observed by Lerf and Wagner in their Mossbaüer studies of the precipitates [15]. On the other hand, we do not expect gum arabic to interfere with the final fingerprint, as it was added in a low 0.5% in weight solution.
Contrary to the Raman discussion, the discussion of the infrared signature will be straightforward, because we rely on the research published by Falcão and Araújo on the characterization by infrared spectroscopy of “tannins”, extracted from several vegetal sources, used to dye leather [36, 37]. Spectra were acquired in ATR, but this will not be an obstacle to its use (small shifts and higher bands intensity will be expected on the lower wavenumber part of the spectra). In the nomen-clature used by these authors [36, 37], our polyphenol extracts are described as hydrolysable tannins based on the galloyl unit. For gallotannins the following infrared Table 4 Raman band positions for Iberian inks and
iron-polyphenol references; Raman bands used for a positive identification of iron-gall inks are shaded in blue,
in historic documents, occurred around 1470 cm−1, between 1315 and 1350 cm−1, 490–640 cm−1 (broad) and 400 cm−1
Iron-gallate Iron-tannate Braga Montpellier Córdoba Guadalupe Madrid Lee et al.[31]
401 w 378 w 404 w 403 m 403 m 403 m – 400 w 525 sh – 537 sh 528 sh 530 sh 528 sh 530 sh 594s 597 s 606 s 603 s 608 s 608 s 602 s 500–600 br – 796 br 773 w 771 w – 773 w – 710 w 814 m – 818 w 818 w 814 m 817 w 820 w 815 w 950 m 940 w 952 w 947 w 950 m – 947 w 960 w 1092 w 1091 m 1091 m 1091 m 1091 m 1091 m 1091 m 1095 w 1112 sh 1115 sh – – – – – – 1206 sh 1211 w – – – 1211 w – 1230 m 1233 m 1236 m 1233 m 1233 m 1236 m 1236 m 1230 w 1327 s 1325 s 1336 s 1336 s 1331 s 1334 s 1332 s 1315 s 1430 sh 1430 w 1425 m 1422 m 1425 m 1426 m 1425 m 1425 s 1470 s 1470 s 1468 s 1464 s 1469 s 1469 s 1468 s 1470 s 1575 m 1574 m 1577 m 1572 m 1574 m 1573 m 1569 m 1575 s
pattern is proposed5: (i) 4 common strong bands shared with all the other “tannins” (1615–1606 cm−1; 1442–
1446 cm−1; 1211–1196 cm−1; 1043–1030 cm−1); (ii) 2
characteristic bands of hydrolysable tannins (1731– 1704 cm−1; 1325–1317 cm−1); (iii) 3 distinctive bands
for gallotannins, that are described as marker bands (1088–1082 cm−1; 872–870 cm−1; 763–758 cm−1).
As clearly evidenced in Fig. 6 and depicted in Table 5, our iron-gall precipitates are characterized by these 9 bands together with the broad O–H stretching around 3340–70 cm−1. Both hydrolysable and gallotannins are
characterized by the ester functional group. Although the tentative band positions presented in Table 5 are assigned based on the findings of Falcão and Araújo and not DFT calculations, the sound work and clear reasoning of these authors enable us to prove that the infrared spectra of our iron-gall inks display bound gal-lotannins as the main molecular fingerprint. This is in
perfect agreement with the results on the gall extracts characterization that we will discuss in "Quantification
of gallic acid by HPLC–DAD and HPLC–ESI–MS", and
wherein we found gallic acid largely as a minor com-pound. This also agrees with the Raman data previously discussed in this study.
From the analysis of the infrared spectra depicted in Fig. 6, it is possible to distinguish between the four refer-ence complexes. The well-resolved peaks observed in the fingerprint region, although characterized by an overall similar pattern, display distinctive features, which will be explored in a future work. Again, in agreement with Raman conclusions, the best match for the iron-gall ink precipitate is with iron-pentagalloyl glucose; but, in this case, the C=O ester stretching mode is shifted to lower wavenumbers, Table 5.
In agreement with Lerf and Wagner [14, 15], the data gathered show that the main chromophore in the iron-gall inks we reproduced is not based on a carbox-ylate-iron binding, as suggested in previous literature, including the recent work by Ponce et al. [6, 11, 12]. As an alternative to iron-carboxylate binding, colour may be developed through the catechol ring, with 2 OH or gal-loyl with 3 OH groups providing binding sites for metal ions to chelate, as has already been proposed in different scientific areas of research [38; also see 4, 7, 8, 13].
Finally, comparing the spectral features of our spectra with the sumac spectrum presented by Falcão and Araújo [36], observing the much higher intensity of the band at 1088–1082 cm−1, we may conclude that we have a
rele-vant amount of iron (II) sulphate in all ink samples. Quantification of gallic acid by HPLC–DAD and HPLC–ESI–MS Due to a large variability in the phenolic compound con-centration in the first HPLC–DAD analysis, the historic inks were each reproduced five times. This variability is easily explained by the nature of the phenolic and poly-phenolic compounds that are naturally produced by plants as a response to external aggressions. In this case, galls are produced in response to the presence of insects. The phenolic composition of each gall, on each tree, may depend on climate, weather, time of the year, irrigation conditions, etc. The main compounds found by HPLC are free gallic acid and derivatives of gallic acid such as galloyl glucose, digalloyl glucose, trigalloyl glucose, tetra-galloyl glucose, pentatetra-galloyl glucose, hexatetra-galloyl glucose and heptagalloyl glucose. Gallic acid concentration in the gall extracts is presented in Table 1 and in Fig. 7, a repre-sentative chromatogram of the species distribution found in all ink recipes is given using the Braga ink (Additional file 1: Fig. S4). These are characterized by complex high-performance liquid chromatography elution patterns, which include gallic acid but also di- to hepta-polygalloyl Fig. 6 Infrared spectrum of Braga ink compared with the spectra of
iron-gallate, di-galloate, penta-galloate and tannate precipitates (for the meaning of the colour bars, please see Table 5)
5 In brackets are indicated the spectral intervals where the bands may be found.
esters of glucose. A more detailed analysis of the molecu-lar structure for the polygalloyl esters will be presented in future work. HPLC–DAD and HPLC–ESI–MS data reveals that the percentage of gallic acid varies in the gall extracts, depending on the extraction method and ink recipe, from ca. 0.3 to 1.8 g/L. This data also shows that, except for the Braga ink, iron (II) sulphate is found in very low amounts when compared with the 9 g gallic acid to 40 g iron (II) sulphate proposed for a balanced ink, in literature. Córdoba and Montpellier inks display the high-est content of gallic acid; the other three recipes Braga, Madrid and Guadalupe have similarly low values. We still have not found a reason that could explain the differ-ences found in acid gallic concentration.
The gall extracts chromatographic profiles are very interesting, where HPLC–ESI–MS clearly shows the presence of a dominant fraction of polygalloyl esters of glucose, Fig. 7. The results obtained from the aqueous solution of commercial tannic acid surprised us, and for that reason, the chromatogram obtained is presented in Fig. 7. We were expecting a maximum of two peaks, cor-responding to some fraction of gallic acid and a broad band for the isomers of decagalloylglucoses [39]. Instead, the chromatographic profile is much more complex than the gall extracts obtained following fifteenth to seven-teenth centuries recipes. Definitively, commercial tannic acid cannot be described, as depicted in the commercial catalogues, as penta-m-digalloyl-glucose (meta-dep-sidic 1,2,3,4,6 pentakis-O-digalloyl-β-d-glucopyranose), Table 5 Infrared bands for Iberian inks and the iron-gallate and tannate precipitates
Fe-gallate Fe-tannate Fe-PGG Braga Montpellier Córdoba Guadalupe Madrid Assignments
711w - - - 700vw n.a. 763w 757w 761 w 760w 761w 762vw 759w 765vw marker gallotannins 814w - 823 w - - - - -867w 870vw 866 w 871w 870w 872 w 867w 870vw marker gallotannins 965w - 1000 sh 978sh 977w 977 w 977 w 983 w n.a. - 1031 m 1041 sh 1042sh 1042 sh 1038 sh 1035 sh 1040 sh C-O str vib 1088 s 1087 m 1086 m 1086 s 1087 s 1091 s 1085 s 1080 s marker gallotannins 1213 sh 1200 s 1204 s 1206 m 1207 m 1208 sh 1207 m 1216 sh C-O str vib 1333 m 1321 s 1344 s 1346 m 1346 m 1340 w 1336 m 1345 m C-O sym str (ester) 1430 w 1444 m 1429 w 1446 m 1446 m 1448 w 1448 w 1448 w aromatic st vib - 1534 w - 1538 w 1540 w 1540 vw 1532 w 1540 sh n.a. 1577 m - 1578 w - 1612 m 1615 m 1615 m 1616 m - 1616 m 1624 m aromatic str vib - - - 1643 m - -1678 m 1701 s 1697 s 1708 m 1700 m 1697 sh 1701 m 1685 sh C=O str (ester) - - - 2943 sh 2941 sh 2950 sh 2948 sh 2945 sh C-H str (polyphenols; gum arabic)
Shadings and assignments for iron-gall inks are based on Falcão and Araújo [36, 37]: grey shading, characteristic common bands for “tannins”; orange shading,
vibrations presented by hydrolysable tannins; blue shading, distinctive bands, marker bands for gallotannins str stretching
Additional file 1: Figure S1, and it is not suitable for pre-paring a reference medieval iron-gall ink. As described by Quideau et al. [39], commercial tannic acid is in fact “a complex and varying mixture of different gallotannins and simpler galloylglucoses”. This could have been antici-pated as tannic acid is described in literature as being extracted from gall-nuts “by boiling ground-up nuts in acidic aqueous solution” [40]. In the future, we plan to study “true” iron-decagalloylglucoses complexes, but we anticipate it will not be an easy task since these molecular structures equilibrate into meta/para-depsidic isomeric mixtures in solution [39].
Conclusions
Based on a multi-analytical research of 5 iron-gall ink reconstructions from 5 historical recipes made on the Iberian Peninsula between fifteenth and seventeenth centuries as well as five different reference precipitates/ inks (standards), we show that iron-gallate or tannate complexes do not accurately represent the chromophores present in medieval iron-gall inks. Reference precipi-tates/inks were made combining iron sulphate with dif-ferent polyphenols (tannic, gallic and ellagic acid, as well as di- and pentagalloyl glucose). Colourimetry, microRa-man spectroscopy, microFTIR and HPLC–DAD/ESI–MS were jointly used to characterize the reconstructed and reference inks.
Quantification of gallic acid both by HPLC–DAD and HPLC–ESI–MS show that it is a minor compound in most of the gall extracts prepared following Iberian reci-pes; these extracts are characterized by complex high
performance liquid chromatography elution patterns, which include gallic acid as well as the derivatives of gal-lic acid in the form of polygalloyl esters of glucose also named gallotannins (mono- to hepta-galloyl glucose structures were identified). This agrees with the results of Raman and infrared spectroscopies. In fact, based on the study of vegetable tannins used to transform animal skins into leather [36], it was possible to show that the infrared spectra display the fingerprint of an ester-based polyphenol, more precisely a gallotannin. On the other hand, Raman band assignments published in the lit-erature refer largely to gallic acid or to iron-gallate com-plexes and therefore could not be fully exploited in this work. Raman and infrared spectra, acquired in this work, indicate that iron-pentagalloyl based ink/precipitate best represent medieval inks.
Overall, historically accurate reconstructions of medie-val inks and knowledge on the chemistry of polyphenolic compounds used to produce leather, since ancient times, have been crucial to bringing new insights into iron-gall inks complex structure and compounds formed within it, which will advance future preparations of model inks. Quality and representative model ink are critical for stud-ies of iron-gall ink behaviour or when testing new con-servation treatments.
Further research characterizing a wider number of medieval recipes, from different geographic provenances, is necessary, but this work and its methodology have already had an impact on our fundamental knowledge on a medieval iron-gall ink molecular composition and its conservation. The paradigm must shift from model compounds acid gallic-based to polygalloy ester-based. In alternative to iron-carboxylate binding, we argue that colour may be developed through the catechol ring, with 2 OH or galloyl with 3 OH groups providing binding sites for metal ions to chelate. This issue will be addressed in future research.
Additional file
Additional file 1. Iron-gall inks’ molecular data and recipes.
Authors’ contributions
MJM contributed with the conception and design of the research work; acqui-sition, analysis and interpretation of data. NT, in collaboration with VF, was responsible for the quantification of gallic acid and other relevant polyphenols by HPLC–DAD and HPLC–ESI–MS. PN contributed with the preparation of the reference iron complexes, the acquisition of the spectral data, Raman and infrared, as well as with the colorimetric measurements; and with the writing and revision of the version to be published. RJDH and RC oversaw the research on the Iberian written sources, and the first contributed with the reconstruc-tions of historic iron-gall inks, and the writing and revision of the version to be published. VS, at her master thesis, performed the first ink reconstructions and Fig. 7 HPLC–DAD chromatograms of a commercial tannic acid
solution and the Braga extract. Gallic acid is the high intensity peak that elutes at ca. tr = 5 min
respective molecular characterization. FP contributed with the interpreta-tion of the chemical origins of colour in iron-complexes. All authors read and approved the final manuscript.
Author details
1 Departamento de Ciencias de la Antigüedad y de la Edad Media, Facultad de Filosofía y Letras, Universidad de Córdoba, Córdoba, Spain. 2 Department of Conservation and Restoration and LAQV-REQUIMTE, Faculty of Sciences and Technology, Universidade NOVA de Lisboa, 2829-516 Monte da Caparica, Portugal. 3 IEM, Faculty of Social Sciences and Humanities, Universidade Nova de Lisboa, Avenida de Berna 26-C, 1069-061 Lisbon, Portugal. 4
QUI-NOA-LAQV-REQUIMTE, Departamento de Química e Bioquímica, Faculdade de Ciências, Universidade do Porto, Rua do Campo Alegre, 687, 4169-007 Porto, Portugal.
Competing interests
The authors declare that they have no competing interests.
Availability of data and materials
Most of the data on which the conclusions of the manuscript rely is published in this paper, and the full data is available for consultation on request.
Consent for publication
Not applicable.
Ethics approval and consent to participate
Not applicable.
Funding
Portuguese Science Foundation, FCT-MCTES: project
PTDC/QUI-OUT/29925/2017; post-doctoral scholarship FOOD-RL1-PHD-QUINOA-01-02, CORES PhD programme for PD/BD/105895/2014; scientific infrastructures RECI/QEQ-MED/0330/2012, REM2013 and the Associated Laboratory for Sustainable Chemistry—Clean Processes and Technologies—LAQV, which is financed by national funds from FCT/MEC (UID/QUI/50006/2015) and co-financed by the ERDF under the PT2020 Partnership Agreement (POCI-01-0145-FEDER-007265). Support was also given by the Calouste Gulbenkian Foundation award ‘Estímulo à Investigação 2016′ (146301). FEDER funds through COMPETE, POPH/FSE, QREN. The Spanish Ministry of Economy and Competitiveness & the European Regional Development Fund for project HAR2015-67619-P.
Publisher’s Note
Springer Nature remains neutral with regard to jurisdictional claims in pub-lished maps and institutional affiliations.
Received: 7 June 2018 Accepted: 25 October 2018
References
1. Quideau S, Deffieux D, Douat-Casassus C, Pouységu L. Plant polyphenols: chemical properties, biological activities, and synthesis. Angew Chem Int Ed. 2011;50:586–621.
2. Stijnman A. Iron-gall inks in history: ingredients and production. In: Kolar J, Strlič M, editors. Iron–gall Inks: on manufacture, characterization, degra-dation and stabilization. Ljubljana: National and University Library; 2006. p. 25–167 (and Appendix 4).
3. Vivas N, Bourgeois G, Vitry C, Glories Y, Freitas V. Determination of the composition of commercial tannin extracts by liquid secondary ion mass spectrometry (LSIMS). J Sci Food Agric. 1996;72:309–17.
4. Perron NR, Brumaghim JL. A review of the antioxidant mechanisms of polyphenol compounds related to iron binding. Cell Biochem Biophys. 2009;53:75–100.
5. Bartecki A, Burgess J. The colour of metal compounds. 1st English ed. Amsterdam: Gordon and Breach Science Publishers; 2000.
6. Ponce A, Brosto LB, Gibbons SK, Zavalij P, Viragh C, Hooper J, Gaskell KJ, Eichhorn B. Elucidation of the Fe(III) Gallate Structure in Historical Iron-gall Inks. Anal Chem. 2016;88:5152–8.
7. Andjelković M, Van Camp J, De Meulenaer B, Depaemelaere G, Socaciu C, Verloo M, Verhe R. Iron-chelation properties of phenolic acids bearing catechol and galloyl groups. Food Chem. 2006;98(1):23–31.
8. Nkhili E, Loonis M, Mihai S, El Hajji H, Dangles O. Reactivity of food phenols with iron and copper ions: binding, dioxygen activation and oxidation mechanisms. Food Funct. 2014;5:1186–202.
9. Zerdoun-Bat Yehounda M. Les encres noires au Moyen Âge (jusqu’à 1600). 1st ed. Paris: CNRS Éditions; 2003.
10. Han J, Wanrooij L, van Bommel M, Quye A. Characterisation of chemical components for identifying historical Chinese textile dyes by ultra high performance liquid chromatography–photodiode array–electrospray ionisation mass spectrometer. J Chromatogr A. 2016;1479:87–96. 11. Wunderlich CH. Geschichte und Chemie der Eisengallustinte. Restauro.
1994;6:414–21.
12. Krekel C. The chemistry of historical iron-gall inks: understanding the chemistry of writing inks used to prepare historical documents. Int J For Doc Exam. 1999;5:54–8.
13. Feller RK, Cheetham AK. Fe (III), Mn(II), Co(II), and Ni(II) 3, 4, 5-trihy-droxybenzoate (gallate) dihydrates; a new family of hybrid framework materials. Solid State Sci. 2006;8(9):1121–5.
14. Wagner FE, Lerf A. Mössbauer spectroscopic investigation of FeII and FeIII 3, 4, 5-trihydroxybenzoates (Gallates)–proposed model com-pounds for iron-gall inks. Z Anorg Allg Chem. 2015;641(14):2384–91. 15. Lerf A, Wagner FE. Model compounds of iron-gall inks—a Mössbauer
study. Hyperfine Interact. 2016;237(1):36.
16. Neevel JG. Phytate: a potential conservation agent for the treatment of ink corrosion caused by irongall inks. Restaurator. 1995;16(3):143–60. 17. Azevedo Santos MJ. Da Visigótica à Carolina a escrita em Portugal de
882–1172: Aspectos Técnicos e Culturais. Lisboa: Fundaçao Calouste Gulbenkian: Junta nacional de investigaçao científica e tecnológica; 1994. p. 303–8.
18. Córdoba de la Llave R. Un recetario técnico castellano del siglo XV: el manuscrito H490 de la Facultad de Medicina de Montpellier. En la España medieval. 2005;28:7–48.
19. Rodríguez Díaz EE. Técnicas de escritura y del libro manuscrito. In: García Ballester L, editor. Historia de la Ciencia y de la Técnica en la Corona de Castilla, vol. 2. Valladolid: Junta de Castilla y León, Consejería de Educación y Cultura; 2002. p. 590.
20. Kroustallis S. El oficio de Pergaminería y el Reglamento del Scriptorium del Monasterio de Ntra. Sra. de Guadalupe. In: Brinquis MS, Cabanes ML, editors. Libro de los Oficios del Monasterio de Nuestra Señora de Guadalupe, vol. 2. Badajoz: Secretaría General Técnica del Ministerio de Cultura, Subdirección General de Publicaciones, Información y Docu-mentación, Junta de Extremadura, Consejería de Cultura y Turismo y Monasterio de Guadalupe; 2007. p. 246–7.
21. Criado Vega MT. Tratados y recetarios de técnica industrial en la España medieval. La Corona de Castilla, siglos XV–XVI. Córdoba: Universidad de Córdoba: Servicio de Publicaciones; 2013.
22. Melo MJ, Castro R, editors. The “Book on How to Make Colours”, o livro de como se fazem as cores das tintas todas. Medieval Colours for Practitioners; 2016. http://www.dcr.fct.unl.pt/LivCo moFaz emCor es. Accessed 21 Aug 2017.
23. Vitorino T, Melo MJ, Carlyle L, Otero V. New insights into brazilwood lake pigments manufacture through the use of historically accurate reconstructions. Stud Conserv. 2016;61(5):255–73.
24. Rouchon V, Belhadj O, Duranton M, Gimat A, Massian P. Application of Arrhenius law to DP and zero-span tensile strength measurements taken on iron-gall ink impregnated papers: relevance of artificial age-ing protocols. Appl Phys A. 2016;122:773.
25. Equivalencias entre las pesas y medidas usadas antiguamente en las diversas provincias de España y las legales del sistema métrico decimal, publicadas de Real Orden Dirección General del Instituto Geográfico y Estadístico. Madrid: Imp. de la Dirección General del Instituto Geográ-fico y Estadístico; 1886.
26. Barreiros JF. Memória sobre os pesos e medidas de Portugal, Espanha, Inglaterra e França: que se empregäo nos trabalhos do corpo de engenheiros e da arma de artilheria. Lisboa: Typog. da Acad. Real das Sciencias; 1838.
27. FDA. Guidance for industry—studies to evaluate the metabolism and residue, kinetics of veterinary drugs in food-producing animals:
validation of analytical methods used in residue depletion studies. Washington: U.S. Department of Health and Human Services; 2015. 28. García-Estévez I, Escribano-Bailón MT, Rivas-Gonzalo JC, Alcalde-Eon C.
Validation of a mass spectrometry method to quantify Oak Ellagitannins in Wine samples. J Agric Food Chem. 2012;60(6):1373–9.
29. Nabais P, Melo MJ, Castro R, Sousa L, Videira Lopes G. Singing with light: an interdisciplinary study on the medieval Ajuda Songbook. JMIS. 2016;8:283–312.
30. Real Academia Española. Diccionario de la lengua Española; 2017. http:// dle.rae.es/?w=dicci onari o. Accessed 27 Aug 2018.
31. Lee AS, Mahon PJ, Creagh DC. Raman analysis of iron-gall inks on parch-ment. J Vib Spectorsc. 2006;41(2):170–5.
32. Huguenin J, Saad O, Bourson P. Monitoring deprotonation of gallic acid by Raman spectroscopy. J Raman Spectrosc. 2015;46(11):1062–6. 33. Billes F, Mohammed-Ziegler I, Bombicz P. Vibrational spectroscopic
study on the quantum chemical model and the X-ray structure of gallic acid, solvent effect on the structure and spectra. Vib Spectrosc. 2007;43(1):193–202.
34. Garrido C, Diaz-Fleming G, Carcamo JJ, Campos-Vallette MM. Surface enhanced Raman scattering and theoretical characterization of the gallic acid anion silver surface interaction. Vib Spectrosc. 2017;93:12–6.
35. Piantanida G, Menart E, Strlic M. Classification of Iron-based Inks by means of micro-Raman spectroscopy and multivariate data analysis. J Raman Spectrosc. 2013;44(9):1299–305.
36. Falcão L, Araújo MEM. Tannins characterization in historic leathers by complementary analytical techniques ATR-FTIR, UV-Vis and chemical tests. J Cult Herit. 2013;14:499–508.
37. Falcão L, Araújo MEM. Vegetable tannins used in the manufacture of historic leathers. Molecules. 2018;23:1081.
38. Rahim MA, Kempe K, Muellner M, Ejima H, Ju Y, van Koeverden MP, Suma T, Braunger JA, Leeming MG, Abrahams BF, Caruso F. Surface-confined amorphous films from metal-coordinated simple phenolic ligands. Chem Mater. 2015;27(16):5825–32.
39. Sylla T, Pouységu L, Da Costa G, Deffieux D, Monti JP, Quideau S. Gal-lotannins and tannic acid: first chemical syntheses and in vitro inhibitory activity on Alzheimer’s amyloid β-peptide aggregation. Angew Chem Int Ed. 2015;54:8217–21.
40. Giorgi R. Inorganic nanomaterials for the deacidification of paper. In: Baglioni P, Chelazzi D, editors. Nanoscience for the conservation of works of art. Cambridge: The Royal Society of Chemistry; 2013. p. 396–429.