SEA SURFACE TEMPERATURE DISTRIBUTION IN THE AZORES REGION.
PART II: SPACE-TIME VARIABILITY AND UNDERLYING MECHANISMS
IGOR BASHMACHNIKOV, VIRGINIE LAFON & ANA MARTINS
BASHMACHNIKOV,I., V.LAFON & A.MARTINS 2004. Sea surface temperature distribution in the Azores region. Part II: space-time variability and underlying mechanisms. Arquipélago. Life and Marine Sciences 21A: 19-32.
Following the methodology described in the first part of the article, monthly Sea Surface Temperature (SST) distribution and variability in the Azores region was studied for the years 2001-2002. The mean SST field shows colder waters in the vicinity of big topographic features − near the Mid-Atlantic Ridge, between the Central and Eastern groups of the Azores islands and near the Azores and Princess Alice banks, with maximum temperature differences reaching 1ºC. Some of the anomalies can result from intensification of moving cyclonic waves/vortexes over bottom rises. The importance of wave/vortex induced heat flux from the Azores front to the Azores islands is discussed. Position of two eastward flows to the north and south of the Azores islands was investigated with the SST data. We suggest that the observed seasonal variability of the SST data greatly depends on general circulation seasonal changes in this region.
Igor Bashmachnikov (e-mail: [email protected]), Virginie Lafon & Ana Martins, Centro do IMAR (Instituto do Mar) da Universidade dos Açores, Departamento de Oceanografia e Pescas, Cais de Santa Cruz, PT - 9901-862 Horta, Açores, Portugal.
INTRODUCTION
The Azores region is located at the northern edge of the North Atlantic Subtropical Gyre (SG) – the rotor of the North Atlantic circulation (Fig.1). The present investigation is based on analysis of monthly averaged sea-surface temperature (SST) fields in the Azores region. The previous studies of the SST variability in the region were mainly addressing wave/vortex dynamics of the Azores current (CIPOLLINI et al. 1997, PINGREE 2002). We will concentrate here on the mean SST fields and make an attempt to explain large-scale surface water temperature variability observed from space and to relate it with the present knowledge of the ocean dynamics for the region.
The Azores region is characterized by rather high horizontal temperature gradients. The temperature spatial variability is enhanced by two eastward flows: the cold southern branch of the North Atlantic Current (NAC), that crosses the Mid-Atlantic Ridge (MAR) at 45-48o N (BOWER
et al. 2001), and the warm Azores Current (AzC), that crosses MAR at 34-36o N (K
LEIN & SIEDLER
Fig. 1. Geostrophic surface currents scheme with values of geostrophic transport in Sv (adopted from SIEDLER &ONKEN 1996). The black square represents our area of investigations.
1989). One additional flow can be traced in between NAC and AzC, following at 39-42o N
from the Gulf Stream separation point to the MAR (KRAUSS 1996; ESSELBORN et al. 1999; REVERDIN et al. 2003). We will refer to this flow
as the North Azores Flow (NAzF). Its influence on the Azores water proprieties is still unclear. Our region of interest (34.7 − 42.7o N)
incorporates the northern edge of the Azores current and the area between the AzC and the NAC, including the NAzF. Ocean circulation studies (POLLARD & PU 1985; BOWER et al. 2001; REVERDIN et al. 2003) demonstrate that, after crossing the ridge, the southern branch of the NAC, as well as the NAzF, follows south along the MAR and again turns east only at the northern edge of the bottom rises at 45 and 40o N
respectively, keeping a slight tendency to deviate to the south. At the same time, the AzC, to the south of the Azores, tends to have a small northward component (POLLARD & PU 1985; ALVES et al. 2002; REVERDIN et al. 2003). The tendency of all these flows to converge enhances meridional temperature gradients in the region. The highest horizontal temperature and salinity gradients in the upper layer are found in the Azores front. Temperature differences across the Azores front can reach 1 oC per 50 km (GOULD
1985). In the upper 600-800 m, high cross-frontal temperature gradients play the main role in formation of horizontal density variations in the Azores front (SIEDLER et al. 1985). Thus, if not masked by seasonal thermocline in summer (GOULD 1985; ALVES & VERDIERE 1999), the SST fields potentially are able to reflect internal water dynamics.
There are different opinions if the Azores region should, or should not, be included in the SG recirculation. GOULD (1985) suggested marking the frontal interface between the Subtropical and the North-East Atlantic Central waters at 18 oC isotherm, which outcrops sharply
in the Azores subtropical frontal zone (34-35 oN)
and represents typical SG (or more precisely - Sargasso sea) water temperature. The criterion was later used as a SG northern boundary in other investigations (ALVES et al. 2002). Still, not all authors completely agreed with this definition. Thus, several works address dominance of the eastward mean drift in the upper 200-300 m layer overall the Azores region, then turning south (POLLARD & PU 1985; JOYCE & JENKINS 1993) and the upper water layer over the Azores islands
rise is sometimes included in the SG recirculation (TOMCZAK & GODFREY 2001; TALLEY 2003).
The Azores region is inside the area of low wave/vortex activity, which includes most of the eastern subtropical Atlantic (FRATANTONI 2001). The main source of dynamic and temperature synoptic variability in the region is the AzC and the associated Azores frontal zone (CIPOLLINI et al. 1997; FRATANTONI 2001). The AzC meanders were reported to have typical wavelengths of 160 to 450 km, periods from 40 to 250 and up to 490 days and westward propagation speeds of 0.9-3.0 cm s-1 (G
OULD 1985; ALVES & VERDIERE 1999; ALVES et al. 2002; PINGREE 2002; CIPOLLINI et al. 1997). As the meanders develop, they grow in wavelength and period (ALVES & VERDIERE 1999) and often detach from the current. To the south, cyclonic meanders transform into dominating westward moving cyclones - ‘Storms’ (PINGREE & SINHA 1998; PINGREE et al. 2002). The temperature difference between the centre of ‘Storm’ and surrounding waters can exceed 2 oC
(PINGREE et al. 2002). To the north of the AzC, anticyclonic meanders are transformed into dominating anticyclonic structures (POLLARD & PU 1985; ALVES & VERDIERE 1999). The anticyclones to the north have typical wavelengths of 300-400 km and move westward with at a speed of about 1.8 cm s-1 (PINGREE
2002). ALVES & VERDIERE (1999) assumed that the anticyclones form the Azores Counter Current (AzCC) - a weak (2 cm s-1) narrow westward
undersurface flow just to the north of the AzC. Having discovered the AzCC from CTD surveys, ONKEN (1993) suggested a different mechanism. He argued that the AzCC could be produced by enhanced meridional gradients of the wind stress over the region (ONKEN 1993). Appropriate numerical models seem to confirm both hypotheses, but up to present, there are not enough observations to make final conclusions. MATERIALS AND METHODS
NOAA-12, -14, -16 1.1 km resolution images recorded from April 2001 to July 2002 was used in this investigation. The images were obtained
from the HAZO station and processed using semi-automated imagery processes, including the use of the MultiChannel Sea Surface Temperature algorithm (MCCLAIN et al. 1985) to compute SST values. Cloud cover over the region is quite strong and elimination of the next-to-cloud pixels would seriously limit the database. The analysis showed that the next-to-cloud pixels statistically do not differ from those further apart and the pixels were included in calculations (LAFON et al. 2004). Accuracy of the remotely sensed SST was evaluated by comparison of the AVHRR-derived SST ranges with in situ temperature ranges obtained during several experiments and cruises. The remnant noise, resulting in too low values of some SST pixels, was filtered by the method of histogram frequency thresholding, developed by LAFON et al. (2003). This method was found very effective in eliminating erroneous data in the Azores area. To eliminate the diurnal thermocline formation effect and minimise the difference between mixed layer temperature and the surface skin layer SST only night time images were used.
The extensive in situ database was used to perform comparisons between co-located SST
pixel values and observations made at sea (LAFON et al. 2004). Fairly good matching was found between the AVHRR-derived SST values and in
situ temperature measurements, taken at 3-5 m
depth. This shows that satellite derived SST represents well the upper mixed layer temperature in the Azores region. Hence hereafter, all references to SST should be taken as representative of the temperature of the upper mixed layer.
Due to cloud shading, individual images did not contain sufficient information to extract the SST distribution over the whole area. Thus, we will base our analyses on 15- and 30-day SST averages. Due to cloud shading, composition of the averages is not that straightforward. In some cases, temperature changes during the 15-/30-day periods were very high and to avoid composing averages with some pixels defined only at the beginning and others defined only at the end of the averaging period, a 4-step method was developed. Firstly, we obtained synoptic variability free daily SST curves by spatially averaging daily SST images in two 2º-latitude boxes running a north-south direction (Fig. 2).
Fig. 2. Scheme used for filtering of the pixels while constructing monthly averages. Example form June 2001, the southern box. 1- daily averaged SST, 2- interpolated and smoothed SST, 3- SST monthly linear trend. Thick black line at the bottom corresponds to the time range, in which should fall the average of the valid data dates for a given pixel, to consider pixel being non-blank in the monthly average.
The zonally aligned boxes were chosen since we expected that the Azores rise could separate the region in two areas, possibly having somewhat different seasonal dynamics. The missing data were linearly interpolated and the results were smoothed with Savitzky-Golay 2nd
order 5-point filter. Secondly, linear trends for consequent 15-/30-day intervals were calculated for the resulting SST values in each box, to get the mean SST change over the period of interest. Thirdly, assuming that the AVHRR-derived SST values had a maximum error (dT) of 0.5oC
(WALTON et al. 1998), the dates D1 and D2 were
calculated as corresponding on the linear trend graphs to the values: T1=Tav-dT and T2=Tav+dT,
where Tav is the average temperature during the
15-/30-day period, respectively. Finally, for each valid pixel of the initial SST images, the average of the image dates was calculated for every consequent 15-/30-day period. If the time average did not lie within [D1, D2] date interval, the pixel
was considered not to be representative and was eliminated from the final 15-/30-day image average (cf. Fig. 2). The resulting SST averaged images were smoothed with a 2D Savitzky-Golay second order filter with a 32-point window to reduce non-physical and high frequency noise. The later procedure reduced high frequency noise without seriously affecting the amplitudes of the SST anomalies with a diameter greater than 30 km.
The monthly means, besides seasonal variability, also contain synoptic wave/vortex influence. In fact, synoptic waves/vortexes in the region have the dominating periods of 200-250 days and spatial scales more then 100 km (PINGREE 2002). To extract the season-independent mean SST field, we performed, at each pixel, a least-square fitting (LSF) of the whole region averaged monthly SST values (SSTav(n)) to the monthly SST values at the pixel
(SST(i,j,n)) obtained at the previous step. Here n defines a 15/30-day period of interest, i and j are the pixel position indexes. The resulting LSF coefficient (Csst(i,j)), i.e. the vertical shift of the
whole-region average curve along the temperature axis, were taken as the measure of the mean, season independent, SST stationary anomaly field at the point. The resulting anomaly field can be regarded as little influenced by
synoptic variability, since it basically represents averaging over 1.5 year period, e.g. the period of observations. The obtained Csst field suffers from
high frequency scattering, probably being a result of the LSF method sensitivity to missing values. To reduce the scattering the Csst field was further
smoothed with a Savitzky-Golay filter.
SST non-stationary anomaly fields were then obtained as residuals after subtracting in each pixel-point the whole-region averaged monthly curve (SSTav(n)), vertically adjusted with the
smoothed Csst coefficient, from the SST monthly
mean variability in the pixel-point: SSTanom(i, j, n)
= SST(i, j, n) - (SSTav(n) + Csst).
RESULTS
SST stationary and non-stationary anomalies in the Azores region
The Csst coefficient field characterizes the SST
mean spatial distribution (Fig. 3a, 3b). The stationary SST anomaly field, derived from 15-days averages (cf. Fig. 3b), shows higher frequency noise. This is a result of the low number of pixels often included in the averages, which do not permit to totally filter mesoscale variability.
The Mid-Atlantic Ridge separates warmer western from colder eastern sub-tropical ocean basins (cf. Fig.3a). The isotherm tilt, maximum on the western MAR strongly suggests that most of the warm SG recirculates within the western basin (KRAUSS 1996). The same tilt, combined with enhanced SST gradients, can be observed north of 41o N, where colder waters bow sharply
south along the MAR, reflecting a southward turn of the NAzF (SAUNDERS 1982; ARHAN 1990; EFTHYMIADIS et al. 2002). Then the NAzF isotherms turn eastward, having slight southward tilt in accordance with the general circulation pattern previously derived from CTD casts (POLLARD & PU 1985). Below 36o N the Azores
front forms a boundary of high meridional temperature gradients. The main body of AzC is situated to the south of the southern border of the region. Persistent positive SST anomaly at the southernmost border of the region (34-35o N,
31-32o W) can be identified as a northern edge of a
going around a bottom rise (Atlantis seamount chain of 1500-2000m depth) and then following south to the Plato seamount. The analysis of monthly averaged images revealed that the
position of the meander varies in time and, in some cases, it disappears from the region of investigation. Thus, the meander is “attached” to the seamount chain only in average.
Fig. 3. SST stationary (top) and non-stationary (bottom) anomalies in the Azores region. a) SST stationary anomalies, monthly averaged data; b) SST stationary anomalies, 15-day averaged data; c) SST non-stationary anomalies, November 2001, monthly average; d) SST non-stationary anomalies, January 2002, monthly average. Black lines on a) represent isobaths: solid line - 2000 m, dash-dot line - 4000 m. Black lines on b) contour areas of high bottom gradients: solid line - 4.10-5, dotted line - 3.10-5.
At approximately the same place, the AzC meander was first observed in situ by KASE & SIEDLER (1982), later on by GOULD (1985) and ALVES et al. (2002). MAILLARD & KASE (1989) found the meander moving from the Atlantis seamount towards southwest at a speed of about half the typical speed for meanders in the AzC. The typical position of the meander suggests an interaction with the seamount chain, which is quite plausible, since coherent flow variability in the AzC meanders was observed down to 3000-4000 m depths (SIEDLER et al. 1985). A good
agreement was obtained between the meander parameters and the characteristics of the first 3 vertical modes of baroclinic Rossby waves (CIPOLLINI et al. 1997). Drifter derived mesoscale kinetic energy in the region (which includes energy of Rossby waves) sharply peaks at the AzC (FRATANTONI 2001), which means that the baroclinic Rossby waves are trapped by the current. Going upstream, the Rossby waves would reduce their phase speed or even stop, when meeting the region of underwater chain, as it was suggested by KASE & SIEDLER (1982). If
so, it would not be very surprising to register in 1.5-year SST average the mean meander position to be near the chain of seamounts.
The stationary SST anomaly field (cf. Fig.3a and 3b) reflects most of the prominent topographic features in the region as the areas of anomalously low sea surface temperature. The eastern flank of the Mid-Atlantic Ridge is marked as a down-bow of the SST isotherms (local decrease of temperature). A temperature decrease is also observed north of the Azores archipelago rise and in between the Eastern and Central groups of islands, where topography is extremely irregular (cf. Fig.3b). On the 15-day average, the colder pool of water splits into smaller and more intensive coldwater patches. On Fig. 3a the features are not so prominent due to heavier smoothing. The origin for the colder SST observed near bottom irregularities may have several explanations: the southward turn of colder northern waters along the steep bottom flanks due to topographic trapping, as it was observed at the eastern flank of MAR; interaction with topography of westward moving waves/vortexes; or enhanced tidal mixing near the steep bottom slopes. The first hypothesis cannot explain all the cold anomalies. For example, the SST anomalies observed at (36o N, 26o W) and (41o N, 24o W) are
situated in regions with 3000-4000 m depth. Current patterns at those depths have little relation to the near-surface ones (SAUNDERS 1982). The main tidal waves direction in the region is along the MAR (KANTHA 1995), except on the Central and Eastern parts of the Azores archipelago. Typically strong tidal mixing occurs at shoals or steep bottom slopes, especially if the incident barotropic tidal wave is perpendicular to the slope. This means, that high vertical mixing and surface water-cooling can occur at the Azores archipelago rise, but smaller-scale topography irregularities at other parts of the MAR, not reflected by the coarse bathymetry, can also produce the mixing observed. The third mechanism does not seem to be very important near the MAR, since mesoscale wave/vortex energy field there is abnormally low (COLIN DE VERDIERE et al. 1989). Generated in the eastern basin, westward moving Rossby waves meet the MAR, where they can partly be transmitted to the western basin, partly reflected backward
(PEDLOSKY 2000). Model studies suggest that baroclinic Rossby waves can loose part of their energy on barotropic mode generation at MAR and partly refract south (BARNIER 1988). Can Rossby waves in course of those transformations change the SST properties at the eastern flank of the MAR? For example, can part of their energy at the MAR dissipate in a way, that it will stimulate near-surface vertical mixing? We do not have data to answer those questions. Here we investigate another wave/vortex mechanism, which can produce the negative anomalies of SST. To do this we first need to address dynamics of non-stationary, moving SST anomalies.
The general structure and intensity of non-stationary SST anomalies change in time. The most energetic positive and negative anomalies observed during the period of study are shown on Fig. 3c and Fig. 3d. The size of the anticyclonic anomalies is typically 200-300 km, roughly corresponding to the size of observed wave/vortex structures in the region from sea-level satellite observations (PINGREE 2002; ALVES & VERDIERE 1999). Based on the results obtained from a sea level assimilation model, ALVES & VERDIERE (1999) suggested that water dynamics north of the AzC is formed by westward propagating anticyclones that detached from the current. To find out if the SST non-stationary anomalies are moving and in what direction, summary diagrams of the SST anomaly field variability in time versus latitude and longitude were plotted for the sub-region south of the Azores (Fig.4). The left panel does not show any visible meridional propagation of SST anomalies, but half-year periodicity is well pronounced. This periodicity is close to the one observed for the AzC meanders. PINGREE et al. (1999) found the same periodicity for cyclonic wave-like structures (“Storms”) to the south of the AzC. Some traces of westward zonal propagation can be seen on the right panel (cf. Fig.4). Though not very reliable, the propagation speeds of the anomalies can be estimated as 0.7-1.1 cm / s. This is in the range of the westward propagation velocities for the AzC meanders, but 1.5-2 times lower than the typical propagation speeds observed for the wave-like structures to the north of the AzC from altimetry (PINGREE 2002).
Fig. 4. 2-D plot of SST non-stationary anomalies south of the Azores archipelago with respect to: a) time and latitude and b) time and longitude. The calculations are based on 15-day averages.
Difficulty in following SST anomalies, particularly the cyclonic ones, arises from the fact that the structures quickly loose their identity at the sea surface due to ocean-atmosphere heat exchange (PINGREE et al. 1999). Visible propagation of the features in SST fields was mostly observed in frontal regions, where the SST gradients are maintained by frontal dynamics (CIPOLLINI et al. 1997). Again they can become visible on the sea-surface when increasing intensity- for example meeting substantial bottom irregularities − like a seamount chain or a through. Rapid depth variations produce sudden changes in relative vorticity (ζ). For a quasigeostrophic motion the potential vorticity is defined as: const Hf = + = Π ζ
where H is the average water depth, and f is the
Coriolis parameter. For zonal waves (f ≈ const), only sea depth variations (H2=H1-∆H) will
effectively produce changes in relative vorticity. The relative vorticity change over a bottom rise can be derived from the equation:
(
f)
H H + ∆ − = 1 1 1 2 ζ ζ ζ ≈ f H H 1 1 ∆ − ζ(the first term in brackets can be neglected, because even for strong ocean vortexes ζ<<f). Thus, relative vorticity will grow (diminish) for positive (negative) sea depth variations. To the south of the Azores (34-36.5o N) the bottom,
gently rising to the west, is interrupted between 28.5o W and 27.5o W by a steep (around 1.5 m per
kilometre) meridionally aligned bottom rise, incorporating a seamount chain (Fig.5) and for an approaching vortex
(
ζ2−ζ1)
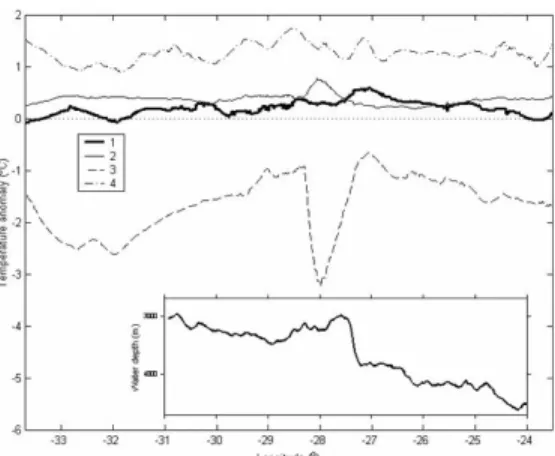
f =−0.2, which is aFig. 5. Statistics of meridionally averaged SST anomalies variability in time south of the Azores (34.7 – 37.0o N), plotted as a function of longitude: 1 –
average (multiplied by 2); 2 - variance; 3 – minimum value; 4 – maximum value. On the inset− meridionally averaged water depth (m) as a function of longitude for the region of study.
Really, zonally propagating SST anomalies show significant increase in variance in the region of the bottom rise (cf. Fig.5). The high variance is related to strengthening of negative SST anomalies. Since the SST anomalies represent non-stationary wave/vortex structures, the results imply that cyclonic vortexes (negative vorticity) get stronger in the area of the bottom rise and further increase related negative SST anomalies. This mechanism can also explain stationary negative SST anomalies at the eastern flank of the MAR. Anticyclonic vortexes (positive vorticity and SST anomalies), oppositely, will get weaker over the bottom rise and can even deteriorate. To keep integrity, they may slow down and change direction of propagation, e.g. become bottom trapped and follow the topographic feature to the south (cf. BARNIER 1988). Stagnation and/or trapping of the westward moving anticyclones is also reflected in time-average values of SST anomalies (cf. Fig. 5), which have its absolute maximum just before the depth rise (27o W),
followed by sharp decrease over it.
Further west (cf. Fig. 5) the time-mean of the meridionally averaged SST anomalies gradually decreases. Can this be related to the fact, that the seamount chain is a barrier to warm anticyclone structures, barring warm water from the AzC to
reach the Central and Western groups of the Azores archipelago? To evaluate the influence of the SST non-stationary anomalies to the mean temperature climate south of the Azores, a number of positive and negative dome-like anomalies was calculated for strong (i.e. average temperature difference “in” and “around” an SST anomaly dome centre is more than 1.0 °C) and very strong anomalies (i.e. average temperature difference “in” and “around” a dome centre is more than 1.5 °C). Only the structures with a diameter of more than 100 km were considered. From Fig.6 it is seen that the space-averaged temperature anomaly south of the Azores is dependent on a number of dome-like temperature anomalies. Significant positive correlation (0.70) between the space-averaged SST anomaly and strong positive SST dome-like structures was found. This means, that the mean sea surface temperature to the south of Azores is greatly influenced by a number of positive dome-like anomalies. This is confirmed by the fact, that the observed general decrease with time of number of positive anomalies and concurrent increase of number of negative ones resulted in a decrease of the average temperature over the region (cf. Fig. 6). On the whole, during the period of observations, warm SST anomalies dominated, making positive input in the SST south of the Azores.
Fig. 6. Spatially averaged non-stationary anomalous temperature (1) in the region south of the Azores archipelago and number of positive minus number of negative strong dome-like SST anomalies (3). Lines 2 and 4 represent the corresponding linear trends. The calculations are based on 15-day averages.
We can conclude, that the AzC significantly influences sea surface temperature climate to the south of the Azores. Our results compliment the previous investigations and lead to the conclusion, that the AzC wave/vortex radiation, emitting mostly warm anticyclonic structures, forms north-westward heat advection and results in the increase of the mean temperature in the region. The steep bottom rise, including a seamount chain, forms a barrier for the anticyclones to propagate further west. This can lead to a general decrease of the mean temperature related to wave/vortex heat transport to the west of the ridge.
Seasonal variability of SST in the Azores region The position of the 60-km wide jet-like AzC and the associated Azores front is attributed to a zone of strong Ekman transport convergence (southern border of the westerlies) superimposed with a region of enhanced horizontal thermohaline water gradients (KASE & SIEDLER 1982). Based on wind data, the convergence zone can be placed around 35o N, which is the position of the AzC
main jet, but it exhibits seasonal migrations of ±3o
latitude (KASE & SIEDLER 1982). This may cause the AzC to perform the observed retreat south in summer and progress northward in winter in the region south of the Azores (STRAMMA &SIEDLER 1988; MAILLY et al. 1997). Azores Current transport reaches its maximum in spring and stays quite high in summer, whereas in winter minimum transport was observed (ALVES & VERDIERE 1999). It is interesting to note, that the Gulf Stream exhibits a similar seasonal pattern, shifting southward and reaching its maximum transport in spring-early summer (CSANADY 1982; FRANKIGNOUL et al. 2001). The North Equatorial current exhibits analogous seasonal variability and all of these reflect in fact, the seasonal meridional migrations and transport variability of the North Atlantic subtropical gyre (STRAMMA &SIEDLER 1988). Those large-scale changes should have an effect on seasonal SST variability in the Azores archipelago.
To filter mesoscale variability and isolate seasonal changes, SST data in the Azores region was spatially averaged over three overlapping
areas: 34.7 - 38.7o N, 36.7 - 40.7o N and 38.7
-42.7o N. Monthly time series for the areas are
presented on Fig. 7. Results show that the only prominent discrepancy in SST seasonal variability between the three areas occurs in December 2001, when a sudden fluctuation of the average SST occurs, with the amplitude decreasing from south to north.
Fig. 7. Monthly time series of spatially averaged SST for the regions: 1 - 38.7 - 42.7 ºN; 2 - 36.7 - 40.7 ºN; and 3 - 34.7 - 38.7 ºN. Dashed line 4 represents air temperature spatially averaged over the region 34.7-38.7o N obtained from NOAA NCEP-NCAR
(http://iridl.ldeo.columbia.edu/SOURCES/NOAA/.NC EP-NCAR).
On Fig. 7 air temperature, averaged over the southern square, is also plotted (NOAA NCEP-NCAR). Air temperature monthly variability for the two northward squares is similar, hence is not shown. SST seasonal variability (night values only) follows closely the air temperature curve, although showing lower values. During the cold season (winter-spring) the position of the subtropical gyre northern boundary, if identified at the position of the 18 oC isotherm, was located
south of 34.5-35o N (the northern border of the
Azores subtropical front). In late spring the isotherm started moving to the north and crossed the northern border of the area of investigation in August. The backwards retreat started in November. In investigations of the AzC seasonal variability those isotherm displacements was attributed to barring of the internal water structure by formation of the seasonal thermocline (GOULD 1985; ALVES et al. 2002). Fig. 8 shows SST variability in August 2001 and July 2002.
Fig. 8. Monthly mean SST fields: a) August 2001, b) July 2002. The black line represents the 2000 m isobath.
Significant zonal isotherm tilt observed seems to be typical for late summer. In winter the tilt was less pronounced. It is still questionable if the late summer intensification of the warm water advection in the Azores region observed in 2001 and 2002 was a lagged response of the Gulf Stream spring-early summer intensification or if it was produced by local forcing. Nearly meridional alignment of isotherms suggests strong influence of the dominating eastward flow, displayed in SST. Summer intensification of the eastward flow through the Azores was previously found from CTD data (KLEIN & SIEDLER 1989) and from an altimeter assimilation model for the region (MAILLY et al. 1997). The CTD casts, performed by the Department of Oceanography and Fisheries at the University of Azores, showed that during warm season in the area of the Azores archipelago the mixed layer proprieties are well coupled with those of the upper permanent thermocline. Since the latter are formed by large-scale advection patterns, it seems to be possible to identify internal water structure and dynamics not related to the seasonal thermocline variability
with SST data.
As it follows from Fig. 9 MAR region is characterised by predominantly zonal orientation of the SST gradients (meridional extension of isotherms). The isotherm deviation from zonal over the MAR is due to the blocking effect of the MAR on the warm water transport to the eastern Atlantic basin (BOWER et al. 2002). In the rest of the area the SST gradients are predominantly meridional. Some patches of zonally oriented gradients are observed in the southern part of the region, related to the AzC meanders, and to the east of the Azores rise, related to topographically induced water cooling (cf. Fig. 3a and 8). In average, meridional SST gradients were 3 times higher then the zonal ones, especially at the east of the region, which is not surprising since here most of the frontal zones have zonal extension (cf. Fig.1). The meridional SST gradients for the eastern part of the area of investigation (24 - 29o
W) are presented on Fig. 10. In time average, we observe several wide peaks at about 37 - 38o N
and 40 - 42o N (Fig. 10a), which were quite stable
10b). In fact, the SST meridional gradients variability in space (cf. Fig. 10a) was much higher than that in time (Fig. 10c). Another peak, south of 35o N (cf. Fig. 10a), appears periodically
during the cold season. It can be identified as a meander of the Azores front. In summer it probably shifts southward with the front and/or is smeared on the ocean upper layer due to enhanced summer near-surface heat advection just south of the Azores. This flow can be seen on an altimetry-assimilating model for the region (MAILLY et al. 1997). The other peak, at about 40 - 42o N, represents the southern border of the
NAzF (cf. KLEIN & SIEDLER 1989; MAILLY et al. 1997).
Fig. 9. Orientation of the SST horizontal gradients from the mean SST anomaly field (cf. Fig. 3): black areas- dominating north-south direction of the gradients, grey areas- dominating east-west direction of the gradients. White line is a 2000m isobath.
CONCLUSION
Sea surface temperature variability was investigated for the years 2001-2002, using AVHRR sensor data for the Azores region. Our results rest on LAFON et al. (2003) who suggested to use satellite-derived night time SST data to characterise the upper mixed layer temperature within the region. The developed method of obtaining stationary SST anomalies permitted to display well-known water dynamic features and allowed identification of new oceanographic patterns in the region. Our analysis also showed
Fig. 10. SST meridional gradients diagrams for years 2001-2002, averaged over longitude 25- 29o W: a)
variability along latitude (longitude-time average); b) − latitude versus time; c) − time variability (latitude-longitude average). On panel b) the SST gradients are
normalized with 0.3 times the SST gradients range.
that SST seasonal variability in the Azores region is not only related to formation and dissolution of the seasonal thermocline, but is significantly influenced by large-scale heat transport resulting
from advection patterns over the region. The mean, season independent, sea surface temperature field is characterised by a pronounced surface water cooling in the vicinity of large topographic features, e.g. near the Mid-Atlantic Ridge, islands, and seamount chains. One of the most prominent cool water pools in the area was observed between the Central and Eastern groups of the Azores islands. The mechanism of this cooling is not clear. Moving cyclones, intensified over bottom rises can be an explanation for the phenomena; similar to what was found at a seamount chain south of the Azores. On contrary, anticyclones generated at the AzC, should loose their intensity or become bottom trapped and fall to the south of the Azores bottom rise. As a result, near-surface waters in the Azores archipelago will be cooler than waters just to the south. The MAR was found to efficiently stop eastward flowing waters and several breakthroughs were identified. The main are: the AzC, at the southern border of the area; and the NAzF, crossing the MAR just north of the Azores. It seems that there is also an eastward flow on the southern border of the Azores archipelago rise, appearing on a seasonal basis and previously obtained in an altimetry-assimilating model for the region (MAILLY et al. 1997). It can form a part of the eastward flow over the Azores region derived by POLLARD & PU (1985) from summer CTD measurements. If so, this flow is limited to the upper 200m layer (POLLARD & PU 1985).
The present investigation showed that, in spite of substantial cloud cover, SST imagery has high potential for investigating ocean water dynamics in the Azores region. At the same time, not all the features can be easily seen. For example, it is generally agreed, that the Azores front cannot be clearly seen in summer. Ocean colour satellite images (MARTINS & PELEGRI 2003) and altimetry data can provide useful additional information for more detailed investigation of ocean dynamics in the Azores. ACKNOWLEDGEMENTS
We would like to sincerely thank all the team members at the Oceanography and Fishery
Sections at the Department of Oceanography and Fisheries at the University of the Azores (DOP/UAç) for their exceptional help during the work. For assistance in in situ temperature sampling we gratefully acknowledge captain, crew, and scientific staff of R/V ARQUIPÉLAGO cruises “ARQDAÇO-02” (MAREDA project – Annual monitoring of the relative abundance of demersal species of the Azores), “VENTOX” (Deep-Sea Hydrothermal Vents: A Natural Pollution Laboratory) (EVK3CT1999-00003). We are also thankful to the coordinator Rogério Feio and to all the observers on board the Azorean tuna fleet as part of POPA (Program for the Observation of Fisheries of the Azores) program. Computer resources and facilities were provided by DOP/UAç and by the Institute of Meteorology (Azores). This work was supported by the following: project DETRA, funded by the Regional Directorate of Fisheries of the Azores (RAA - SRAPA / DRP - DETRA - 2000 - 2003), Centre of IMAR – Institute of Marine Research of the University of the Azores funds, and the Foundation for Science and Technology (Ministry of Science and Technology of Portugal) through two Post-Doctorate Fellowships. This support is greatly acknowledged.
REFERENCES
ALVES, M.L.G.R. & A.C. DE VERDIÈRE 1999. Instability dynamics of a subtropical jet and applications to the Azores current system: eddy-driven mean flow. Journal of Physical Oceanography 29: 837-864.
ALVES, M.L.G.R., F. GAILLARD, M. SPARROW, M. KNOLL & S. GIRAUD 2002. Circulation patterns and transport of the Azores front-current system. Deep-Sea Research II 49: 3983-4002.
ARHAN, M.1990. The North Atlantic Current and Subarctic Intermediate Water. Journal of Marine Research 48: 109-144.
BARNIER, B. 1988. A numerical study on the influence of the Mid-Atlantic ridge on nonlinear first-mode baroclinic Rossby waves generated by seasonal winds. Journal of Physical Oceanography 18:
417-433.
BOWER, A.S., H. LE CANN, T. ROSSBY, W. ZENK, J. GOULD, K. SPEER, P. L. RICHARDSON, M. D. PRATER & H.-M. ZHANG 2002. Directly measured
mid-depth circulation in the North Atlantic Ocean.
Nature 419: 603-607.
CSANADY, G.T. 1982. The thermohaline driving mechanism of oceanic jet streams. Journal of Marine Research, Supplement 40: 113-142.
CIPOLLINI, P., D. CROMWELL, M.S. JONES, G.D. QUARTLY & P.G. CHALLENOR 1997. Concurrent altimeter and infrared observations of Rossby wave propagation near 34oN in the Northeast Atlantic.
Geophysical Research Letters 24 (8): 889-892.
COLIN DE VRDIERE,A.,H.MERCIER &M.ARHAN 1989. Mesoscale veriability transition from the Western to the Eastern Atlantic along 48o N. Journal of
Physical Oceanography 19: 1150-1170.
EFTHYMIADIS, D., F.HERNANDEZ &P.-Y.LE TRAON 2002. Lagre-scale sea-level variations and associated atmospheric forcing in the subtropical north-east Atlantic ocean. Deep-Sea Research II
49: 3957-3981.
ESSELBORN, S., L. MILLER & B. CHENEY 1999. Interannual Changes in North Atlantic Sea Level and Surface Circulation as Measured by Satellite Altimetry. Poster at Topex/Poseidon Science Working Team Meeting, October 1999.
FOUX, V.R., D.K. STARITSIN & V.N. FILATOV 2003. Experience in using the satellite altimetry information for the assessment of the oceanographic conditions for Saira fishery. Isvestiya TINRO, in press.
FRANKIGNOUL, C., G. COETLOGON, T.M. JOYCE & S. DONG 2001. Gulf Stream variability and ocean-atmosphere interactions. Journal of Physical Oceanography 31: 3516-3528.
FRATANTONI, D.M. 2001. North Atlantic surface circulation during the 1990’s observed with satellite-tracked drifters. Journal of Geophysical Research 106 (C10): 22067-22093.
JOYCE, T.M. & W.J. JENKINS 1993. Spatial variability of subducting water in the North Atlantic: a pilot study. Journal of Geophysical Research 98 (C6):
10111-10124.
GOULD, W.J. 1985. Physical oceanography of the Azores front. Progress in Oceanography 14:
167-190.
KANTHA, L.H. 1995. Barotropic Tides in the Global Oceans from a Nonlinear Tidal Model Assimilating Altimetric Tides, Journal of Geophysical Research
100: 25283-25308.
KASE, R.H. & G. SIEDLER 1982. Meandering of the subtropical front south-east of the Azores. Nature
300 (5889): 245-246.
KLEIN, B. & G. SIEDLER 1989. On the origin of the Azores current, Journal of Geophysical Reseach
94(C5): 6159-6168.
KRAUSS,W. (editor) 1996. The warmwatersphere of the North Atlantic Ocean. Gebruder Borntraeger.
Berlin. 446 pp.
LAFON, V., A. MARTINS, I.L. BASHMACHNIKOV,M.A. MELO-RODRIGUES & M. FIGUEIREDO 2003. Sea surface temperature spatio-temporal variability in the Azores using a new technique to remove invalid pixels, Remote Sensing of Ocean and Sea Ice, Proceedings of SPIE 5233: 89-97.
LAFON V.,A. MARTINS,M.FIGUEIREDO, M.A.MELO RODRIGUES,I.BASHMACHNIKOV,A.MENDONÇA,L. MACEDO & N. GOULART 2004. Sea surface temperature distribution in the Azores region. Part I: AVHRR imagery and in situ data processing. Arquipélago. Life and Marine Sciences. 21A: 1-18.
MAILLY,T.,E.BLAYO &J.VERRON 1997. Assessment of the ocean circulation in the Azores region as predicted by numerical model assimilating altimeter data from Topex/Poseidon and ERS-1 satellites. Annales Geophysicae 15: 1354-1368.
MAILLARD, C. & R. KASE 1989. The near-surface flow in the Subtropical Gyre south of Azores. Journal of Geophysical Research 94 (C11): 16133-16140.
MARTINS, A.M. & J.L. PELEGRI Submitted. Winter
chlorophyll patterns in the SAB as derived from CZCS imagery, Continental Shelf Research.
MCCLAIN, E.P., W.G. PICHEL & C.C. WALTON 1985. Comparative performance AVHRR-based multichannel sea surface temperatures. Journal of Geophysical Research 90: 11587-11601.
NOAA NCEP-NCAR: NCEP/NCAR Reanalysis Project. Available from: http://iridl.ldeo. columbia.edu/SOURCES/.NOAA/.NCEP-NCAR. Last accessed June 11, 2003.
ONKEN,R. 1993. The Azores Countercurrent. Journal of Physical Oceanography 23: 1638-1646.
PEDLOSKY, J. 2000. The transmission of Rossby waves through basin barriers. Journal of Physical Oceanography 30: 495-511.
PINGREE, R. 2002. Ocean structure and climate (Eastern North Atlantic): in situ measurement and remote sensing (altimeter). Journal of the Marine Biological Association of the UK 82: 681-707.
PINGREE, R.D., C. GARCIA-SOTO & B. SINHA 1999. Position and structure of the Subtropical/Azores front region from combined Lagrangian and remote sensing (IR/altimiter/SeaWiFS) measurements.
Journal of the Marine Biological Association of the UK 79: 769-792.
PINGREE, R.D., Y.-H. KOU & C. GARCIA-SOTO 2002. Can Subtropical North Atlantic permanent thermocline be observed from space? Journal of the Marine Biological Association of the UK 82:
PINGREE, R.D. & B. SINHA 1998. Dynamic Topography (ERS-1/2 and sea truth) of subtropical ring (STORM 0 in the STORM Corridor (32-34º N), Eastern Basin, North Atlantic Ocean. Journal of the Marine Biological Association of the UK 78:
351-376.
POLLARD, R.T. & S. PU 1985. Structure and Circulation of the upper Atlantic ocean Northeast of the Azores. Progress in Oceanography 14: 443-462.
REVERDIN,G.,P.P.NIILER &H.VALDIMARSSON 2003. North Atlantic Ocean surface currents. Journal of Geophysical Research 108 (C1): 3002-3023.
SAUNDERS, P.M. 1982. Circulation in the eastern North Atlantic. Journal of Marine Research, Supplement
40: 641-657.
SHATOHIN, B.M., V.M. MISHKIN, D.N. KLUCHKOV, G.P. VANUSHIN, B.N. KOTENEV, V.I. CHERNOOK & V.B. ZABAVNIKOV 2002. A methodology for estimation of biomass and concentrations of far- -migrating spices and their behavior on the synoptic scales of ocean variability as a basis for fishery forecasts. Pp. 44-57 in Materials of the Russian conference “Ways of solution for the problem of investigation, use and conservations of
the World ocean resources”, Moscow 20 - 22 of
March 2002.
SIEDLER, G.,W. ZENK & W.J. EMERY 1985. Strong current events related to a subtropical front in the Northeast Atlantic. Journal of Physical Oceanography 31: 1287-1303.
STRAMMA,L.&G.SIEDLER 1988. Seasonal changes in the North Atlantic subtropical gyre. Journal of Geophysical Research 93 (C7): 8111-8118.
TALLEY, L.D. 2003. Shallow, intermediate, and deep overturning components of the global heat budget.
Journal of Physical Oceanography 33: 530-560.
TOMCZAK, M. & J.S. GODFREY 2001. Regional Oceanography: An introduction. Available from: http://www.es.flinders.edu.au/~mattom/regoc/pdfve rsion.html. Last accessed June 28, 2003.
WALTON, C.C., W.G. PICHEL, J.F. SAPPER & D.A. MAY 1998. The development and operational application of nonlinear algorithms for the measurement of sea surface temperatures with the NOAA polar-orbitong environmental satellites. Journal of Geophysical Research 103 (C12): 27,999-28,012. Accepted 21 September 2004.