Ecolog
y in a human-dominated
W
orld
ECOGRAPHY
Ecography
–––––––––––––––––––––––––––––––––––––––– Subject Editor: Andres BaselgaEditor-in-Chief: Miguel Araújo Accepted 16 May 2018
42: 45–54, 2019
doi: 10.1111/ecog.03812doi: 10.1111/ecog.03812 42 45–54
An important factor that hinders the management of non-native species is a general lack of information regarding the biogeography of non-natives, and, in particular, their rates of turnover. Here, we address this research gap by analysing differences in temporal beta-diversity (using both pairwise and multiple-time dissimilarity metrics) between native and non-native species, using a novel time-series dataset of arthro-pods sampled in native forest fragments in the Azores. We use a null model approach to determine whether temporal beta-diversity was due to deterministic processes or stochastic colonisation and extinction events, and linear modelling selection to assess the factors driving variation in temporal beta-diversity between plots. In accordance with our predictions, we found that the temporal beta-diversity was much greater for non-native species than for native species, and the null model analyses indicated that the turnover of non-native species was due to stochastic events. No predictor variables were found to explain the turnover of native or non-native species. We attribute the greater turnover of non-native species to source-sink processes and the close proximity of anthropogenic habitats to the fragmented native forest plots sampled in our study. Thus, our findings point to ways in which the study of turnover can be adapted for future applications in habitat island systems. The implications of this for biodiversity conservation and management are significant. The high rate of stochastic turnover of native species indicates that attempts to simply reduce the populations of non-native species in situ within non-native habitats may not be successful. A more efficient management strategy would be to interrupt source-sink dynamics by improving the harsh boundaries between native and adjacent anthropogenic habitats.
Keywords: invasive species, beta-diversity, turnover
Differential temporal beta-diversity patterns of native and
non-native arthropod species in a fragmented native forest
landscape
Thomas J. Matthews, Jon Sadler, Rui Carvalho, Rui Nunes, Paulo A. V. Borges
T. J. Matthews (http://orcid.org/0000-0002-7624-244X) ([email protected]) and J. Sadler, GEES (School of Geography, Earth and Environmental Sciences), Univ. of Birmingham, Birmingham, UK, and Birmingham Inst. of Forest Research, Univ. of Birmingham, Edgbaston, Birmingham, UK. – R. Carvalho, R. Nunes, P. A. V. Borges (http://orcid.org/0000-0002-8448-7623) and TJM, CE3C – Centre for Ecology, Evolution and Environmental Changes/Azorean Biodiversity Group and Univ. dos Açores – Depto de Ciências Agráriase Engenharia do Ambiente, Angra do Heroísmo, Açores, Portugal. RN and PAVB also at: IUCN Mid-Atlantic Island Invertebrates Specialist Group. PAVB also at: IUCN SSC Species Monitoring Specialist Group.
Ecolog
y in a human-dominated
W
orld
Introduction
The introduction, spread and establishment of species out-side of their native range can result in substantial changes to natural ecosystems (Mooney and Hobbs 2000, Dyer et al. 2017), sometimes including the local and/or regional extir-pation of native species (Clavero and García-Berthou 2005, Bellard et al. 2016). Furthermore, the global rate of transfer and mixing of species between native and non-native ranges does not show any signs of decreasing (Seebens et al. 2017). We use the term ‘non-native’ throughout this study and we define such species simply as those that are present in an area outside of their native range as a result of human actions (Blackburn et al. 2016), which on islands is generally a con-sequence of commerce, gardening, agriculture and forestry (Whittaker and Fernández-Palacios 2007).
Indeed, the impact of non-native species, and particularly invasive species (a subset of non-native species), is variable but it does appear to be more acute on islands (Blackburn et al. 2004, Whittaker and Fernández-Palacios 2007, Bellard et al. 2016, but see Sax et al. 2002). A key component of assessing the impact of non-native species in island systems involves the development, and testing, of (island) biogeographical theories and models relevant to them (Pyšek 1998, Blackburn et al. 2008, 2016, Burns 2015). For example, in their fifty ‘fun-damental questions in island biology’, Patiño et al. (2017) recently highlighted that understanding how the impacts of non-native species differ from those of naturally colonising species is a key question in their management.
Burns (2015) has started this process via a recently intro-duced extension of MacArthur and Wilson’s (1967) equilib-rium theory of island biogeography (ETIB), which he termed a ‘theory of island biogeography for exotic species’ (herein, ‘TIBE’). TIBE is a graphical island biogeographic model that makes a variety of different predictions regarding the species richness and turnover of native and non-native species (Burns 2015). This was a useful advance as little is known about the turnover patterns of non-natives. However, the analysis of turnover dynamics of non-natives has so far only been stud-ied in the context of true islands, i.e. islands surrounded by a matrix of water (Whittaker and Fernández-Palacios 2007, Burns 2015). In contrast, the knowledge of turnover patterns for non-native species in habitat islands, i.e. patches of natu-ral habitat surrounded by a matrix of often human domi-nated habitats (Matthews 2015), is lacking. Such knowledge is important as the destruction and fragmentation of natural habitat is widely recognised as the leading driver of contem-porary species extinctions (Sala et al. 2000) and also as an important driver of extinction debt (Triantis et al. 2010). Moreover, there has been an increasing recognition of the syn-ergistic effects of the different drivers of species loss (e.g. habi-tat loss, climate change and invasive species; Didham et al. 2007, Ferger et al. 2017, Karp et al. 2018). As with true islands, we predict that the turnover of non-native species will be greater than for native species in habitat fragments. However, in true islands the matrix (water) can generally be
ignored, whilst in habitat island systems it is possible that the surrounding matrix contributes to turnover patterns within habitat islands. As many non-native species have strong affin-ities to human-dominated habitats, that is, they are general-ists or human habitat specialgeneral-ists (McKinney and Lockwood 1999, Borges et al. 2008, 2010), the presence of non-native species within habitat islands of native habitat is theorised to be driven by stochastic source-sink mass effect dynamics as a result of human disturbance (Williamson 1996, Sgarbi and Melo 2017). Non-native species, which should therefore be less adapted to the conditions within the sink habitat, should have a higher risk of extinction and turnover (MacArthur and Wilson 1967). This possibility has not previously been exam-ined in habitat islands.
A variety of methods have been employed to anal-yse turnover in the island literature (Russell et al. 1995, Whittaker et al. 2000, Burns 2015), mostly based on the sum-mation of raw numbers (e.g. number of extinction events). However, another, and arguably more statistically robust, way of analysing temporal changes in species assemblages uses dissimilarity indices, which allow researchers to parti-tion out the effect of richness differences between samples (Baselga 2010, Baselga et al. 2015). One such approach is to use the framework of temporal beta-diversity. Beta-diversity provides a measure of the differences in the composition of communities, and is usually calculated in a spatial con-text, e.g. to assess how composition changes across a set of sites or along an ecological gradient (Anderson et al. 2011). Temporal diversity is a similar concept, where beta-diversity is calculated for the same location at different times, and in conjunction with a suitable null model the analysis of temporal beta-diversity can be used to determine whether changes in assemblages across time are due to deterministic processes or stochastic colonisation and extinction events (Baselga et al. 2015). Temporal beta-diversity sensu stricto has been much less studied relative to spatial beta-diversity (but see Baselga et al. 2015, Tonkin et al. 2017). Beta-diversity can be calculated using a variety of different approaches (Anderson et al. 2011) and in this study we focus on the use of dissimilarity indices to calculate beta-diversity, in par-ticular Sørensen dissimilarity. Recent work has partitioned the Sørensen index into turnover and nestedness-resultant dissimilarity/richness difference components (Baselga 2010, 2013, Carvalho et al. 2012).
In this study, we use a unique time-series dataset of arthro-pods sampled in native forest fragments over five years in the Azores (Borges et al. 2017) to investigate the differences in turnover dynamics of native and non-native species. Using TIBE and past studies on island theory in habitat islands (Matthews 2015) as theoretical frameworks, we make two predictions. First, based on the above points, we predict that temporal beta-diversity will be greater for non-native species than for native species (Prediction 1). We use a null model approach to determine whether turnover of species through time is due to deterministic processes or stochastic coloni-sation and extinction events, and linear modelling selection
Ecolog
y in a human-dominated
W
orld
to assess if any factors (i.e. elevation, climate, disturbance) are driving variation in temporal beta-diversity between plots. Second, as the invasion process is predicted to be on-going (Burns 2015, Seebens et al. 2017), based on the TIBE, we predict that colonisation rate will be greater than extinc-tion rate for non-native species, whilst colonisaextinc-tion rate will be roughly equivalent to extinction rate for native species (Prediction 2).
Our dataset is ideal for examining temporal beta-diversity patterns of native and non-native species in habitat islands as the regular census interval allows us to accurately describe colonisation and extinction events (and thus turnover), and the Azorean arthropod fauna contains a high proportion of non-native species (Borges et al. 2010). Confirming or invali-dating these predictions will enable a better understanding of the turnover dynamics of non-native species in fragmented landscapes and will provide important information to aid in the conservation of fragmented natural areas impacted by the spread and establishment of non-native species in currently threatened ecosystems.
Material and methods
Study site and data collection
Arthropods were sampled using nine 50 × 50 m plots located in four native fragments of pristine forest on Terceira Island in the Azores. The plots were setup within the ISLANBIODIV project (Borges et al. 2017, Cicconardi et al. 2017). Arthropods were sampled using a passive flight inter-ception trap called a SLAM (sea, land, and air malaise) trap. The collecting bottles were collected and changed every three months; thus, each sample covers one season of the year. For the current study, we used data sampled over the years 2012– 2016 (inclusive). The arthropods were grouped by their native and non-native colonisation strategies. A more com-prehensive outline of the study site (including a map) and the sampling methodology is provided in Supplementary material Appendix 1 (see also Borges et al. 2017).
For the climatic data, we used data from the CIELO Model (Azevedo et al. 1999). The CIELO model is a simple parcel model, based on the transformations experienced by an air mass ascending a mountain, which simulates the evo-lution of an air parcel’s physical properties, starting from sea level. Two principal components analysis (PCA) axes were calculated using the climatic variables: mean annual tem-perature, annual rainfall and relative humidity. The PCA was undertaken using the ‘vegan’ R package (Oksanen et al. 2013), and we took the first two axes as they explained ~99% of the variance. The first axis (P1) corresponded to differences in temperature and precipitation, whilst the second axis (P2) corresponded more to differences in humidity. In addition, we used an ‘index of disturbance’ developed by Cardoso et al. (2013) for the Azores that models disturbance by considering landscape configuration and proximity of human-modified habitat to each patch of pristine native forest (Supplementary
material Appendix 1). We also calculated the elevation of each plot using a digital elevation model (DEM) for Terceira Island.
We pooled the samples within each year to create yearly datasets for each of the nine plots. Where the same species had been sampled in multiple samples within a single year we combined records and summed the abundances. We then converted these data into presence–absence matrices, such that for each of the nine plots we had five presence–absence matrices, one for each of the five sampling years (2012–2016).
Calculating temporal beta-diversity: Prediction 1
To examine whether temporal beta-diversity was greater for non-natives than for natives (Prediction 1), we used both pairwise and multiple-time temporal beta-diversity frame-works. First, for each plot we constructed a presence–absence matrix for the pooled 2013 samples (the first full year of sam-pling, Supplementary material Appendix 1) and the pooled 2016 samples. We then used the ‘beta.temp’ function in the ‘betapart’ R package (Baselga et al. 2017) to calculate par-titioned pairwise temporal beta-diversity (Sorensen index) between these two years, and we stored both partition values (i.e. temporal turnover and temporal nestedness-dissimilarity) as well as the overall Sorensen’s dissimilarity value. This analy-sis was undertaken separately for native and non-native spe-cies. To determine whether the observed pairwise temporal beta-diversity and partition values were significantly differ-ent from random expectation, we followed Baselga et al. (2015) and used an FE null model (Ulrich and Gotelli 2007) whereby row (site species richness) marginal totals were allowed to vary and column (species incidences) marginal totals are fixed. In this context, the FE null model charac-terises a situation whereby species randomly colonise and go extinct at sites, from a common regional pool (Baselga et al. 2015). This null model was implemented using the ‘c0’ algo-rithm in the ‘vegan’ R package (Oksanen et al. 2013). The null model was used to randomise the 2016 presence/absence matrix, which was then compared to the empirical 2013 presence/absence matrix, using the ‘beta.temp’ function. This process was repeated 1000 times, for both the native and the non-native species data; the overall dissimilarity value, and the two partition values, was stored in each instance. Using these null model values, we calculated the Z-scores for the six metrics (the three temporal beta-diversity metrics, for both the native and non-native presence/absence matrices). A two-sided p-value was also calculated for each Z-score. To ensure that our results were consistent across the two main beta-diversity partitioning frameworks, we also calculated temporal beta-diversity and re-ran the above analyses using the Carvalho partitioning framework (Carvalho et al. 2012), the Sorensen family of beta-diversity metrics and the BAT R package (Cardoso et al. 2014). The Carvalho partition-ing framework differs from the Baselga framework in that it partitions overall beta-diversity into turnover and richness difference components, instead of turnover and nestedness-dissimilarity components.
Ecolog
y in a human-dominated
W
orld
Spatial beta-diversity studies have shown that pairwise beta-diversity metrics and multisite beta-diversity metrics (i.e. spatial beta-diversity aggregated across multiple sites) can reveal different patterns (Baselga 2013). Thus, we adapted the ‘beta.temp’ function to calculate partitioned multiple-time dissimilarity, again based on the Sorensen index. This is an aggregate measure that enables the calculation of tem-poral beta-diversity across multiple time periods for the same site. We calculated multiple-time dissimilarity for both native and non-native species for four years (2013–2016) and compared the resultant beta-diversity values with their pairwise counterparts.
Calculating turnover: Prediction 2
Following Burns (2015), turnover was calculated as the total number of colonisation and extinction events across the five years (2012–2016). That is, colonisation was considered to have occurred if a species was not present in a plot in year i, but was present in year i + 1. Equally, under this turn-over framework, an extinction event was considered to have occurred if a species was present in a plot in year i, but not in year i + 1.
To test Prediction 2 (that colonisation rate will be greater than extinction rate for non-native species, but equivalent to extinction rate for native species), we calculated the num-ber of turnover events for each individual species, across all nine plots. Reduced major axis regression was then used to determine how colonisation rate varied with extinction rate (Burns 2015) as both variables (colonisation and extinction rate) contained random error; in such cases, standard lin-ear regression underestimates the slope of the relationship. The regression models were calculated using the ‘lmodel2’ R package (Legendre 2014), and we used the standard major axis (SMA) method. Models were fitted for native and non-native species separately. In this analysis, a slope significantly greater than one, or an intercept significantly greater than zero, would indicate that the colonisation rate exceeded extinction rate (for either native or non-native species) and thus that the number of native/non-native species increased in the fragments over the five years, and vice versa.
Explaining variation in temporal beta-diversity
To determine whether any of our environmental variables explained variation in the turnover component of temporal beta-diversity, we undertook a model comparison approach using generalised linear models (GLMs). We used GLMs with the Gaussian family in these analyses, and normality of the response variables was assessed using the Shapiro–Wilks test (in both cases the null hypothesis that the response vari-able was normally distributed could not be rejected). We ran the model comparison twice, once for each of two response variables: 1) the pairwise temporal turnover beta-diversity partition values of native species, and 2) the pairwise tem-poral turnover beta-diversity partition values of non-native
species. As predictor variables, we started with elevation (log transformed), disturbance (log transformed) and two climatic PCA axes (P1 and P2). All predictors were standardised to have a mean of 0 and standard deviation of 1 to enable com-parison of the effect sizes. Multicollinearity was assessed using variance inflation factors (VIFs), which resulted in P1 being removed from all subsequent analyses as it was very highly correlated with elevation. The three remaining predictor vari-ables (elevation, disturbance and P2) all had VIFs under ten. Using these response and predictor variables, we com-pared a full set of generalised linear models (GLMs) within an information theoretic approach (Burnham and Anderson 2002). For each response variable, a full set of models were compared using Akaike’s information criterion corrected for small sample size (AICc; Burnham and Anderson 2002). The model with the lowest AICc was considered the best model, whilst all models with ΔAICc <= 2 were considered to have similar support. As our data were sampled using 50 × 50 m quadrats nested within fragments, we used a spatial auto-covariate within an auto-Gaussian regression approach to account for the experimental design. First, for each response variable, we fitted the global model and extracted the als. We then created a spatial autocovariate using the residu-als (Crase et al. 2012) and the ‘autocov_dist’ function in the ‘spdep’ R package (Bivand 2017). The neighbourhood radius was set to encompass all plots, and we used the ‘inverse’ type and row standardised (W) style settings. The spatial autoco-variate was fixed in the model selection. For all models with ΔAICc <= 2, we also checked the residuals for homoscedas-ticity, and we checked for any remaining spatial autocorre-lation in the residuals using the ‘spdep’ R package (Bivand 2017), the ‘nb2listw’ function and row standardised weights. We also re-ran the model selection analyses using Gaussian mixed effect models with ‘fragment’ as a random effect (ran-dom intercept); however, the variance of the ran(ran-dom effect was very close to zero in both cases and these results are not discussed further.
Sensitivity analyses
We ran two sensitivity analyses to ensure our results were robust. First, to ensure our sampling was sufficient we calcu-lated sampling completeness estimates for each year in each plot using the iNEXT R package (Hill number order q = 0, Hsieh et al. 2016). Second, we set up a tenth plot in which we placed three SLAM traps instead of one to determine whether the use of a single SLAM trap in each of the plots was sufficient to capture the relevant community properties. A full methodology for each of the sensitivity analyses is pro-vided in Supplementary material Appendix 1. All analyses were undertaken using R (ver. 3.4.3, R Core Team).
Data deposition
Data available from the Dryad Digital Repository: < http:// dx.doi.org/10.5061/dryad.8rg375s > (Matthews et al. 2018).
Ecolog
y in a human-dominated
W
orld
Results
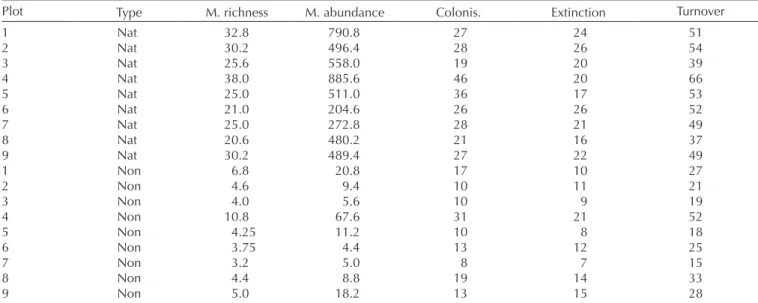
Dataset summaryOver the five years, we sampled 28 704 arthropod specimens, representing 147 species and morpho species (no. of native sp. = 89 and no. of non-native sp. = 58), across ten plots (nine plots were used in the main analysis and a tenth plot was used in the sensitivity tests). Across the nine plots that formed the main basis of this study, the mean richness (i.e. mean of each plot across the five years) of species in a plot ranged from 21 to 38 and 3 to 11, for native and non-native species respectively (Table 1). Mean total abundance (i.e. abundance of all species in a plot) ranged from 205 to 886 and 4 to 68 for native and non-native species respectively (Table 1).
Temporal beta-diversity
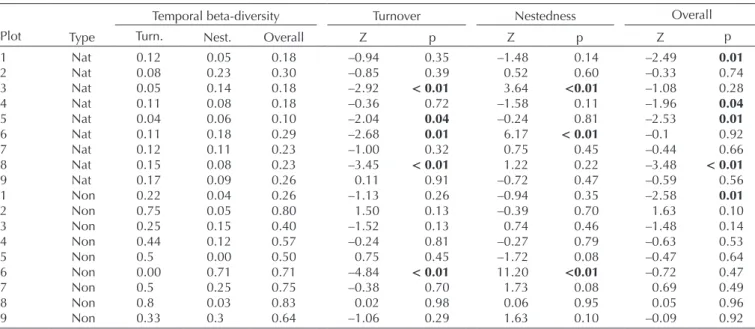
For all nine plots, overall temporal beta-diversity was larger for non-native species than for native species (Table 2; Fig. 1), confirming Prediction 1. The temporal turnover component of overall pairwise beta-diversity was larger than the temporal nestedness-dissimilarity component for all but one plot for non-native species, and for five of the nine plots for native species (Fig. 1). For overall temporal beta-diversity, the Z-scores were negative for all but one plot for native species, whilst Z-scores were both posi-tive and negaposi-tive for non-naposi-tive species (Table 2). Four of the overall pairwise beta Z-scores for native species were significant, whilst only one of the overall pairwise beta Z-scores for non-native species was significant (Table 2). The null model results for the pairwise temporal beta-diversity partitions were similar to the results for the overall
pairwise temporal beta-diversity values (Table 2). This out-come did not change when the Carvalho pairwise beta-diversity partitioning framework was used rather than the Baselga approach (Supplementary material Appendix 2): overall pairwise beta-diversity and the two partitions were all positively and significantly correlated between the two approaches (all Pearson’s correlation coefficients > 0.90, and all p-values < 0.001), and the same overall picture emerged regardless of the approach used (compare Fig. 1 with Supplementary material Appendix 2 Fig. A3).
Using multiple-time dissimilarity produced similar results to the pairwise temporal beta-diversity analysis (Supplementary material Appendix 3 Fig. A4): overall tem-poral beta-diversity was larger for non-native species than for native species, for all nine plots, and on average the temporal nestedness-dissimilarity component represented a larger pro-portion of total temporal beta-diversity for native species than for native species. One interesting difference was non-native species in plot 6 (compare Fig. 1 with Supplementary material Appendix 3 Fig. A4), whereby the pairwise measure indicated that the nestedness-dissimilarity component rep-resented 100% of overall beta-diversity, but only 16% using multiple-time dissimilarity.
Differences in colonisation and extinction rates
Reduced major axis regression of the number of colonisation events against the number of extinction events revealed that, contrary to Prediction 2, the slope of the relationship was significantly greater than one for both native (slope = 1.26; 95% CI = 1.11–1.44) and non-native species (slope = 1.28; 95% CI = 1.16–1.42) (Fig. 2), indicating that the colo-nisation rate exceeded the extinction rate for both groups. Table 1. The mean richness (M. richness), mean abundance (M. abundance), and the number of colonisation (Colonis.), extinction, and total turnover events of arthropod species across nine native forest plots on Terceira Island, in the Azores. For each plot, the data are provided for native (Nat) and non-native (Non) species separately. Each plot was sampled multiple times across five years and samples were pooled to create five yearly samples (2012–2016). An extinction event was deemed to have occurred if a species was present in year i but not in year
i +1, and vice versa for a colonisation event (plot notation as in Supplementary material Appendix 1 Table A1 and Fig. A1).
Plot Type M. richness M. abundance Colonis. Extinction Turnover
1 Nat 32.8 790.8 27 24 51 2 Nat 30.2 496.4 28 26 54 3 Nat 25.6 558.0 19 20 39 4 Nat 38.0 885.6 46 20 66 5 Nat 25.0 511.0 36 17 53 6 Nat 21.0 204.6 26 26 52 7 Nat 25.0 272.8 28 21 49 8 Nat 20.6 480.2 21 16 37 9 Nat 30.2 489.4 27 22 49 1 Non 6.8 20.8 17 10 27 2 Non 4.6 9.4 10 11 21 3 Non 4.0 5.6 10 9 19 4 Non 10.8 67.6 31 21 52 5 Non 4.25 11.2 10 8 18 6 Non 3.75 4.4 13 12 25 7 Non 3.2 5.0 8 7 15 8 Non 4.4 8.8 19 14 33 9 Non 5.0 18.2 13 15 28
Ecolog
y in a human-dominated
W
orld
The intercept of the relationship was not significantly dif-ferent from zero for either native (intercept = 0.17; 95% CI = –0.22–0.51) or non-native (intercept = –0.11; 95%
CI = –0.38–0.13) species. The R2 values for both regression models were: 0.64 and 0.86 for the native and non-native species models, respectively.
Table 2. Pairwise temporal beta-diversity values for arthropod species sampled in 2013 and 2016 in nine native forest plots on Terceira Island, in the Azores. For each plot, the data are provided for native (Nat) and non-native (Non) species separately. Overall temporal beta-diversity values (Sorensen dissimilarity index) are provided in addition to the temporal turnover (Turn.) and temporal nestedness-dissimilarity (Nest.) components of overall temporal beta-diversity. For the two partition values and the overall temporal beta-diversity value, significance was determined using an FE null model (1000 iterations). For each of the three beta-diversity values, the Z-score (Z) and associated p-value (p) are provided (see ‘Material and methods’). p-values significant at the 0.05 level are highlighted in bold (plot notation as in Supplementary material Appendix 1 Table A1 and Fig. A1). The overall temporal beta-diversity differs very slightly from the sum of the turnover and nestedness components in certain plots due to rounding error.
Plot Type
Temporal beta-diversity Turnover Nestedness Overall
Turn. Nest. Overall Z p Z p Z p
1 Nat 0.12 0.05 0.18 –0.94 0.35 –1.48 0.14 –2.49 0.01 2 Nat 0.08 0.23 0.30 –0.85 0.39 0.52 0.60 –0.33 0.74 3 Nat 0.05 0.14 0.18 –2.92 < 0.01 3.64 <0.01 –1.08 0.28 4 Nat 0.11 0.08 0.18 –0.36 0.72 –1.58 0.11 –1.96 0.04 5 Nat 0.04 0.06 0.10 –2.04 0.04 –0.24 0.81 –2.53 0.01 6 Nat 0.11 0.18 0.29 –2.68 0.01 6.17 < 0.01 –0.1 0.92 7 Nat 0.12 0.11 0.23 –1.00 0.32 0.75 0.45 –0.44 0.66 8 Nat 0.15 0.08 0.23 –3.45 < 0.01 1.22 0.22 –3.48 < 0.01 9 Nat 0.17 0.09 0.26 0.11 0.91 –0.72 0.47 –0.59 0.56 1 Non 0.22 0.04 0.26 –1.13 0.26 –0.94 0.35 –2.58 0.01 2 Non 0.75 0.05 0.80 1.50 0.13 –0.39 0.70 1.63 0.10 3 Non 0.25 0.15 0.40 –1.52 0.13 0.74 0.46 –1.48 0.14 4 Non 0.44 0.12 0.57 –0.24 0.81 –0.27 0.79 –0.63 0.53 5 Non 0.5 0.00 0.50 0.75 0.45 –1.72 0.08 –0.47 0.64 6 Non 0.00 0.71 0.71 –4.84 < 0.01 11.20 <0.01 –0.72 0.47 7 Non 0.5 0.25 0.75 –0.38 0.70 1.73 0.08 0.69 0.49 8 Non 0.8 0.03 0.83 0.02 0.98 0.06 0.95 0.05 0.96 9 Non 0.33 0.3 0.64 –1.06 0.29 1.63 0.10 –0.09 0.92
Figure 1. Pairwise temporal beta-diversity values for native and non-native arthropod species across nine plots of native forest on Terceira Island, in the Azores. For each plot, temporal beta-diversity was calculated using the pooled 2013 samples and the pooled 2016 samples. For each plot, temporal beta-diversity was calculated separately for native species (blue bars) and non-native species (red bars). The height of each bar corresponds to the overall temporal beta-diversity. Overall temporal beta was also partitioned into nestedness and turnover components using the Baselga partition approach (Baselga et al. 2017). Within each bar, the dark shaded area rising from the x-axis corre-sponds to the nestedness component of overall temporal beta diversity. Thus, the lighter shaded area within each bar that rises from the dark shaded area corresponds to the turnover component.
Ecolog
y in a human-dominated
W
orld
Explaining variation in temporal beta-diversity between plots
When the turnover partition (of overall pairwise temporal beta-diversity) values were used as the response variables in a set of GLMs, the selection procedure indicated that the only predictor variable in both the best native and non-native species models was the fixed spatial autocovariate, and there were no additional models within 2 ΔAICc of either best model. Re-running the model selection using the turnover component of multiple-time dissimilarity produced the same overall results.
Sensitivity analyses
Sample completeness estimates indicated that our sampling was sufficient: the mean sample completeness estimate across all years and plots was 0.97 (range = 0.81 to 1.00, the results for each year and plot are presented in Supplementary mate-rial Appendix 4 Table A2). Using three SLAM traps in a plot rather than one did not result in substantially different sam-pled communities according to various measures of diversity (Supplementary material Appendix 4).
Discussion
We have undertaken an evaluation of the differences in temporal beta-diversity patterns between native and non-native arthropod species across nine non-native forest plots in the Azores for which a time series of five years is available (2012–2016).
Non-native species have larger rates of temporal beta-diversity than native species in Azorean forest fragments
The results of our temporal beta-diversity analyses (both pairwise and multiple-time dissimilarity) indicated that, in accordance with Prediction 1, temporal beta-diversity was considerably greater for non-native species than for native species, across all nine plots. In addition, with one excep-tion (plot 6 when using pairwise beta-diversity, Fig. 1), for non-native species the largest component of temporal beta-diversity was by far the temporal turnover partition, indicat-ing an actual turnover of species rather than nested patterns in richness (Baselga partition) or richness differences (Carvalho partition) between years.
Burns (2015), in his theory of island biogeography for exotic species (TIBE), attributed differences in turnover rates between natives and non-natives to standard island biogeo-graphical variables. However, Burns was focused on true islands. In our study system of habitat islands, we found that, in regard to overall pairwise temporal beta-diversity for non-native species, the null model analyses were only significant in one case, and the signs of the Z-scores varied between the plots (Table 2). These findings, in combination with pre-vious work in our study system (Borges et al. 2006, 2008, Florencio et al. 2016), appear to support the notion that the distribution of non-native arthropods in Azorean native for-ests is driven by stochastic processes and occupancy dynamics, possibly due to source-sink processes (see also Borges et al. 2008). In a study of temporal beta-diversity patterns of birds in France, Baselga et al. (2015, p. 9) also found that temporal changes in assemblages were not significantly different from
Figure 2. The relationship between the number of colonisation events and the number of extinction events in native (a) and non-native (b) arthropod species sampled in nine native forest plots on Terceira Island in the Azores. Each plot was sampled multiple times across five years and samples were pooled to create five yearly samples. Turnover was then calculated as the total number of colonisation and extinc-tion events across the five years (see ‘Material and methods’). In (a) and (b), the black line is the isometric line (i.e. intercept of zero and slope of 1) and the red line is the best fit line from reduced major axis regression. In both cases the best fit regression line is significantly greater than one.
Ecolog
y in a human-dominated
W
orld
a null model and concluded that ‘the observed changes in species composition of local bird assemblages might be the consequence of stochastic processes in which species popula-tions appeared and disappeared from specific localities in a random-like way’.
Many non-native arthropod species in the Azores are adapted to human land-uses (Borges et al. 2008, Rigal et al. 2018), and thus we would expect there be a large number, and thus high potential for mass effects (Shmida and Wilson 1985), of non-natives in the disturbed landscapes surround-ing the fragments (see also Borges et al. 2008). The Azores has undergone substantial land use change since human colo-nisation of the archipelago (Triantis et al. 2010), and native forest fragments in the Azores are characterised by hard boundaries, i.e. there is an abrupt change from native forest habitat to anthropogenic habitat (Borges et al. 2006, 2008). As such, there are likely to be large mass effects and a con-stant supply of non-native individuals permeating into the native forest where they frequently undergo local extinction and re-colonisation, leading to high beta-diversity through time. Thus, it seems likely that it is not just the size of the native habitat that underpins the colonisation rate of non-natives (as in true islands cf. Burns 2015) but also the amount of surrounding anthropogenic habitat and size of the non-native source pool, which is known to be large in the Azores (Borges et al. 2010). More detailed studies focusing on the habitat affinities and dispersal ecology of non-native species are needed to further explore this possibility. Interestingly, our disturbance metric, that incorporates surrounding land use, was not an important predictor of non-native temporal beta-diversity in the linear model selection analysis. However, as all of the native forest fragments on Terceira are surrounded by human land uses, it is likely that there was simply not enough variation in the disturbance metric between plots.
In regards to the processes underpinning temporal beta-diversity patterns of native species, the results are more equivocal. Overall pairwise temporal beta-diversity was sig-nificantly lower than expected by chance in four of the nine plots for native species, in comparison to only one of the nine plots for non-native species. This indicates a stronger role for deterministic processes driving temporal beta-diversity and turnover in native species assemblages (Baselga et al. 2015). However, as with non-native species, none of our predictor variables were found to explain variation in the temporal beta-diversity of native species. The reasons for this finding are unclear but could simply be due to the fact that our exper-imental design did not allow us to test for the importance of other biogeographic variables such as area on turnover (MacArthur and Wilson 1967). Further studies examining the turnover dynamics of native and non-native species in habitat fragments are needed.
Colonization and extinction rates for native and non-native species
Our Prediction 2, that colonisation rate will be greater than extinction rate for non-native species, whilst colonisation rate
will be roughly equivalent to extinction rate for native spe-cies, was not borne out by the data. Whilst we observed that the colonisation rate was greater than the extinction rate for non-natives, contrary to expectations we found a similar pat-tern for native species (Fig. 2). Whilst this finding is expected for non-native species, these results could imply either that many of the native species in the fragments have high disper-sal ability and are easily able to disperse between plots and fragments, or possibly that native species have not yet reached equilibrium following substantial habitat loss over the last few centuries. An alternative explanation is that our sampling did not accurately record all colonisation and extinction events during the study period. Previous work on turnover on islands has shown that the calculation of turnover rate is sensitive to the grain size of the time series data analysed (e.g. were samples carried out every year or every ten years) (Russell et al. 1995, Whittaker et al. 2000). Considering these issues, inevitably we have not recorded every true turnover event (i.e. crypto-turnover), and equally, due to sampling error, we have likely missed individuals in certain instances and thus erroneously recorded turnover events (i.e. pseudo-turnover). However, sampling was every three months (as opposed to multiple years in most island studies), and thus a species had to be absent across all the monthly samples for an extinction event to be classified. We also carried out sen-sitivity analyses to ensure our sampling effort was sufficient. As a result, we are confident that our sampling protocol has generated data of sufficient quality to test our predictions.
Implications for conservation and biodiversity management
Non-native species are thought to be leading drivers of contemporary species extinctions, and the issue seems particularly acute in true and habitat island systems (Sax and Gaines 2003, Cardoso et al. 2010, Bellard et al. 2016). However, the biogeography of non-native species is not well known. Specifically, it is not known whether standard bio-geographical theory and metrics derived from the study of native species can be accurately applied to non-native taxa. As a result of this uncertainty, a number of recent studies have focused on examining the differences and similari-ties between natives and non-natives using classic biogeo-graphical and ecological patterns, such as the ISAR and the abundance–occupancy relationship (Blackburn et al. 2008, Rigal et al. 2013, Burns 2015). The results of our study con-tribute towards filling this knowledge gap by showing that it cannot be assumed a priori that native and non-native taxa within the same community are similarly assembled and will follow the same temporal dynamics.
Importantly, our results indicate that it might not be possible to apply simple biogeographical principles (Wilson and Willis 1975) when devising non-native species manage-ment plans in fragmanage-mented landscapes. Rather, managemanage-ment should be based on the results of biogeographical and ecolog-ical studies explicitly focused on non-native taxa. A corollary of this statement is that there is an urgent need for additional
Ecolog
y in a human-dominated
W
orld
studies focused on outlining and testing biogeographical the-ory in the context of non-native species (Patiño et al. 2017). In the native forest sampled in our study, the high rate of stochastic turnover of non-native species that we observed indicates that attempts to simply reduce the populations of non-native species in situ within native habitats may not be successful. This is because for many non-native species the native habitat is likely just a sink, and the constant immi-gration of individuals from anthropogenic source habitats in close proximity to the native habitats (i.e. mass effects) means local extinction of non-natives within the native for-est is unlikely to be permanent. Thus, a more efficient future management strategy and land-use policy will be to interrupt these source-sink dynamics by improving the harsh boundar-ies between native habitat and adjacent anthropogenic habi-tat, and in the longer term to design and create a more graded landscape mosaic (Lindenmayer and Fischer 2006) whereby contrasting land uses are not simply knitted together in an ad hoc fashion. The high turnover of non-native species also brings into question the ability of non-natives to, amongst other things, replace the functional roles of extirpated native species (Whittaker et al. 2014, Rigal et al. 2018) or increase functional redundancy in fragmented landscapes. Functional diversity studies that focus on non-native species are often based on static time periods (e.g. a sample from one year) and their conclusions thus do not account for the fact that many non-native species present in a patch may simply be ephemeral members of a given community.
Acknowledgements – Andrés Baselga kindly answered questions
related to the calculation and interpretation of beta-diversity. Rob Whittaker, François Rigal and three anonymous reviewers provided helpful comments on an earlier version of the manuscript.
Funding – A large number of students financed by the EU Programs
ERASMUS and EURODYSSÉE sorted the samples prior to species assignment by one of us (PB), and we are grateful to all of them: Adal Humberto Díaz Raya, Alejandra Ros Prieto, David Rodilla Rivas, Daniel Ehrhart, Juan Ignacio Pitarch Peréz, Juan Manuel Taboada Alvarez, Helena Marugán Páramo, Laura Cáceres Sabater, Laura Gallardo, Marija Tomašić, Óscar García Contreras, Percy de Laminne de Bex, Ruben Murillo Garcia, Sergio Fernandez, Sophie Wallon, and William Razey.This manuscript was also partly financed by Portuguese National Funds, through FCT – Fundação para a Ciência e a Tecnologia, within the project UID/BIA/00329/2013 and Portuguese FCT-NETBIOME – ISLANDBIODIV grant 0003/2011.
Author contributions – TM designed the analytical study. PB
designed the sampling methodology and collected the data with RC and RN. TM analyzed the data. TM wrote the manuscript, with the help of JS and PB.
Permits – The Natural Park of Terceira (Azores) provided the
necessary authorization for sampling.
References
Anderson, M. J. et al. 2011. Navigating the multiple meanings of β diversity: a roadmap for the practicing ecologist. – Ecol. Lett. 14: 19–28.
Azevedo, E. B. d. et al. 1999. Modelling the local climate in island environments: water balance applications. – Agric. Water Manage. 40: 393–403.
Baselga, A. 2010. Partitioning the turnover and nestedness components of beta diversity. – Global Ecol. Biogeogr. 19: 134–143.
Baselga, A. 2013. Multiple site dissimilarity quantifies compositional heterogeneity among several sites, while average pairwise dissimilarity may be misleading. – Ecography 36: 124–128. Baselga, A. et al. 2015. Temporal beta diversity of bird assemblages
in agricultural landscapes: land cover change vs. stochastic processes. – PLoS One 10: e0127913.
Baselga, A. et al. 2017. betapart: partitioning beta diversity into turnover and nestedness components. – R package.
Bellard, C. et al. 2016. Alien species as a driver of recent extinctions. – Biol. Lett. 12: 20150623.
Bivand, R. 2017. spdep: spatial dependence: weighting schemes, statistics and models. – R package.
Blackburn, T. M. et al. 2004. Avian extinction and mammalian introductions on oceanic islands. – Science 305: 1955–1958. Blackburn, T. M. et al. 2008. The island biogeography of exotic
bird species. – Global Ecol. Biogeogr. 17: 246–251.
Blackburn, T. M. et al. 2016. On the island biogeography of aliens: a global analysis of the richness of plant and bird species on oceanic islands. – Global Ecol. Biogeogr. 25: 859–868. Borges, P. A. V. et al. 2006. Invasibility and species richness of island
endemic arthropods: a general model of endemic vs. exotic species. – J. Biogeogr. 33: 169–187.
Borges, P. A. V. et al. 2008. Insect and spider rarity in an oceanic island (Terceira, Azores): true rare and pseudo-rare species. – In: Fattorini, S. (ed.), Insect ecology and conservation. Research Signpost, pp. 47–70.
Borges, P. A. V. et al. 2010. List of arthropods (Arthropoda). – In: Borges, P. A. V. et al. (eds), A list of the terrestrial and marine biota from the Azores. Princípia, pp. 179–246.
Borges, P. A. V. et al. 2017. Seasonal dynamics of arthropods in the humid native forests of Terceira Island (Azores). – Arquipelago Life Mar. Sci. 34: 105–122.
Burnham, K. P. and Anderson, D. R. 2002. Model selection and multi-model inference: a practical information-theoretic approach. – Springer.
Burns, K. C. 2015. A theory of island biogeography for exotic species. – Am. Nat. 186: 441–451.
Cardoso, P. et al. 2010. Drivers of diversity in Macaronesian spiders and the role of species extinctions. – J. Biogeogr. 37: 1034–1046.
Cardoso, P. et al. 2013. Integrating landscape disturbance and indicator species in conservation studies. – PLoS One 8: e63294.
Cardoso, P. et al. 2014. BAT – biodiversity assessment tools, an R package for the measurement and estimation of alpha and beta taxon, phylogenetic and functional diversity. – Methods Ecol. Evol. 6: 232–236.
Carvalho, J. C. et al. 2012. Determining the relative roles of species replacement and species richness differences in generating beta-diversity patterns. – Global Ecol. Biogeogr. 21: 760–771. Cicconardi, F. et al. 2017. MtDNA metagenomics reveals
large-scale invasion of belowground arthropod communities by introduced species. – Mol. Ecol. 26: 3104–3115.
Clavero, M. and García-Berthou, E. 2005. Invasive species are a leading cause of animal extinctions. – Trends Ecol. Evol. 20: 110.
Ecolog
y in a human-dominated
W
orld
Crase, B. et al. 2012. A new method for dealing with residual spatial autocorrelation in species distribution models. – Ecography 35: 879–888.
Didham, R. K. et al. 2007. Interactive effects of habitat modifica-tion and species invasion on native species decline. – Trends Ecol. Evol. 22: 489–496.
Dyer, E. E. et al. 2017. The global distribution and drivers of alien bird species richness. – PLoS Biol. 15: e2000942.
Ferger, S. W. et al. 2017. Synergistic effects of climate and land use on avian beta-diversity. – Divers. Distrib. 23: 1246–1255. Florencio, M. et al. 2016. The role of plant fidelity and land-use
changes on island exotic and indigenous canopy spiders at local and regional scales. – Biol. Invasions 18: 2309–2324.
Hsieh, T. C. et al. 2016. iNEXT: an R package for rarefaction and extrapolation of species diversity (Hill numbers). – Methods Ecol. Evol. 7: 1451–1456.
Karp, D. S. et al. 2018. Agriculture erases climate-driven β-diversity in Neotropical bird communities. – Global Change Biol. 24: 338–349.
Legendre, P. 2014. lmodel2: model II regression. – R package. Lindenmayer, D. B. and Fischer, J. 2006. Habitat fragmentation
and landscape change: an ecological and conservation synthesis. – Island Press.
MacArthur, R. H. and Wilson, E. O. 1967. The theory of island biogeography. – Princeton Univ. Press.
Matthews, T. J. 2015. Analysing and modelling the impact of habitat fragmentation on species diversity: a macroecological perspective. – Front. Biogeogr. 7: 60–68.
Matthews, T. J. et al. 2018. Data from: Differential temporal beta-diversity patterns of native and non-native arthropod species in a fragmented native forest landscape. – Dryad Digital Reposi-tory, <http://dx.doi.org/10.5061/dryad.8rg375s>.
McKinney, M. L. and Lockwood, J. L. 1999. Biotic homogeniza-tion: a few winners replacing many losers in the next mass extinction. – Trends Ecol. Evol. 14: 450–453.
Mooney, H. A. and Hobbs, R. J. (eds) 2000. Invasive species in a changing world. – Island Press.
Oksanen, J. F. et al. 2013. Package ‘vegan’. – R package ver. 2.0-9. Patiño, J. et al. 2017. A roadmap for island biology: 50 fundamental
questions after 50 years of the theory of island biogeography. – J. Biogeogr. 44: 963–983.
Pyšek, P. 1998. Alien and native species in central European urban floras: a quantitative comparison. – J. Biogeogr. 25: 155–163.
Rigal, F. et al. 2013. Integration of non-indigenous species within the interspecific abundance–occupancy relationship. – Acta Oecol. 48: 69–75.
Rigal, F. et al. 2018. Functional traits of indigenous and exotic ground-dwelling arthropods show contrasting responses to land-use changes in an oceanic island, Terceira, Azores. – Divers. Distrib. 24: 36–47.
Russell, G. J. et al. 1995. A century of turnover: community dynamics at three timescales. – J. Anim. Ecol. 64: 628–641. Sala, O. E. et al. 2000. Global biodiversity scenarios for the year
2100. – Science 287: 1770–1774.
Sax, D. F. and Gaines, S. D. 2003. Species diversity: from global decreases to local increases. – Trends Ecol. Evol. 18: 561–566.
Sax, D. F. et al. 2002. Species invasions exceed extinctions on islands worldwide: a comparative study of plants and birds. – Am. Nat. 160: 766–783.
Seebens, H. et al. 2017. No saturation in the accumulation of alien species worldwide. – Nat. Commun. 8: 14435.
Sgarbi, L. F. and Melo, A. S. 2017. You don’t belong here: explaining the excess of rare species in terms of habitat, space and time. – Oikos doi:10.1111/oik.04855
Shmida, A. and Wilson, M. V. 1985. Biological determinants of species diversity. – J. Biogeogr. 12: 1–20.
Tonkin, J. D. et al. 2017. Seasonality and predictability shape temporal species diversity. – Ecology 98: 1201–1216.
Triantis, K. A. et al. 2010. Extinction debt on oceanic islands. – Ecography 33: 285–294.
Ulrich, W. and Gotelli, N. J. 2007. Null model analysis of species nestedness patterns. – Ecology 88: 1824–1831.
Whittaker, R. J. and Fernández-Palacios, J. M. 2007. Island biogeography: ecology, evolution, and conservation. – Oxford Univ. Press.
Whittaker, R. J. et al. 2000. How to go extinct: lessons from the lost plants of Krakatau. – J. Biogeogr. 27: 1049–1064. Whittaker, R. J. et al. 2014. Functional biogeography of oceanic
islands and the scaling of functional diversity in the Azores. – Proc. Natl Acad. Sci. USA 111: 13709–13714.
Williamson, M. 1996. Biological invasions. – Chapman and Hall. Wilson, E. O. and Willis, E. O. 1975. Applied biogeography.
– In: Cody, M. L. and Diamond, J. M. (eds), Ecology and evolution of communities. Harvard Univ. Press, pp. 522–534.
Supplementary material (Appendix ECOG-03812 at < www. ecography.org/appendix/ecog-03812 >). Appendix 1–4.