Acknowledgments
First of all, I would like to thank my supervisor Dr. José António Rodrigues for accepting to be the supervisor of my PhD. I thank you for all the support, advices and discussions we have, which greatly contributed to my professional and personal development during these years. Thank you for giving me the freedom and autonomy to develop my work. I will forever cherish your constant support and effort during this task and all the trust you have given me.
To the Faculty of Sciences of the University of Porto and all the professors and staff, for the lessons, assistance and for being my second home for the past eleven years.
To Dr. Aquiles Araújo Barros for the opportunity to be a part of the Analytical Chemistry and Food Quality group (QuAQuA).
To Dr. Luís Ferreira Guido and Dr. Paulo Joaquim Almeida for all the support and assistance throughout my time in the group. A special thanks to Dr. Paulo Joaquim Almeida for, during a random laboratory class, introducing me to QuAQuA.
To Dr. Vlastimil Vyskočil, my host at the Department of Analytical Chemistry, Charles University, Prague, for the opportunity to work in his group and for all the support given during my stay. Your contribution, knowledge and advices were very important for the success of this work. I would also like to show gratitude for the good times we have spent during my stay in Prague.
I wish to thank all the people working at the Department of Analytical Chemistry at Charles University, Prague, for the positive working atmosphere during my stay, with a special acknowledge to Dr. Jiří Barek and all the students at the UNESCO Laboratory of Environmental Electrochemistry.
To Dra. Isabel Rocha for all the accessibility and help provided in the laboratory. To Dra. Zélia Azevedo for the help performing and evaluating the mass spectrometry experiments, which significantly contributed to the success of this work.
To Pedro Brandão and Rui Ferreira for helping me in some of the experimental work performed during my PhD.
To all my friends and colleagues at QuAQuA with whom I had the pleasure of working for the past years. In particular, I have to thank Luís, Manuela, Inês, Daniel, and more recently, Rodrigo, Pedro and Liliana. I thank you for all the good moments we have spent inside and outside the laboratory, and for all the help and support during my PhD. The good work environment you all provided was much appreciated.
To all my friends, more particularly to Carlos F., Cristiana P. and Diogo C., for all the good times, support, encouragement and patience during more difficult moments.
To my beloved girlfriend, for the constant support, incredible patience and for the everyday incentive to do and be better. I cherish and thank you all the moments we have shared throughout these years.
Last but definitely not least, to my parents and Alice, for always providing me with the best possible conditions, for all the love, support and patience throughout the years.
AUTHOR PUBLICATIONS RELATED TO THIS THESIS
Rui M. Ramos, Inês M. Valente and José A. Rodrigues. Talanta, 124 (2014) 146-151 Rui C. Ferreira, Rui M. Ramos, Luís M. Gonçalves, Paulo J. Almeida and José A. Rodrigues. Analyst, 140 (2015) 3648-3653
Rui M. Ramos, Luís M. Gonçalves, Vlastimil Vyskočil and José A. Rodrigues. Electrochemistry Communications, 63 (2016) 52-55
Rui M. Ramos, Pedro F. Brandão, Luís M. Gonçalves, Vlastimil Vyskočil and José A. Rodrigues. Journal of the Institute of Brewing, 123 (2017) 45-48
Pedro F. Brandão, Rui M. Ramos, Paulo J. Almeida and José A. Rodrigues. Journal of Agricultural and Food Chemistry, 65 (2017) 1037-1042
Pedro F. Brandão, Rui M. Ramos, Inês M. Valente, Paulo J. Almeida, Antónia M. Carro, Rosa A. Lorenzo and José A. Rodrigues. Analytical and Bioanalytical Chemistry, 409 (2017) 2885-2892
Rui M. Ramos, Luís M. Gonçalves, Vlastimil Vyskočil and José A. Rodrigues. Talanta, 169 (2017) 203-208
AUTHOR PUBLICATIONS NOT INCLUDED IN THIS THESIS
Inês M. Valente, Rui M. Ramos, Luís M. Gonçalves and José A. Rodrigues. Analytical Methods, 6 (2014) 9136-9141
Inês M. Valente, Hugo M. Oliveira, Carlos D. Vaz, Rui M. Ramos, António J. M. Fonseca, Ana R. J. Cabrita and José A. Rodrigues. Talanta, 167 (2017) 747-753
Financial support from the Fundação para a Ciência e a Tecnologia (FCT) as part of the POPH/FSE Programme through the PhD studentship with the reference SFRH / BD / 88166 / 2012
Resumo
A execução de diferentes atividades do dia-a-dia pode resultar na emissão de compostos voláteis para o meio envolvente. Do ponto de vista ambiental, a libertação de compostos voláteis para a atmosfera, em conjunto com as reações que aí ocorrem, tem sido a causa para um aumento constante do aquecimento global e deterioração da qualidade do ar. Para além disso, a libertação de voláteis de produtos com origem industrial tem a capacidade de provocar efeitos nefastos na saúde humana. Na área alimentar, a perceção dos aromas de um produto está relacionada com a presença de um ou mais compostos voláteis. A origem destes compostos pode advir de contaminações químicas externas durante a etapa de empacotamento ou armazenamento do produto, ou ser resultado da deterioração interna do alimento – através de processos como a oxidação lipídica, reações de Maillard ou devido à ação de microrganismos. Para um produtor, devido aos efeitos adversos que a presença ou libertação de voláteis possa ter na perceção sensorial dos seus produtos ou devido a perigos para a saúde humana, é requerido o controlo sistemático da sua presença, de forma a atestar a qualidade do produto e agir em conformidade com as leis vigentes. Contudo, a análise instrumental destes compostos representa um grande desafio do ponto de vista analítico, para a sua identificação e quantificação, devido à baixa concentração em que geralmente se encontram e à complexidade da matriz dos produtos.
A etapa de preparação de amostra tem vindo a ganhar importância no contexto de análise química e, atualmente, existe uma procura constante por metodologias de extração cada vez mais simples, eficientes, rápidas, com um baixo custo e que não sejam prejudiciais ao utilizador e ao ambiente, fazendo uso de um consumo reduzido de solventes de baixa toxicidade. Desta forma, o trabalho descrito nesta dissertação centrou-se no desenvolvimento de metodologias analíticas para a determinação de compostos voláteis em amostras líquidas e sólidas, como potenciais alternativas a técnicas existentes, enquadradas nos principais paradigmas da Química Sustentável.
Este trabalho foi dividido em duas partes correspondentes ao desenvolvimento de metodologias de preparação de amostra para líquidos e para sólidos. Neste contexto foram utilizadas duas técnicas de extração principais para o desenvolvimento de metodologias analíticas para a determinação de sulfitos, dicetonas e aminas biogénicas em bebidas alcoólicas (vinhos e cervejas) e para a determinação de aldeídos, cetonas e dicetonas em produtos alimentares (pão) e industriais (aglomerados de cortiça).
Na preparação de amostra para líquidos, uma das técnicas que foi utilizada foi a microextração por difusão gasosa (GDME). Esta técnica baseia-se na extração de compostos voláteis e semi-voláteis de uma amostra, por difusão gasosa através de uma membrana porosa, para uma solução aceitadora líquida que é inserida dentro do módulo extrator. Uma vez que se coloca uma solução líquida dentro do módulo, é possível utilizar um agente derivatizante, o que permite aumentar a seletividade do processo. Na sua génese, esta técnica tinha como finalidade a preparação de amostras para análises por cromatografia líquida; contudo, e sendo que a solução aceitadora que contém os analitos extraídos é líquida, esta técnica pode também ser utilizada com outros métodos analíticos, como a espectrofotometria ou métodos eletroquímicos. Desta forma foi desenvolvida uma metodologia para a extração de sulfitos de bebidas alcoólicas com consequente deteção por voltametria de onda quadrada, recorrendo a elétrodos impressos de carbono. As metodologias desenvolvidas permitem simplificar o processo de extração e análise destes compostos, dando simultaneamente resposta a algumas das principais falhas dos métodos de referência aceites para a determinação de sulfitos nestas amostras. Após a realização destes estudos, foi desenvolvida uma outra metodologia para a determinação de dicetonas vicinais em vinhos e cervejas, que podem ser responsáveis pela adulteração do aroma dos produtos (sobretudo o diacetilo), recorrendo a um elétrodo sólido de amálgama de mercúrio (m-AgSAE) para medição electroquímica. Com este sistema foi possível atingir-se um dos mais baixos limites de deteção e quantificação existentes na literatura, para estes compostos. A segunda técnica de extração utilizada neste trabalho foi a extração líquido-líquido assistida por salting-out (SALLE). O processo de extração consiste na separação de solventes orgânicos miscíveis com a água, como o acetonitrilo, da água por adição de um sal. Uma vez que é possível utilizar reduzidos volumes de solventes orgânicos de elevada polaridade, esta técnica torna-se vantajosa em relação à extração líquido-líquido clássica. Para além disso, e como estudado neste trabalho, é possível realizar de forma simultânea o processo de extração e derivatização dos analitos. Outros parâmetros com influência direta na eficiência da extração, tais como a concentração do derivatizante ou o pH, foram estudados antes da quantificação dos analitos nas amostras de vinhos.
Na preparação de amostras para sólidos, considerando o elevado potencial que foi demonstrado pela GDME na extração de compostos voláteis em líquidos, resolveu-se adaptar esta técnica de forma a possibilitar a sua utilização com sólidos. Assim, uma pequena modificação foi introduzida no sistema de forma a que o módulo extrator permanecesse suspenso por cima da amostra sólida, sem a existência de qualquer
contacto entre ambos. De forma a avaliar a aplicação desta técnica a sólidos, a GDME foi utilizada na determinação do diacetilo, pentano-2,3-diona e hexano-2,3-diona em diferentes tipos de pães. Os principais parâmetros experimentais com influência na extração foram estudados, entre os quais a temperatura e tempo da extração, composição da solução aceitadora ou a influência da massa de amostra. Após a realização deste estudo de caracterização, a GDME foi aplicada na determinação de aldeídos e cetonas em aglomerados de cortiça. Estes produtos têm vindo a ganhar notoriedade na sociedade, estando presentes em bastantes habitações. Contudo, têm a capacidade de libertar compostos voláteis para o ar interior que podem ser prejudiciais para a saúde humana, como é o caso do formaldeído. Assim, é importante a existência de controlo sobre as emissões e o conteúdo dos analitos voláteis presentes neste tipo de produtos. Assim, num primeiro trabalho, utilizou-se a GDME para determinar o conteúdo de alguns aldeídos presentes em placas de aglomerados de cortiça com um fabrico e tratamento final diferentes. Para além disso, e recorrendo a ensaios de espectrometria de massa, foi possível identificar um conjunto de 13 aldeídos e 4 cetonas nas respetivas amostras. Após este estudo, desenvolveu-se uma metodologia específica para a determinação de formaldeído em produtos sólidos (neste caso aplicado a aglomerados de cortiça), recorrendo a uma reação de derivatização com a acetilacetona. Esta reação dá origem a um derivado com coloração amarela, podendo ser determinado num espectrofotómetro. Diferentes parâmetros experimentais foram estudados (temperatura de extração, massa de amostra, volume de solução aceitadora, tempo de extração e concentração de derivatizante) por meio de um desenho experimental. A metodologia desenvolvida apresenta-se como uma alternativa mais segura, simples e rápida, em comparação com os métodos de referência atuais.
Palavras chave
Compostos voláteis, extração, extração líquido-líquido assistida por salting-out (SALLE), microextração por difusão gasosa (GDME), preparação de amostra, sólidos
Abstract
In the day-to-day life, we perform actions that result in the emission of volatile compounds to the surrounding environment. From an environmental perspective, the emission of volatile compounds together with the reactions happening in the atmosphere, have been the source of an increasing global warming effect and air quality deterioration. Moreover, the emission of volatiles from industrial products can produce harmful effects on human health. In foods, the perception of a product aroma is associated with the presence of one or more volatile compounds. Their presence may be related to external chemical contaminations during packaging or storage, or as a result of an internal deterioration in the food – through different processes, like lipid oxidation, Maillard reactions or due to the action of microorganisms. For the producer, due to the adverse effects that the presence or emission of volatiles can have on the sensorial evaluation of their products or hazardous effects to the human health, it is required to systematically control their presence, in order to attest the product quality and to comply with existing laws. However, the instrumental analysis of such products represents a big challenge from an analytical standpoint, for an efficient identification and quantification, due to the small concentrations they usually exhibit and due to the complex matrix of these products.
The importance of the sample preparation step in chemical analysis has been increasing and, nowadays, there is a continuous search for increasingly simpler, more efficient, faster and less expensive extraction methodologies, which are not harmful to the user and the environment, by using reduced amounts of low toxicity solvents. Therefore, the work described in this thesis involves the development of analytical methodologies for the determination of volatile compounds in liquid and solid samples, as potential alternatives to current techniques, while respecting the main guidelines proposed by the Green Chemistry.
This work was split into two sections, corresponding to the development of sample preparation techniques for liquids and for solids. Two extraction techniques were used for the development of analytical methodologies for the determination of sulphites, dicarbonyl compounds and biogenic amines in alcoholic beverages (wines and beers) and for the determination of aldehydes, ketones and dicarbonyl compounds in food (bread) and industrial (cork agglomerates) products.
For the sample preparation of liquids, one of the techniques used was the gas-diffusion microextraction (GDME), which is based on the extraction of volatile and
semi-volatile compounds, by gas-diffusion through a porous membrane, to a liquid acceptor solution placed inside the extractor device. Since a liquid solution is placed inside the extractor device, it allows the usage of a derivatization reagent, which helps to increase the selectivity of the process. Although in the beginning GDME was developed as a sample preparation technique for liquid chromatography, the fact that the acceptor solution containing the extracted analytes is a liquid enables the GDME usage with other analytical methods, such as spectrophotometry or electrochemistry. Therefore, a methodology for the extraction of sulphites from alcoholic beverages, employing screen-printed carbon electrodes and square-wave voltammetric analysis, was developed. Besides trying to simplify the overall extraction process and analysis of the analytes, the developed method intends to provide an answer to some of the most known flaws of the reference methods accepted for the determination of sulphites in alcoholic beverages. After this study, another methodology was developed for the determination of dicarbonyl compounds in wines and beers, which are responsible for the adulteration of the aroma of the products (mostly diacetyl), by using a silver solid amalgam electrode (m-AgSAE) together with voltammetric measurements. With this system, it was possible to attain one of the lowest detection and quantification limits available in the literature for these compounds. The second technique of extraction used was the salting-out assisted liquid-liquid extraction (SALLE). The process consists on the separation of water-miscible organic solvents, like acetonitrile, and water by the addition of a salt. Since it is possible to use small volumes of high polarity organic solvents, this technique stands advantageous over the traditional liquid-liquid extraction. Moreover, and as studied in this work, it is possible to perform the extraction and derivatization of the analytes simultaneously. Other extraction parameters, with direct influence on the extraction efficiency, such as the derivatization reagent concentration and the pH, were evaluated before the quantification of the analytes in the wine samples.
For the sample preparation of solids, and considering the potential shown by GDME for the extraction of volatile compounds from liquids, it was decided to use it with solids as well. Therefore, a small modification was introduced in the extraction system in order for the extractor device to be suspended above the solid sample, without any contact between them. In order to evaluate this new application, GDME was used in the determination of diacetyl, pentane-2,3-dione and hexane-2,3-dione in different types of bread. The most influential extraction parameters, such as the temperature and time of extraction, composition of the acceptor solution or the influence of the sample mass, were studied. After this characterization study, GDME was applied to the determination of aldehydes and ketones in cork agglomerates. These products recognition in the
society have been increasing, and they are already used in many houses. However, they can release volatile compounds into the indoor air, which might be harmful to the human health, as is the case with formaldehyde. Therefore, it is important to develop methods capable of measuring the emission and content of the volatile analytes of these products. In a first work, GDME was used for the determination of the carbonyl compounds content in cork agglomerate boards that had a different production and final treatment. Moreover, using mass spectrometry, it was possible to identify a total of 13 aldehydes and 4 ketones on the respective samples. After this work, a selective methodology for the determination of formaldehyde in solid products (herein applied to cork agglomerates) was developed, by performing a derivatization reaction with acetylacetone. This reaction produces a derivative with a yellow colour, which can be measured in a spectrophotometer. Different experimental parameters were studied (temperature of extraction, sample mass, volume of acceptor solution, extraction time and derivatization reagent concentration) by means of an asymmetrical screening design. The proposed work stands as a safer, simpler and faster alternative to current reference methods.
Keywords
Extraction, gas-diffusion microextraction (GDME), salting-out assisted liquid-liquid extraction (SALLE), sample preparation, solids, volatile compounds
Organization of the thesis
This thesis is divided into ten chapters comprehended inside three different sections: (I) Introduction, (II) Research work and (III) Final remarks and future work. In order to simplify the overall reading of this manuscript and to best present the works contained, the research work was divided into two different sub-sections: “A - Sample preparation for liquid samples” which consists of chapter 4, chapter 5, chapter 6 and chapter 7, and “B - Sample preparation for solid samples”, consisting of chapter 8, chapter 9 and chapter 10. A succinct description of each chapter will be performed below.
In chapter 1, a brief discussion about the impact of volatile and semi-volatile compounds on the sensory perception and safety of products is performed. Additional considerations are made about the main sources for the formation of these compounds, together with the negative effects associated with their presence in the environment or in food products.
In chapter 2, it is addressed the importance of the sample preparation step in the analytical process of analysis, together with the most used methodologies for the extraction of volatile compounds from liquid and solid samples. Different techniques are discussed, grouped according with their main characteristics in: (1) liquid phase extraction; (2) solid phase extraction; (3) headspace extraction and (4) membrane assisted extraction techniques.
In chapter 3 are described and discussed the most important concepts of the sample preparation techniques adopted in this work, gas-diffusion microextraction (GDME) and salting-out assisted liquid-liquid extraction (SALLE). Likewise, some information is given about the analysed chemical compounds, focusing on their importance and influence in different products, together with the most common analytical techniques used for their determination.
In chapter 4, it is described the development of a GDME methodology for the determination of free sulphites in wines. GDME was used for the extraction of sulphites from the samples followed by an electrochemical determination with screen-printed carbon electrodes (SPCEs) by square-wave voltammetry. In a first phase, the extraction procedure and the electrochemical parameters were studied. In a second phase, the methodology was used for the determination of the free sulphite content in different wine samples.
In chapter 5, it is described the application of the previously developed GDME-SPCE methodology to the determination of the total sulphite content in beer. Furthermore, it is presented and discussed the conditions used in one of the most used reference methods available in the literature, the p-rosaniline method.
In chapter 6, it is presented the development of a methodology for the determination of trace amounts of diacetyl in alcoholic beverages, by using the GDME for the analyte extraction and concentration, followed by the differential pulse voltammetry (DPV) electrochemical determination with a mercury meniscus modified silver solid amalgam electrode. In a first phase, the electrochemical conditions for the DPV measurements were studied; in addition, the GDME extraction conditions were also studied, with particular emphasis to the time, temperature of the extraction and pH of the extracting solution. This strategy was used for the determination of diacetyl in several alcoholic beverages.
In chapter 7, the development and application of a SALLE methodology for the determination of biogenic amines in wine is discussed. Special emphasis is given to the development of the extraction protocol and optimization of extraction conditions, such as the derivatization time, derivatization reagent concentration and influence of pH. Finally, the determined concentration of nine biogenic amines in five different wine samples, is presented.
In chapter 8, it is presented, for the first time, the application of the GDME technique to solid samples. The modifications performed to the initial configuration of the device, together with the evaluation of the most important experimental parameters, are discussed. Finally, the application of the methodology to the determination of α-dicarbonyl compounds in bread is presented.
In chapter 9, the determination of carbonyl compounds extracted from cork agglomerates is presented. As different cork agglomerated samples were used, with different characteristics (such as coatings, varnish treatments or the resin used in the agglomeration process), a correlation between the obtained results and the industrial production of the samples could be made. Additionally, mass spectrometry studies permitted the identification and characterization of some carbonyl compounds resulted from the industrial production of cork agglomerates.
In chapter 10, the development of a selective methodology for the determination of formaldehyde released from cork agglomerates is presented. It is discussed the optimization of the most influencing extraction parameters, through an experimental design test, and the determined formaldehyde content was compared with a European reference method.
The last chapter, chapter 11, features the concluding remarks for this thesis and proposals of future work.
Table of contents
Acknowledgments ... 3
Resumo ... 7
Abstract ... 11
Organization of the thesis ... 15
Table of contents ... 19
List of tables ... 25
List of figures ... 27
Abbreviations list ... 33
I. Introduction ... 37
1. Volatile and semi-volatile compounds ... 39
1.1. Volatile organic compounds ... 40
1.2. Sources and formation ... 41
1.3. Negative effects associated with volatiles... 42
2. Methodologies for the extraction of volatiles ... 47
2.1. Liquid phase extraction techniques ... 49
2.1.1. Traditional techniques ... 49
2.1.1.1. Soxhlet extraction ... 49
2.1.1.2. Liquid-liquid extraction ... 51
2.1.2. Modern techniques ... 51
2.1.2.1. Liquid-phase microextraction ... 52
2.1.2.2. Supercritical fluid extraction ... 57
2.1.2.3. Accelerated solvent extraction ... 58
2.1.2.4. Microwave assisted extraction ... 59
2.1.2.5. Ultrasound assisted extraction ... 61
2.2. Solid phase extraction techniques ... 62
2.2.2. Solid phase microextraction ... 64
2.2.3. Stir bar sorptive extraction ... 67
2.3. Headspace extraction techniques ... 68
2.4. Membrane assisted extraction techniques... 69
2.4.1. Membrane assisted solvent extraction ... 70
2.4.2. Gas-diffusion ... 71
2.4.3. Pervaporation ... 72
3. Extraction techniques and chemical compounds studied in this work... 75
3.1. Extraction techniques ... 75
3.1.1. Gas-diffusion microextraction ... 75
3.1.1.1. Fundamental theoretical concepts ... 77
3.1.2. Salting-out assisted liquid-liquid extraction ... 79
3.2. Chemical compounds ... 81
3.2.1. Biogenic amines ... 81
3.2.2. -dicarbonyl compounds ... 84
3.2.3. Aldehydes ... 85
3.2.4. Sulphites ... 87
II. Research work ... 89
4. Free sulphite determination in wine using screen-printed carbon electrodes... 91
4.1. Introduction ... 91
4.2. Materials and methods ... 92
4.2.1. Reagents and samples ... 92
4.2.2. Screen-printed electrodes ... 92
4.2.3. Electrochemical measurements ... 93
4.2.4. Extraction procedure ... 94
4.2.5. Simplified Ripper methodology ... 95
4.3. Results and discussion... 95
4.3.1. Sulphite extraction by GDME ... 95
4.3.3. Optimization of voltammetric determination ... 97
4.3.4. Analytical parameters ... 98
4.3.5. Method comparison with the simplified Ripper methodology ... 99
4.4. Conclusions ... 101
5. Electrochemical sensing of total sulphites in beer using non-modified SPCEs ... 103
5.1. Introduction ... 103
5.1.1. Total sulphites determination ... 103
5.1.2. Overview of the p-rosaniline method ... 104
5.2. Materials and methods ... 105
5.2.1. Reagents and samples ... 105
5.2.2. Electrochemical measurements ... 106
5.2.3. Extraction procedure ... 106
5.2.4. Procedure for the p-rosaniline method ... 107
5.2.4.1. Calibration curve ... 107
5.2.4.2. Analysis of beer samples ... 108
5.2.4.3. Blank solution ... 108
5.3. Results and discussion... 108
5.3.1. Analytical parameters ... 108
5.3.2. Comparison of GDME-SPCE with the p-rosaniline method ... 110
5.4. Conclusions ... 111
6. Voltammetric determination of trace amounts of diacetyl at a mercury meniscus modified silver solid amalgam electrode... 113
6.1. Introduction ... 113
6.2. Materials and methods ... 114
6.2.1. Reagents and samples ... 114
6.2.2. Electrochemical measurements ... 114
6.2.3. Extraction procedure ... 115
6.3. Results and discussion... 116
6.3.2. Optimization of the GDME extraction conditions ... 118 6.3.3. Analytical parameters ... 121 6.3.4. DPV determination of DC at the m-AgSAE in alcoholic beverages ... 123 6.4. Conclusions ... 124 7. Determination of biogenic amines in wines by SALLE ... 127 7.1. Introduction ... 127 7.2. Materials and methods ... 127 7.2.1. Reagents and samples ... 127 7.2.2. Chromatographic analysis ... 128 7.2.3. Extraction procedure ... 129 7.3. Results and discussion... 129
7.3.1. Optimization of the extraction protocol ... 130 7.3.2. Effect of derivatization reagent concentration ... 132 7.3.3. Influence of pH ... 133 7.3.4. Analytical parameters ... 134 7.3.5. Application to samples ... 135 7.4. Conclusions ... 136 8. Application of GDME to solid samples using the chromatographic determination of α-dicarbonyls in bread as a case study ... 139
8.1. Introduction ... 139 8.2. Materials and methods ... 140 8.2.1. Reagents and samples ... 140 8.2.2. Chromatographic analysis ... 140 8.2.3. Extraction procedure ... 141 8.3. Results and discussion... 142
8.3.1. Optimization of extraction parameters... 143 8.3.1.1. Acceptor solution ... 143 8.3.1.2. Temperature of extraction ... 144 8.3.1.3. Time of extraction ... 145
8.3.1.4. Sample mass ... 145 8.3.2. Analytical parameters ... 146 8.3.3. Application to samples ... 147 8.4. Conclusions ... 149 9. Determination of carbonyl compounds in cork agglomerates by GDME-HPLC/UV: Identification of the extracted compounds by HPLC-MS/MS ... 151
9.1. Introduction ... 151 9.2. Materials and methods ... 152 9.2.1. Reagents and samples ... 152 9.2.2. Chromatographic analysis ... 153 9.2.3. HPLC-DAD-MS/MS analysis ... 153 9.2.4. Extraction procedure ... 153 9.2.5. Studied samples ... 154 9.3. Results and discussion... 154
9.3.1. Extraction optimization ... 154 9.3.2. Analytical parameters ... 156 9.3.3. Application to samples ... 157 9.3.4. Identification of DNPH derivatives by HPLC-DAD-MS/MS ... 158 9.4. Conclusions ... 160 10. GDME coupled to spectrophotometry for the determination of formaldehyde in cork agglomerates ... 163 10.1. Introduction ... 163 10.2. Materials and methods ... 164 10.2.1. Reagents and samples ... 164 10.2.2. Spectrophotometric analysis ... 165 10.2.3. Extraction procedure ... 165 10.2.4. Procedure for the determination of formaldehyde by the standard method EN 717-3 ... 166 10.3. Results and discussion... 167
10.3.1. Derivatization reaction with acetylacetone ... 167 10.3.2. Optimization of the extraction parameters ... 168 10.3.3. Analytical parameters ... 171 10.3.4. Application to samples ... 172 10.4. Conclusions ... 174
III. Final remarks and future work ... 175
List of tables
I - IntroductionTable 2.1 - Main advantages and disadvantages of Soxhlet extraction technique for sample preparation. ... 50 Table 2.2 - SPME applications list for the determination of volatiles in liquid and solid samples. ... 66
II - Research work
Table 4.1 - Sample designation, ABV and pH of the analysed wine samples. ... 92 Table 4.2 - Method comparison between the proposed methodology (GDME-SPCE) and the simplified Ripper method. ... 100 Table 5.1 - Methods comparison between the proposed methodology (GDME-SPCE) and the EBC method (p-rosaniline). ... 110 Table 6.1 - Comparison of LODs and LOQs for the determination of DC using different methodologies. ... 123 Table 6.2 - List of analysed samples, respective characteristics (sample type and ABV content) and determined DC concentration using the developed methodology. ... 124 Table 7.1 - Sample designation, ABV and pH of the analysed wine samples for the determination of BA. ... 128 Table 7.2 - Figures of merit of the proposed SALLE methodology. ... 135 Table 7.3 - Determined concentration of BA extracted with SALLE from the wine samples described in Table 7.1. ... 136 Table 8.1 - Analytical parameters of the proposed methodology for DC, PN and HX. 147 Table 8.2 - Determined concentrations of DC, PN and HX in five different bread samples. ... 148 Table 9.1 - Main characteristics of the six cork agglomerated samples used in this study, in terms of board thickness, PVC coating, varnish treatment and type of resin used in the agglomeration process. ... 154 Table 9.2 - Analytical parameters of the proposed methodology for the determination of aldehydes in cork samples. ... 156 Table 9.3 - Concentrations of formaldehyde, butanal, benzaldehyde, pentanal and hexanal determined using the proposed GDME methodology on the six different samples. ... 157
Table 9.4 - List of identified compounds in the extracts of cork agglomerated samples. ... 161 Table 10.1 - Coded and (uncoded) levels of asymmetrical screening design (3342) in
GDME of formaldehyde from cork agglomerates. ... 169 Table 10.2 - Determined concentrations of formaldehyde in the seven analysed samples by the proposed GDME methodology. ... 173
List of figures
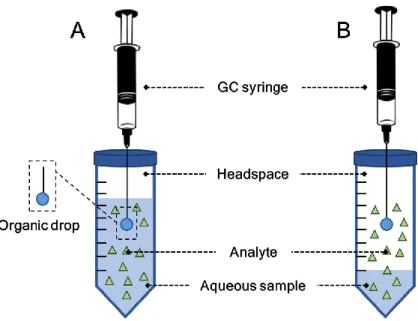
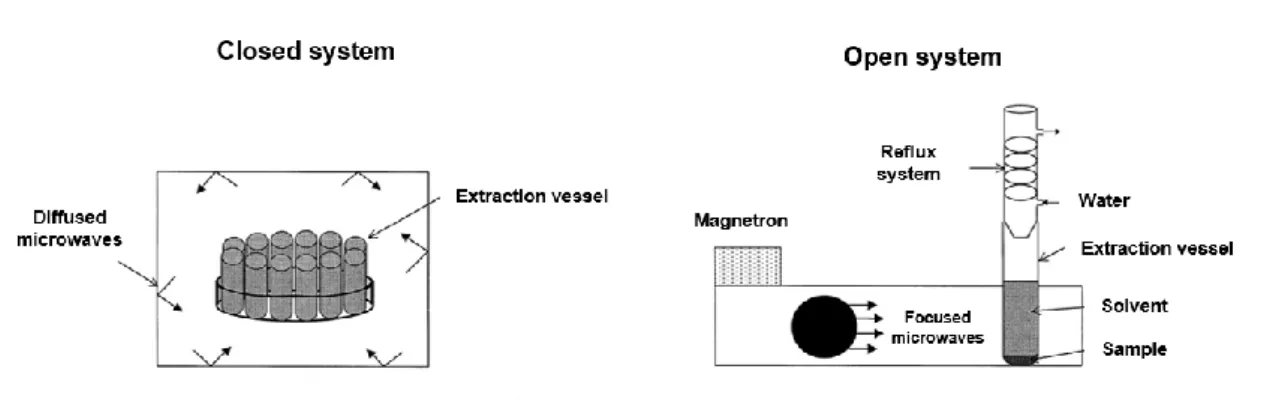
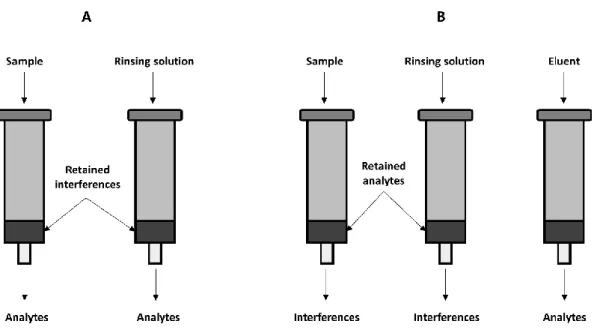
I - IntroductionFigure 1.1 – Schematic representation of some of the volatile compounds emanated from strawberries, which are responsible for the aroma profile of this product. Adapted from [1]. ... 39 Figure 1.2 - Abbreviated scheme for the formation of photochemical smog. Adapted from [21]. ... 44 Figure 2.1 - Simplified diagram of a sample process of analysis. ... 47 Figure 2.2 - Publications in sample preparation from 2000-2015, searched from the Scopus Database by keywords of "subcritical water extraction”, “pressured liquid extraction”, “microwave assisted extraction”, “supercritical fluid extraction”, “accelerated solvent extraction”, “single drop microextraction”, “hollow fiber microextraction”, “dispersive liquid liquid microextraction”, “ionic liquids extraction”, “solid phase extraction”, “solid phase microextraction”, “stir bar sorptive extraction”, “headspace extraction”, “membrane extraction”, “pervaporation” and “gas diffusion” with restricting the search to article titles. ... 48 Figure 2.3 - Representation of a Soxhlet extraction apparatus. ... 50 Figure 2.4 – Schematic representation of an extraction by DLLME. ... 53 Figure 2.5 - Schematic representation of an extraction with SDME in direct immersion (A) and in the headspace (B). ... 55 Figure 2.6 - Schematic representation of HF-LPME in 2-phase (A) and 3-phase (B) extraction systems. Adapted from [79]. ... 56 Figure 2.7 - Schematic representation of close and open vessel MAE systems. ... 60 Figure 2.8 - Schematic representation of the two most commonly used ultrasonic systems. Adapted from [129]. ... 61 Figure 2.9 - Schematic representation of a (A) SPE cleanup process that retains the interferences and (B) SPE cleanup process with analyte retention followed by elution. ... 63 Figure 2.10 - Representation of a SPME extraction device. Adapted from [155]. ... 65 Figure 2.11 - Schematic representation of a SBSE stir bar with a PDMS coating and the apparatus design showing the SBSE process through immersion and HS sampling modes. 1 - sampling flask; 2 - HS; 3 - sample; 4 - SBSE stir bar; 5 - magnetic stir bar. Adapted from [182, 183]. ... 67
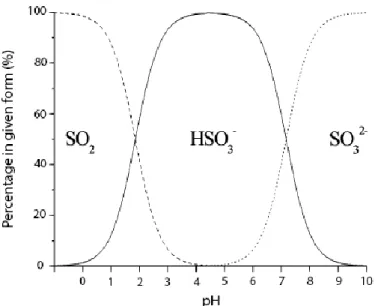
Figure 2.12 - Schematic representation of a typical GD cell used in flow-analysis systems. ... 72 Figure 2.13 - Schematic representation of a conventional PV module for liquid samples, to be coupled to flow systems. Adapted from [225]. ... 73 Figure 3.1 - Schematic representation of the GDME device. ... 75 Figure 3.2 – Schematic representation of the GDME extraction when the acceptor solution contains a derivatizing reacting with the analyte , forming . ... 76 Figure 3.3 - Schematic representation of the SALLE procedure. ... 80 Figure 3.4 - Chemical structures of biogenic amines used throughout this work. ... 82 Figure 3.5 - Scheme that represents the chemical reaction between DNS-Cl and BA. 83 Figure 3.6 - Chemical structures of the most common -dicarbonyl compounds found in foods. ... 84 Figure 3.7 – Scheme that represents the derivatization reaction of -dicarbonyls with OPDA, forming quinoxalines. ... 85 Figure 3.8 – Scheme that represents the derivatization reaction between DNPH and aldehydes to form the corresponding hydrazone. ... 86 Figure 3.9 - Representation of the dependence of the different sulphites forms with pH. Adapted from [295]. ... 87
II - Research work
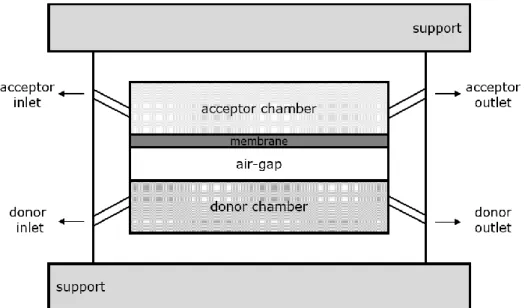
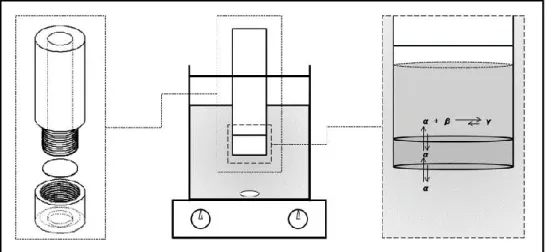
Figure 4.1 - Schematic representation of a traditional screen-printed electrode, containing a working, reference and counter electrode. ... 93 Figure 4.2 - GDME extractor device adapted to a commercial laboratory flask. ... 94 Figure 4.3 - The general schematics of the gas-diffusion microextraction (on the left) and a detail of the chemical reactions involved in the extraction process (on the right). ... 94 Figure 4.4 – (A) Stability of a sulphite standard solution (80 mg L-1) over time and (B)
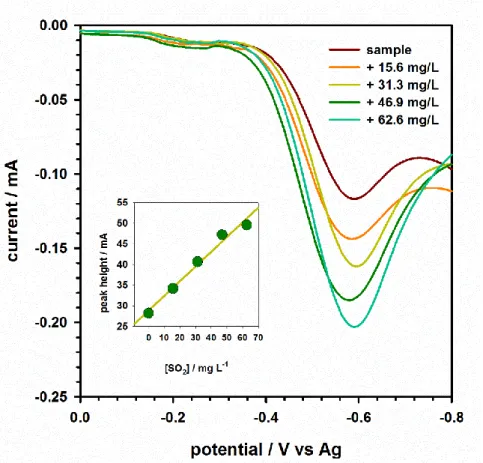
influence of the extraction temperature (25, 35, 45, 55 and 65 °C) on the analyte’s peak height, performed over an extract of a sulphite standard solution (55 mg L-1). ... 97 Figure 4.5 - Frequency (A), potential step (B) and wave amplitude (C) optimization. Voltammograms were obtained on the extraction of a standard sulphite solution (30 mg L-1) for 15 min at 50 °C. ... 98 Figure 4.6 - Voltammograms obtained in the analysis of a wine sample with several standard additions. ... 99 Figure 5.1 - Representation of the chemical structure of p-rosaniline hydrochloride. . 104
Figure 5.2 – Schematic representation of the extraction procedure... 107 Figure 5.3 - Square-wave voltammograms obtained in the analysis of several standard solutions of sulphur dioxide. Inlay: calibration curve plotted with the voltammetric peak height vs. the sulphur dioxide concentration; three replicates were performed for each concentration. Voltammetric measurements were performed with a square-wave frequency of 50 Hz, potential step of 5 mV and wave amplitude of 25 mV, initial potential of 0 mV and final potential of -900 mV. ... 109 Figure 5.4 - Square-wave voltammograms obtained in the analysis of a beer sample and several standard additions. Voltammetric measurements were performed with a square-wave frequency of 50 Hz, potential step of 5 mV and square-wave amplitude of 25 mV, initial potential of 0 mV and final potential of -900 mV. ... 111 Figure 6.1 - Representation of the three-electrode system and the m-AgSAE used in this work. ... 115 Figure 6.2 - Modulation amplitude study. DP voltammograms were obtained on the extraction (20 min, at 60 °C with 1.0 mL of 0.05% OPDA in BR buffer at pH 5.0) of a DC standard solution (1 mg L-1); a step potential of 1 mV and a scan rate of 7 mV s-1 were
employed. For each modulation amplitude tested, experiments were carried out in triplicate. The results are expressed as the mean ± standard deviation. ... 116 Figure 6.3 - Schematic representation of the original and baseline-corrected voltammograms of a DC standard solution (0.1 mg L-1) extract. ... 117 Figure 6.4 - Time (A) and temperature optimization (B) study. DP voltammograms were obtained on the extraction (with 1.0 mL of 0.05% OPDA in BR buffer at pH 5.0) of a DC standard solution (5 mg L-1); 60 °C were used for the optimization of time and 10 min were used for the temperature optimization. For each time and temperature tested,
experiments were carried out in triplicate. The results are expressed as the mean ± standard deviation. ... 119
Figure 6.5 – Optimization study of acceptor solution pH (with 1.0 mL of 0.05% OPDA in BR buffer). Baseline-corrected DP voltammograms were obtained on the extraction (10 min, at 60 °C) of a DC standard solution (10 mg L-1), using the previously optimized DPV conditions. The inset shows the DMQ peak height variation from pH 3 to pH 10. For each pH tested, experiments were carried out in triplicate. The results are expressed as the mean ± standard deviation. ... 120 Figure 6.6 – Optimization study of donor solution pH. DP voltammograms were obtained on the extraction (60 °C for 10 min, with 1.0 mL of 0.05% OPDA in BR buffer pH 5) of a DC standard solution (10 mg L-1); DC standard solutions were prepared in BR buffer at
different pH values. For each pH tested, experiments were carried out in triplicate. The results are expressed as the mean ± standard deviation. ... 121 Figure 6.7 - Graphical representation of DP voltammograms (baseline-corrected) obtained on the extraction (10 min, at 60 °C with 1.0 mL of 0.05% OPDA in BR buffer at pH 5.0) of five different DC standard solutions (from 0.05 to 1 µg L-1). The corresponding
calibration dependence is in the inset. For each DC concentration tested, experiments were carried out in triplicate. The results are expressed as the mean ± standard deviation. ... 122 Figure 7.1 – Schematic representation of the experimental procedure proposed for the extraction of BA from wine using SALLE. ... 129 Figure 7.2 – Schematic representative scheme of the three tested extraction / derivatization procedures. ... 130 Figure 7.3 - Influence of the derivatization time (0, 20, 40, 60 and 80 min) on peak areas for the extraction of BA using three different extraction procedures: (A) derivatization followed by extraction; (B) simultaneous derivatization and extraction and (C) extraction of the amines followed by derivatization. BA peak areas were obtained from the extraction of standard solutions (0.5 mg L-1). ... 131
Figure 7.4 - DNS-Cl concentration optimization study. BA peak areas were obtained from the extraction of standard solutions (0.5 mg L-1) with increasing DNS-Cl concentration. Derivatization time: 25 min. ... 133 Figure 7.5 – Study of the effect of pH on the extraction. BA peak areas were obtained from the extraction of (A) standard solutions (0.5 mg L-1) and (B) from a spiked sample, with different pH values. Standards and samples were prepared and diluted (1:1, v/v), respectively, with a buffer solution (0.2 mol L-1) prior to the extraction. Procedure A was
used for the extraction protocol. ... 134 Figure 8.1 - Image representation of the GDME extraction system used in the determination of α-dicarbonyls in bread. ... 141 Figure 8.2 – Schematic representation of the extraction system. ... 141 Figure 8.3 – Representation of the chromatogram obtained from the chromatographic separation of a spiked bread sample with each of the α-dicarbonyl compounds. Extractions were performed at 65 C for 15 min and the chromatographic conditions were the ones described in II.8.2.2. ... 142 Figure 8.4 - Chromatographic peak area variation with the volume of acceptor solution. Five different volumes were tested from 300 to 700 µL, extractions were performed on
5.0 g of a bread sample with an aliquot of 100 µL of a standard solution with 15 mg L-1
of DC, PN and HX. ... 143 Figure 8.5 - DC, PN and HX peak area variation with the extraction temperature. Five different values of temperature were tested: 25, 35, 45, 55 and 65 °C. Extractions (for 15 min with 500 µL of OPDA) were performed on 5.0 g of a bread sample spiked with an aliquot of 100 µL of a solution with 10 mg L-1 of DC, PN and HX. ... 144
Figure 8.6 – Representation of the chromatograms of several extractions with different extraction times: tested times ranged from 5 minutes up to 1 hour; extractions (at 65 °C with 500 µL of OPDA) were performed on a 5.0 g bread sample spiked with an aliquot of 100 µL of a solution with 15 mg L-1 of DC, PN and HX. The inset shows the analytes
peak area variation with extraction time. ... 145 Figure 8.7 - Determination of DC, PN and HX in a sample of bread using different quantities of sample. ... 146 Figure 8.8 - DC, PN and HX peak area evolution in bread with time. Bread A was a wheat bread with seeds and bread B was a white bread. ... 149 Figure 9.1 - Examples of cork and cork agglomerates applications. ... 151 Figure 9.2 – (I) Schematic representation of the five regions marked on the agglomerated panel and (II) the formaldehyde peak area obtained after extractions (n=3) using samples from each of those regions. Extractions were performed using the optimized extraction conditions and the chromatographic separation was obtained with the conditions described in II.9.2.2. ... 155 Figure 9.3 - Representation of the chromatogram obtained for a cork agglomerated sample extract. Extractions were performed at 50 °C for 15 min and the chromatographic conditions were the ones described in II.9.2.2... 157 Figure 10.1 - Schematic representation of the extraction system used for the determination of formaldehyde in cork agglomerates. ... 165 Figure 10.2 - Schematic representation of the apparatus used for the flask method. 166 Figure 10.3 - Representation of the kinetic test performed to evaluate the stability of the formaldehyde-acetylacetone derivative. The test was performed for 3h. The extract used was obtained following the extraction procedure described in II.10.2.3. ... 167 Figure 10.4 - Delta weight (a) and total effect plots (b) obtained using a 3342//16 asymmetrical design for formaldehyde. Bar units are absorbances obtained by spectrophotometric analysis. ... 170
Figure 10.5 - Moisture content determined for the seven analysed samples, according to EN 322... 172 Figure 10.6 - Content of formaldehyde determined by the proposed methodology (GDME) and the reference method (EN 717-3) for seven different cork agglomerate samples. Five replicates were performed for each sample. ... 174
Abbreviations list
ABV Alcohol by volume
ASE Accelerated solvent extraction
BA Biogenic amines
CAD Cadaverine
CE Capillary electrophoresis
DAD Diode array detector
DC Diacetyl
DLLME Dispersive liquid-liquid microextraction
DMA Dimethylamine
DMQ 2,3-dimethylquinoxaline
DNPH 2,4-dinitrophenylhydrazine
DNS-Cl Dansyl chloride
DPV Differential pulse voltammetry
EBC European Brewery Convention
ETA Ethylamine
EU European Union
FIA Flow-injection analysis
GC Gas chromatography
GD Gas-diffusion
GDME Gas-diffusion microextraction
HF Hollow fiber
HF-LPME Hollow fiber liquid-phase microextraction
HIS Histamine
HPLC High performance liquid chromatography
HX Hexane-2,3-dione
IARC International Agency for Research on Cancer
ISO Isopentylamine
LC Liquid chromatography
LLE Liquid-liquid extraction
LLME Liquid-liquid microextraction
LOD Limit of detection
LOQ Limit of quantification
LPME Liquid-phase microextraction
MAE Microwave assisted extraction
m-AgSAE Mercury meniscus modified silver solid amalgam electrode
MASE Membrane assisted solvent extraction
MET Methylamine
MS Mass spectrometry
MUF Melamine-urea-formaldehyde
NMHC Non-methane hydrocarbons
OPDA o-phenylenediamine
PAHs Polycyclic aromatic hydrocarbons
PDMS Polydimethylsiloxane PHE 2-phenylethylamine PN Pentane-2,3-dione PTFE Polytetrafluoroethylene PUT Putrescine PV Pervaporation PVC Polyvinyl chloride
RP-HPLC Reversed-phase high performance liquid chromatography
SALLE Salting-out liquid-liquid extraction
SBSE Stir bar sorptive extraction
SDME Single drop microextraction
SFE Supercritical fluid extraction
SLM Supported liquid membrane
SLME Supported liquid membrane extraction
SPCE Screen-printed carbon electrode
SPD Spermidine
SPE Solid phase extraction
SPEs Screen-printed electrodes
SPME Solid phase microextraction
SWV Square-wave voltammetry
UAE Ultrasound assisted extraction
US-EPA United States Environmental Protection Agency
1. Volatile and semi-volatile compounds
The sense of smell and the perception of odors may refer to pleasant or unpleasant olfactory sensations, which have been used throughout the time as a way to distinguish and evaluate different products. In food and beverages, as an example, several volatile compounds can be found, although only a relatively small number can influence the characteristic odor of the product (Figure 1.1).
The volatile and semi-volatile chemical compounds responsible for the impact on the sensory perception or the safety of a product can exist in concentration levels below the micrograms per liter. For a producer, it is required to systematically control their presence in order to attest the product quality and to comply with existing laws.
Figure 1.1 – Schematic representation of some of the volatile compounds emanated from strawberries, which are responsible for the aroma profile of this product. Adapted from [1].
In our daily lives, we are exposed to many products that contain several chemical compounds with the ability to release volatiles. These include household products (e.g. air fresheners or household cleaning products), indoor fixtures (e.g. furnitures), foods and beverages or personal hygiene products (e.g. skin care products or perfumes), which can constitute a major emission source in the indoor environment. Therefore, efficient methodologies to control the emission and content of volatile compounds are of the utmost importance.
In this chapter, a small review on volatile compounds that can influence the sensory perception and safety of products, as well as their type, origin and related problems is performed.
1.1. Volatile organic compounds
While discussing the importance of volatiles in food or environmental areas, one common terminology used to describe them is “volatile organic compound (VOC)”. Different definitions of VOC can be found in the literature, but they can generally be grouped in two classes. The first includes effect-oriented definitions like the one used by the United States Environmental Protection Agency (US-EPA), which defines VOC as “any compound of carbon, excluding carbon monoxide, carbon dioxide, carbonic acid, metallic carbides or carbonates, and ammonium carbonate, which participates in atmospheric photochemical reactions, except those designated by EPA as having negligible photochemical reactivity” [2]. The second definition to VOC makes use of chemical and physical properties, such as temperature and pressure. Thus, for the European Union (EU), VOC is defined as “any organic compound having an initial boiling point less than or equal to 250 ºC measured at a standard pressure of 101.3 kPa” [3]. It encompasses a variety of organic compounds, including esters, alcohols, aldehydes, hydrocarbons, ketones, terpenes, phenols, acids and others. One of the consequences of the heterogeneity of chemical compounds which can be considered VOC is the large number of acronyms that can be found in the literature. These include NMVOC (non-methane volatile organic compound), which is identical to VOC, but with (non-methane excluded; NMHC (non-methane hydrocarbons), a sub-group of NMVOC, focusing on hydrocarbons; BVOC (biogenic volatile organic compound); AVOC (anthropogenic volatile organic compound), among others [4, 5].
To simplify the above mentioned, a general definition of VOC can be considered: an organic chemical compound whose composition makes it possible to be evaporated under normal atmospheric conditions of temperature and pressure. This concept will be adopted throughout this text.
1.2. Sources and formation
VOCs can be categorized in two groups, considering their emission source: natural or anthropogenic [5, 6]. Vegetation, together with soils and the ocean, is considered the dominant source of natural VOCs emission to the atmosphere. They are responsible for the emission of isoprenoids as well as, to a lesser extent, alcohols and carbonyl compounds. These compounds play important roles as a protective mechanism against insect pests, herbivores or against adverse meteorological conditions [7, 8]. The oceanic emission of VOCs is minimal compared with forests and plants, and is mainly focused on reduced sulphur compounds (dimethylsulphide or carbon disulphide) and ammonia[6].
Fossil fuels and its derivatives are the main responsible for the anthropogenic emission of VOCs to the atmosphere, especially in urban areas, where the impact of vehicle exhaust is significant [9, 10]. Regarding the emitted compounds, there is a heavy focus on NMHC like alkanes (ethane, propane), alkenes (ethene, propene, 1-butene), aromatic (benzene, toluene, ethyl benzene), among others [5]. Additionally, the production of consumer goods, internal combustion engine exhausts, incinerator emissions, building materials and different industrial processes, which use organic solvents for the production of paints, adhesives or inks, can contribute to the anthropogenic emission of VOCs [11, 12]. Besides the emission from these processes, carbonyl compounds, as an example, can be produced in the atmosphere as a result of photochemical oxidation of hydrocarbons. Formaldehyde is one such example, as it can be produced in the atmosphere as the reaction product of the methoxyl radical with oxygen (Equation 1.1) [13].
(Equation 1.1)
In the food and beverages area, a set of chemical processes and contaminations may lead to the formation of volatile and semi-volatile compounds. The simplest way to evaluate poor food condition is by its odour. They may result from contaminations by external chemical compounds during packaging or storage (taint), or result from an internal deterioration of the food product itself (off-flavour). Contaminants by an external chemical may arise from:
(i) packaging, from the component itself or from impurities, additives or reaction products formed during manufacturing, that can pass to the food by direct contact or by vapour phase transfer [14];
(ii) inks and varnishes, due to insufficient drying after printing or caused by photoinitiators and reaction by-products, like benzophenone and benzaldehyde [15];
(iii) residual monomers, especially relevant in plastic bottles, which under certain conditions in the manufacturing process may lead to the formation of several compounds, like styrene or acetaldehyde [16];
(iv) cork, which is probably one of the most famous causes of contamination in wine [17].
The internal deterioration of foods, which enables the production of volatile compounds, is achieved through bio-chemical reactions, including:
(i) lipid oxidation, by reaction of oxygen with saturated and unsaturated fatty acids and their reaction with free radicals, with or without light interference. Several volatile compounds can be formed, e.g. aldehydes, ketones, carboxylic acids, alcohols or hydrocarbons [18];
(ii) Maillard reactions, due to the interaction of amino acids, peptides or proteins with reducing sugars. This complex reaction can produce α-dicarbonyl compounds (like butane-2,3-dione or pentane-2,3-dione), furfural and others [18, 19];
(iii) microorganisms activity, especially if the product is not sterilized and stored in the presence of antimicrobial agents or due to fermentation processes [19].
1.3. Negative effects associated with volatiles
The presence and emission of volatile compounds can cause negative effects to the environment, human health or to a product quality perception. Two different approaches can be used to discuss the importance and negative effects caused by VOCs, either from an environmental or from a consumer of daily products standpoints.
From an environmental perspective, the emission of volatile compounds to the atmosphere has been the cause of an increasing global warming effect and air quality deterioration. One of the most significant gases emitted when fossil fuels are burned is carbon dioxide, which traps heat in the earth’s atmosphere. This has been one of the
main things responsible for the continuous increase on earth’s global average surface temperature [20]. Other compounds formed by fossil fuel combustion, like carbon monoxide, sulphur dioxide or nitrogen oxides can combine in the atmosphere to form tropospheric ozone, which is the major constituent of smog [5]. Smog is a term derived from the combination of smoke and fog that is used to describe a photochemically oxidizing atmosphere. Nowadays, smog is recognized as a major pollution problem. Photochemical smog forms in the troposphere and is influenced by some conditions, such as the availability of hydrocarbons, nitrogen oxides and ultraviolet light (Figure 1.2). As stated before, both natural (e.g. terpenes emitted from plants) and anthropogenic (e.g. the internal combustion engines used in cars) sources can provide reactive hydrocarbons and nitrogen oxides to the atmosphere, which are two of the three key elements involved in smog formation. Among the different chemical compounds involved in smog formation, carbonyl compounds are one of the most important, acting as initiators, intermediates and end products. While many carbonyl compounds can exist in a polluted atmosphere, the most abundant are usually formaldehyde and acetaldehyde [21]. The photochemical dissociation of aldehydes can result in the direct formation of reactive and harmful free radicals that can undergo a number of chemical reactions in the atmosphere.
The effects caused by the emission of volatile compounds can have an impact on the outdoor air but also in the indoor air. In fact, considering that people spend about 80-90% of their time indoors, the adverse effects may be more heavily felt in an indoor environment. The increased probability to find higher concentrations of volatiles in an indoor environment results from a combination of inadequate ventilation with high temperature and humidity levels. Common sources of VOCs in indoor environments include the tobacco smoke, cooking and heating systems, cleaning solvents, building materials, furniture and paints [22].
Figure 1.2 - Abbreviated scheme for the formation of photochemical smog. Adapted from [21].
In the food industry the presence of volatiles in a product, either by external contamination or by internal chemical reactions, may change the overall product organoleptic properties (odour and taste) [23]. The chemical compounds responsible for taints or off-flavours in foods are usually present at trace levels, below micrograms per liter. However, they represent a serious quality problem to the product due to their low sensory thresholds (the minimum concentration at which a compound can be detected by the sense of smell). Although they may not pose a direct health risk to consumers, the perception of a low quality product can severely damage the brand/company and raise negative publicity to the food industry. Aldehydes, especially short-chain aldehydes, contribute significantly to the aromatic profile of alcoholic beverages, being responsible for characteristic aromas and flavours [24]. Diacetyl (DC), usually present in foods due to the fermentation processes, has a characteristic and unpleasant butter like
taste, which can affect the organoleptic quality of a product. Such is the case in the brewing industry, where DC must be controlled during the industrial production of beer [25].
In general, the volatile compounds presence in foods do not cause health-related risks to consumers; however, on specific situations, like the exposure to high concentrations of a certain compound, some symptoms may arise. Biogenic amines (BA) are produced in high quantities in foods by microbial decarboxylation of amino acids. Although BA are, for the most part, metabolized to physiologically less active compounds by specific enzymes (diamine oxidases), when high amounts of BA are ingested the human body is unable to completely eliminate them. There have been reports of several diseases connected to BA contamination of foods, such as headaches, hypo- or hypertension, nausea, cardiac arrhythmia, renal intoxication and several neurological disorders [26-28]. Histamine, considered as the most toxic BA, has been linked to nausea, vomiting and heart palpitations [29], diarrhea [30], hypotension [31], asthma and other conditions in patients with histamine intolerance [32]. DC, besides the importance in the quality control and impact on the flavour of products, has been associated with pulmonary diseases [33], Alzheimer’s disease and cancer [34]. Formaldehyde exposure may lead to irritations in the eyes, respiratory tract and skin, coughing, wheezing and nausea [35]. Some studies show that ingestion of high quantities of acetaldehyde may induce adverse neurologic effects [36] besides nausea, headaches, sweating, vomiting and a decrease in blood pressure [37]. Acrylamide is a reactive unsaturated amide that can be found in a wide range of heat-treated foods, including bread, potato products, chocolate or coffee [38]. Usually, acrylamide is found in products containing high percentage of carbohydrates that have been cooked above 120 ºC. Long term exposure to acrylamide has been shown to cause degeneration of nerve terminals in brain areas that are essential for cognitive functions, like learning or memorizing [39].
From the above discussion, it is perceived the importance and negative effects that volatile compounds can have on the environment, human health or in a product quality. Therefore, the development of methodologies to control and analyse samples, and determine these chemical compounds is of the highest importance.
2. Methodologies for the extraction of
volatiles
An analytical study tries to gather information about the properties of a certain object or substance, whether it is a solid, liquid, gas or a biological material. Although the world has witnessed continuous technological breakthroughs, chemical instruments included, it is still not possible to insert an object in an instrument and expect that all physical and chemical properties will be discovered. Here lies the importance of sample preparation, in order to transform a sample to make it amenable for the chemical analysis or to improve its analysis. Sample preparation is only one of the steps performed in a chemical analysis. Generally, it follows the same pattern, as: sample collection – sample preparation – separation and detection – data analysis (Figure 2.1).
Figure 2.1 - Simplified diagram of a sample process of analysis.
Sample preparation is a critical stage of the chemical analysis process, but not always was treated with the same importance as, for example, the detection stage. For a long time, a lot of emphasis was put on developing new, faster and more accurate analytical detection systems. But, with time, it became apparent the important role of sample preparation, as a clean sample assists and improves separation and detection, while a poorly treated sample may invalidate the assay; moreover, normally a clean extract will extend the equipment’s life span and/or make the instrumental measurement cheaper [40]. In a typical analytical method, it is estimated that approximately 60% of the time is spent on sample preparation and about 30% of the error relating to the analytical results is also due to it [41]. Sample treatment is often a limiting step because it can be
labour-intensive, time-consuming, environmentally hazardous, expensive and even sometimes harmful to the analyst. It has great influence in the precision, accuracy, limits of detection and quantification (LODs and LOQs) of analytical methodologies. The increased interest and awareness in the analysis of foods, natural products and environmental contaminants, increased the demand for the development of new approaches for sample preparation. In fact, looking at the past 15 years, a continuous growth in publications regarding sample preparation can be observed (Figure 2.2).
Figure 2.2 - Publications in sample preparation from 2000-2015, searched from the Scopus Database by keywords of "subcritical water extraction”, “pressured liquid extraction”, “microwave assisted extraction”, “supercritical fluid extraction”, “accelerated solvent extraction”, “single drop microextraction”, “hollow fiber microextraction”, “dispersive liquid liquid microextraction”, “ionic liquids extraction”, “solid phase extraction”, “solid phase microextraction”, “stir bar sorptive extraction”, “headspace extraction”, “membrane extraction”, “pervaporation” and “gas diffusion” with restricting the search to article titles.
Sample preparation is often performed in order to remove matrix components that can interfere with the instrumental analysis [42], but it can also promote the enrichment and chemical modification of the analytes [43, 44]. As previously stated, analyte isolation is a key function of sample preparation, providing the extraction of selected analytes from the sample without other matrix compounds that could negatively impact the measurement. It is often used to pre-concentrate the analyte, making it more
concentrated in the processed extract than in the original sample, which is essential for most VOC analysis whose sample concentration is, usually, very low. A derivatization reaction can also be employed in a sample preparation process, as it can promote a chemical modification to analytes, making them “visible” to a specific instrumental technique (e.g., ultraviolet–visible spectroscopy) or enhance the sensitivity and selectivity of a technique [45].
Over the last two decades, there has been a lot of effort put into developing new sample preparation procedures and in the development of methods with lower organic solvents consumption, higher selectivity, faster or more suitable for high-level automation. These methodologies are mainly based on the analytes solubility in organic solvents (liquid phase extraction), adsorption/absorption in polymeric phases (solid phase extraction) or on their volatility (headspace extraction, gas diffusion, pervaporation).
A sample preparation field that has been less explored and has a lot of space to grow is the sample preparation for the analysis of solid samples. Direct analysis of solids has always been a challenge for analytical chemists. Normally, at least a step of pre-treatment or separation is required to obtain the desired selectivity [46]. In the typical situation a liquid extract is obtained from the solid sample; however, this step may not only destroy the analysed sample, but also add an extra step to the process, which can also be problematic [47].
In this chapter a brief overview of the principal methodologies for the extraction of VOCs from liquid and solid samples is presented. Since different techniques are discussed, and for better understanding, they were divided into four groups according with their main characteristics: (1) liquid phase extraction; (2) solid phase extraction; (3) headspace extraction and (4) membrane assisted extraction.
2.1. Liquid phase extraction techniques
2.1.1. Traditional techniques
2.1.1.1. Soxhlet extraction
One of the most used extraction techniques in analytical solid-liquid chemistry is Soxhlet extraction, which was introduced in the mid-nineteenth century. To this date, it remains a reference technique for the extraction of organic compounds from solid
![Figure 1.2 - Abbreviated scheme for the formation of photochemical smog. Adapted from [21]](https://thumb-eu.123doks.com/thumbv2/123dok_br/15723231.1070712/44.892.166.783.118.723/figure-abbreviated-scheme-formation-photochemical-smog-adapted.webp)