UNIVERSIDADE DA BEIRA INTERIOR
Ciências da Saúde
Efeito anti-inflamatório do GDNF: qual a sua
contribuição para a neuroprotecção
dopaminérgica?
Tiago Filipe Dias Santos Roxo
Dissertação para obtenção do Grau de Mestre em
Ciências Biomédicas
(2º ciclo de estudos)
Orientador: Prof.ª Doutora Carla Fonseca
Co-orientador: Prof.ª Doutora Graça Baltazar
iii
"I always wonder why birds choose to stay
in the same place when they can fly
anywhere on the earth. Then I ask myself
the same question."
v
Resumo
As microglias são os macrófagos residentes do Sistema Nervoso Central e actuam como a principal forma de defesa imunitária. Podem assumir um estado denominado activado, tendo a sua capacidade fagocítica aumentada e produzindo espécies reactivas de oxigénio, com o propósito de proteger as células do Sistema Nervoso Central. No entanto, este estado activado tem sido também relacionado com um processo neurodegenerativo. Aumentos dos níveis de interleucinas e citocinas têm sido descritos em doenças neurodegenerativas, nomeadamente na doença de Parkinson, onde a perda de neurónios dopaminérgicos tem sido associada a uma excessiva activação microglial.
Factores solúveis libertados pelos astrócitos mostraram ser capazes de modular a reactividade microglial. Destes factores, o factor derivado de uma linha de células da glia (GDNF) destacou-se pela sua capacidade em proteger os neurónios dopaminérgicos, tanto in vitro como in vivo. Alguns estudos têm também demonstrado uma acção anti-inflamatória do GDNF, mediada pelo receptor GFR1, sugerindo que possa existir uma relação entre estes dois efeitos. No entanto, até ao momento, não foi ainda demonstrada uma relação de causa-efeito entre eles.
Assim, este trabalho tem como objectivo elucidar a importância do controlo da reactividade microglial pelo GDNF na sobrevivência dos neurónios dopaminérgicos. A estratégia principal será impedir a acção do GDNF especificamente na microglia, através do silenciamento do receptor GFR1, e avaliar o efeito deste silenciamento na acção neuroprotectora do GDNF após aplicação de um estímulo inflamatório. A expressão de GFR1 em culturas primárias de microglia do mesencéfalo ventral e numa linha celular de microglia N9 foi confirmada por imunocitoquímica e Western Blot. O silenciamento do receptor GFR1 na linha celular de microglia N9 foi alcançado com sucesso e resultados preliminares sugerem que o silenciamento deste receptor em culturas primárias de microglia é também possível. A exposição de co-culturas de microglia N9 e culturas mistas de neurónios e glia do mesencéfalo ventral a diferentes concentrações de LPS induziu a morte selectiva de neurónios dopaminérgicos. Paralelamente, foi possível observar um aumento da reactividade microglial. Experiências adicionais serão necessárias para atingir o objectivo principal deste trabalho. No entanto, estes resultados servirão de base para, em futuras experiências, elucidar a relevância do efeito anti-inflamatório do GDNF na neuroprotecção dopaminérgica.
Palavras-Chave
vii
Resumo Alargado
A inflamação é uma resposta imunitária caracterizada por uma produção de mediadores pro-inflamatórios, nomeadamente citocinas e quimiocinas. Dentro do sistema nervoso central, é a microglia que actua como principal defesa imunitária, desencadeando, uma resposta que tem como finalidade a protecção dos neurónios nele existentes. No entanto, intensa activação microglial leva a uma produção excessiva de factores que, embora tenham como finalidade o combate a invasões externas (de microrganismos, por exemplo) ou perturbações internas (resultantes de lesão neuronal), podem danificar os neurónios. Assim, o controlo da reactividade microglial é exercido por células presentes no Sistema Nervoso Central para evitar que esta situação seja recorrente. Vários são os factores que podem modular a reactividade microglial, libertados pelos neurónios danificados ou pelos astrócitos, sendo estes últimos o ponto de foco neste trabalho. Sabe-se que factores libertados por astrócitos são capazes de controlar a activação da microglia em situações de inflamação sugerindo que os astrócitos possam ter um papel de mediadores no controlo da resposta da microglia a factores externos. De facto, os astrócitos também podem alterar o seu comportamento e tornarem-se activados, alterando a homeostase do meio e potencialmente danificando neurónios; intensa activação de astrócitos está presente em doenças neurodegenerativas, nomeadamente, na doença de Alzheimer.
As doenças neurodegenerativas afectam principalmente pessoas idosas, o que indicia que a idade poderá ser um factor de risco para o seu desenvolvimento. Dentro deste tipo de doenças encontra-se a doença de Parkinson, caracterizada pela perda progressiva de neurónios dopaminérgicos na substantia nigra pars compacta, resultando nos sintomas motores comummente associados a esta doença: tremor em repouso, rigidez de movimentos e bradicinésia. O que aparenta ser comum entre esta doença e as restantes neurodegenerativas é que a inflamação crónica parece estar presente no sistema nervoso central. No caso de não existir qualquer anomalia, a microglia está num estado de repouso, caracterizada por uma morfologia ramificada e por ter um papel de monitorização do ambiente em redor. No entanto, em doentes que padecem de doenças neurodegenerativas, a microglia aparenta estar num estado activado, libertando interleucinas, espécies reactivas de oxigénio, óxido nítrico (NO) e aumentando a sua actividade fagocítica. O inconveniente desta activação é que o excesso de produção destes factores pela microglia poderá contribuir para a morte neuronal. No caso da doença de Parkinson, esta activação microglial excessiva e a produção de espécies reactivas de oxigénio contribuem para a morte dos neurónios dopaminérgicos. O facto de os neurónios dopaminérgicos se encontrarem na substantia nigra pars compacta, onde a densidade de microglia é elevada, e o facto de possuírem uma baixa capacidade
viii
antioxidante, leva a que estes seja muito afectados por uma resposta descontrolada da microglia em caso de inflamação.
O controlo da reactividade microglial, num processo inflamatório, é possível e, como foi referido anteriormente, os astrócitos executam essa função no cérebro. Dos factores libertados pelos astrócitos, o factor neurotrófico derivado de uma linha de células da glia (GDNF) destaca-se pela sua capacidade de controlar a reactividade microglial, e pela sua função protectora de neurónios dopaminérgicos. A via pela qual o GDNF controla a reactividade microglial parece ser através do seu receptor GFR1, como estudos anteriores p demonstraram.
Neste trabalho, pretende-se elucidar se existe uma relação causa-efeito entre o efeito anti-inflamatório do GDNF e a sua capacidade em proteger os neurónios dopaminérgicos de uma lesão. A estratégia a desenvolver para atingir este objectivo será impedir a acção anti-inflamatória do GDNF directamente na microglia, através do silenciamento do seu receptor GFR1 nestas células e, posteriormente, avaliar o efeito desse silenciamento na capacidade do GDNF proteger os neurónios dopaminérgicos de uma lesão induzida por um agente inflamatório.
Recorrendo a técnicas de imunocitoquímica e Western blot, os nossos resultados mostraram que as culturas celulares usadas neste estudo, uma linha celular de microglia N9 e uma cultura primária de microglia do mesencéfalo ventral, expressam o receptor GFR1. O silenciamento deste receptor foi conseguido por recurso à tecnologia de siRNA, sendo comprovado por Western blot onde se observou uma diminuição nos níveis proteicos deste receptor tanto em culturas de microglia N9 como em culturas primárias de microglia do mesencéfalo ventral, sendo estes últimos ainda resultados preliminares.
Para induzir uma resposta inflamatória na microglia, optámos pelo uso de LPS, um lipopolissacarídeo obtido a partir da membrana externa de bactérias Gram-negativas. Inicialmente decidimos estimular a microglia N9 com LPS, com diferentes tempos de exposição a este agente, seguido de um ensaio para determinação dos níveis de nitrito libertados pela microglia (e relacionáveis com os níveis de óxido nítrico (NO) produzidos por estas células), onde se iria verificar quanto tempo seria necessário para se obterem aumentos significativos na produção de NO (a produção de NO é indicadora de activação microglial, razão pela qual avaliámos este parâmetro). Concluiu-se que 24h de estimulação seriam suficientes para que o LPS 0.1 g/mL induzisse um aumento significativo na produção de NO por estas células.
ix
De seguida, procedemos ao estabelecimento de co-culturas de microglia N9 com culturas mistas de neurónios e glia do mesencéfalo ventral. Estas co-culturas foram obtidas por tripsinização da microglia N9 e posterior cultura sobre neurónios e glia do mesencéfalo ventral. As co-culturas foram expostas a diferentes concentrações de LPS, durante 24 horas, tendo-se observado uma diminuição do número de neurónios dopaminérgicos, sem afectar a viabilidade dos restantes neurónios na cultura.Para confirmar se, paralelamente à lesão dopaminérgica induzida pelo LPS, teria ocorrido um aumento da reactividade microglial, analisámos parâmetros bem estabelecidos de activação microglial, a produção de NO pela microglia e a sua actividade fagocítica. Essa análise mostrou um aumento na produção de NO e no número de células fagocíticas para a concentração de 1g/mL de LPS. As restantes concentrações testadas não induziram alterações significativas na reactividade microglial.
Experiências adicionais serão ainda necessárias para atingir o objectivo principal deste trabalho, nomeadamente determinar a concentração de GDNF capaz de prevenir a activação microglial induzida por LPS e proteger os neurónios dopaminérgicos na co-cultura, e posteriormente bloquear a acção do GDNF selectivamente na microglia, por silenciamento do seu receptor GFR1, e verificar o seu efeito na viabilidade dopaminérgica após exposição ao LPS. No entanto, os resultados obtidos neste trabalho são importantes como base para, nessas experiências futuras, se clarificar a importância do controlo da reactividade microglial pelo GDNF na sobrevivência dos neurónios dopaminérgicos expostos a um estímulo inflamatório. Este conjunto de experiências permitirá, assim, elucidar se existe uma relação directa de causa-efeito entre a acção anti-inflamatória do GDNF e o seu conhecido papel protector dos neurónios dopaminérgicos.
xi
Abstract
Microglia are the resident macrophages of the Central Nervous System and act as the main form of immune defence. Microglia can assume an activated state in case of inflammation, having its phagocytic activity increased, also releasing reactive oxygen species, in order to protect the Central Nervous System cells from injury. However, activated microglia has also been associated with neurodegeneration. Increased interleukin and cytokine levels have been described in neurodegenerative diseases, namely Parkinson’s disease, where the loss of dopaminergic neurons has been related to excessive microglial activation.
Soluble factors released by astrocytes are capable to modulate microglial reactivity. From these factors, glial cell line-derived neurotrophic factor (GDNF) stood out for its ability to protect dopaminergic neurons from injury, both in vitro an in vivo. Some studies have also demonstrated an anti-inflammatory action of GDNF, mediated by its receptor GFR1, suggesting that these two effects of GDNF may be related to each other. However, no study has provided a clear evidence for a cause-effect relationship between them.
Therefore, this work aims at elucidating the importance of GDNF control of microglial reactivity to the survival of dopaminergic neurons. The main strategy will be to block the action of GDNF specifically in microglial cells, through GFR1 silencing, and to evaluate its effect on the neuroprotective action of GDNF in the presence of an inflammatory stimuli. The expression of GFR1 in primary ventral midbrain microglia and N9 microglia cell line cultures was confirmed through immunochemistry and Western Blot. Silencing of GFR1, through siRNA, in N9 microglia cells was successfully accomplished and preliminary results suggest that silencing of this receptor in primary cultures of microglia is also doable. Co-cultures of N9 microglia cells and neuron-glia mixed cultures were exposed to different concentrations of LPS which induced a selective dopaminergic injury. Under these conditions, an increase in microglial reactivity was observed. Additional experiments will be necessary to achieve the main goal of this work. However, these results will support future experiments in order to elucidate the relevance of the anti-inflammatory effect of GDNF on dopaminergic neuroprotection.
Keywords
xiii
Index
Introduction ... 1
1. Neurodegenerative diseases and neuroinflammation ... 1
2.Microglia ... 2
2.1. Phenotypes ... 3
2.2. Astrocytes as modulators of microglial reactivity ... 4
2.2.1. GDNF as a neuroprotective factor and a modulator of microglial
reactivity ... 5
2.2.1.1 GFR
1 in the modulation of microglial activation modulation by
GDNF ... 7
Aims of the Project
... 9
Materials and Methods ... 11
1.Primary and cell line cultures ... 11
1.1 Ventral midbrain neuron-glia mixed culture ... 11
1.2. Ventral midbrain neuronal culture ... 11
1.3. Ventral midbrain microglia cell cultures ... 12
1.4. N9 microglia cell culture... 12
1.5. Neuron-glia/N9 microglia co-culture ... 12
2. GFR
1 silencing with siRNA transfection ... 13
3. Western Blot ... 14
4. Immunocytochemistry ... 14
5. Phagocytosis assay ... 15
6. Nitric oxide Quantification ... 15
7. Statistical analysis ... 16
Results ... 17
1. GFR
1 expression in N9 and ventral midbrain microglia cells ... 17
2. GFR
1 silencing in N9 and primary microglia culture ... 18
3. Time course for N9 microglial activation in the presence of LPS .... 20
4. Effect of LPS on dopaminergic viability in co-cultures of N9 microglia
cells and neuron-glia mixed cultures ... 21
xiv
5. Analysis of microglia’s activation, after LPS stimulation, with NO and
phagocytosis assay. ... 23
Discussion ... 25
Conclusion and Future Perspectives ... 29
xv
Figure List
Fig. 1 - Microglia’s phenotype ... 3 Fig. 2 – Immunochemistry for GFR1 in N9 cells (green) ... 17 Fig. 3 – Immunochemistry of primary microglial cells to evaluate the presence of GFR1 .... 18 Fig. 4 – Western Blot images of GFR1 band (75kDa) for N9 (A) and primary microglia (B), with its correspondent GAPDH bands (C and D). ... 18 Fig. 5 – GFR1 relative expression in N9 cell cultures treated with different amounts of GFR1 siRNA (3pmol - vol1 and 7pmol - vol2) and control siRNA (Ctr siRNA) ... 18 Fig. 6 – GFR1 relative expression in primary cultures of microglia treated with GFR1 and control siRNA.. ... 20 Fig. 7– Effect of LPS on NO release by N9 microglia cells. N9 cell cultures were exposed, for the indicated periods of time, to LPS 0.1 g/mL ... 21 Fig. 8 - Effect of different concentrations of LPS in the number of TH+ (A) and in the number of MAP2+ cells (B) (normalized to the total number of cells) ... 22 Fig. 9 – Ratio between the number of TH+ and MAP2+ cells, normalized to total number of -cultures of N9 microglia cells with neuron-glia mixed cultures ... 22 Fig. 10 – Effect of different concentrations of LPS on NO release in co-cultures of N9 microglia cells and neuron-glia mixed cultures ... 23 Fig. 11 – Effect of different concentrations of LPS in the number of phagocytic cells (normalized to the total number of cells) in co-cultures of N9 microglia cells with neuron-glia mixed cultures ... 24
xvi
xvii
Acronyms list
6-OHDA ACM BDNF CDNF CNS DA DMEM EDTA EGTA FBS GAPDH GDNF GFL GFR IFN IGF IL iNOS LPS MAP2 MCAO MEM MHC MPTP mRNA NCAM NED NGF NO PBS PD PFA RET ROS RPMI SDS siRNA 6-hydroxydopamineAstrocyte-derived Conditioned Medium Brain Derived Neural growth Factor Cerebral Dopamine Neurotrophic Factor Central nervous system
Dopaminergic
Dulbecco's Modified Eagle's Medium Ethylenediaminetetraacetic acid Ethylene glycol tetraacetic acid Fetal Bovine Serum
Glyceraldehyde 3-phosphate dehydrogenase Glial cell line-Derived Neurotrophic Factor GDNF Family Ligands
GDNF Family Receptor Interferon
Insulin-like Growth Factor Interleukin
inducible Nitric Oxide Synthase
Lipopolysaccharide
Microtubule-Associated Protein 2 Middle Cerebral Artery Occlusion Minimum Essential Medium Major Histocompatibility Complex
1-Methyl-4-Phenyl-1,2,3,6-Tetrahydropyridine messenger Ribonucleic Acid
Neural Cells Adhesion Molecules Naphthylethylenediamine Nerve Growth Factor Nitric Oxide
Phosphate Buffered Saline Parkinson’s Disease Paraformaldehyde
Rearranged during Transfection Reactive Oxygen Species Roswell Park Memorial Institute Sodium Dodecyl Sulphate
xviii
TBS-T TGF TH TNF ZyATris-Buffered Saline with Tween Transforming Growth Factor Tyrosine Hydroxylase
Tumor Necrosis Factor Zymosan A
1
Introduction
1. Neurodegenerative diseases and neuroinflammation
Neurodegenerative diseases are characterized by a reduction in the number of neurons over time, usually associated with a chronic response from brain macrophages. These central nervous system (CNS) resident macrophages, named microglia, act as the main form of active immune defense and are responsible for the production of pro-inflammatory mediators (Block and Hong 2005), such as cytokines and chemokines, leading to a process denominated as inflammation.
Degenerative diseases, such as Parkinson’s Disease (PD), are associated with an increase in inflammatory cytokines, namely tumor necrosis factor (TNF)-and interleukin (IL)
1
, IL-2, IL-6, IL-10 and IL-12
(Mogi, Harada et al. 1994, Nagatsu, Mogi et al. 2000) which could be released from activated microglia (Nagatsu and Sawada 2005), thus suggesting that the development of PD and its associated dementia, may be closely related with the state of microglial activation.
Parkinson’s disease is a neurodegenerative disease that affects around 10 million people worldwide (Parkinson’s Disease Foundation), being men more likely to develop it (Schrag, Ben-Shlomo et al. 2000); this difference between gender appears to be associated with the protective effect of estrogen (Popat, Van Den Eeden et al. 2005). It is a chronic and progressive disease in which there is a loss of dopaminergic (DA) neurons, present in the substantia nigra pars compacta, a specific area of the midbrain. These neurons contain the neurotransmitter dopamine and are involved in the control of voluntary movements; their degeneration leads to the typical PD motor symptoms such as tremor at rest, rigidity, and bradykinesia (Dexter and Jenner 2013). Systemic inflammation, namely TNF- levels, appear to be related with depression, cognitive dysfunction and sleep disturbances in PD patients (Menza, Dobkin et al. 2010), suggesting that inflammation (in particular, TNF-) might be associated with the non-motor symptoms of this disease. The fact that DA neurons are located in the substantia nigra, where microglia density is the highest of all brain (Kim, Mohney et al. 2000), may facilitate their degeneration when an inflammatory process occurs. In addition, the low antioxidant capacity of DA neurons also contributes to an increased degeneration of these type of neurons over others during neuroinflammation.
2
Elder people tend to have higher rate of incidence for neurodegenerative diseases, having PD its onset, on average, at 66 years old in men (Fall, Axelson et al. 1996), which suggests that age may be a risk factor to take into account.
Ageing may cause microglia to change from a neuroprotective to a neurodegenerative role (Farfara, Lifshitz et al. 2008, Streit, Braak et al. 2009, Graeber and Streit 2010). It remains unclear, though, if microglia may be active initiators of neurodegeneration responding to primary insults or targets of the pathological process. Ageing also leads to a decrease in hippocampal neurogenesis; this diminution is correlated with microglial activation and, consequently, with an increase in pro-inflammatory cytokines levels (Kuzumaki, Ikegami et al. 2010). Microglia in elderly may be responsible for the release of detrimental factors to neurogenesis or may have a decrease in the expression of support neurogenesis factors, therefore explaining the diminished stimulation of neurogenesis in elder people (Walton, Sutter et al. 2006).
With ageing, microglia tends to show a deramified morphology, along with an increase in protein expression of major histocompatibility complex (MHC) class II, suggesting that microglia is assuming an alternative phenotype in these cases (VanGuilder, Bixler et al. 2011); microglial phenotypes will be discussed later in the next chapter. This inflammatory profile is accompanied by an increase in the messenger ribonucleic acid (mRNA) expression of pro-inflammatory cytokines such as TNF-, IL-1 and IL-6 (Sierra, Gottfried-Blackmore et al. 2007); not only pro-inflammatory but also anti-inflammatory cytokines, namely IL-10 and transforming growth factor (TGF)-, appear to have an increased expression in mice aged brains. Although it is acknowledged that microglia has a protective role, it is accepted that when activated, may contribute to the neurodegeneration of neurons through the release of a variety of neurotoxic factors (Liu and Hong 2003).
2. Microglia
Microglia are myeloid cells who arise from the embryonic yolk sac and migrate into the brain during the early stages of development. They have the ability to sustain the cell population present in the brain during development through the process of proliferation (Alliot, Godin et al. 1999, Ajami, Bennett et al. 2007).
Microglia can assume multiple phenotypes, usually responding to the surrounding environment, removing cellular debris and promoting regeneration. The transition between these phenotypes may be induced by signals released by neurons or astrocytes (Koizumi, Shigemoto-Mogami et al. 2007), which can maintain microglia in a resting state or, in contrast, may lead microglia to an activated state.
3
2.1 Phenotypes
Microglia can assume three distinguishable phenotypes: resting, activated and alternative activated (Figure 1). The first phenotype is present in a healthy uninjured brain, having a distinct appearance with ramified morphology and a small cell body (Kettenmann, Hanisch et al. 2011). Resting microglia is constantly monitoring neighborhood cells, being fully aware of environmental changes and responding with a change to the activated phenotype in case there are signs of threats to the CNS.
Fig. 1. Microglia’s phenotypes. From left to right, resting phenotype, followed by alternative phenotype and activated phenotype. This last is associated with inflammatory processes, differing from the other phenotypes for its amoeboid form and inflammatory cytokines release. (Adapted from (Dilger and Johnson 2008))
During inflammatory processes microglia is capable of inducing self-proliferation, morphological change, and release countless inflammatory molecules, such as cytokines, chemokines, ROS and nitric oxide (NO), being denominated as a state of activated (Kettenmann, Hanisch et al. 2011). When in an activated state, microglia also develops phagocytic capacity, insuring the phagocytosis of foreign microorganisms, damaged cells and tissue debris in order to protect the CNS. This phenotype is also associated with a decrease in survival of new neurons; many studies have indicated that activated microglia impairs hippocampal neurogenesis, through a decrease in new neuron survival (Bastos, Moriya et al. 2008). Additionally, it may affect neurogenesis, not only through proliferation, survival and cell death, but also through prevention of integration of new neurons into pre-existing neural networks; an increase in inhibitory signaling to new neurons is seen in the presence of inflammation (Jakubs, Bonde et al. 2008).
Aside from the natural activation of microglia, e.g. in response to an infection, they can be forced into an activated state. There are several ways to induce its activation, for study purposes, from which could be named the pro-inflammatory agents Zymosan A (ZyA) or lipopolysaccharide (LPS). LPS is the major component of the outer membrane of Gram-negative bacteria, usually used in research to induce immune responses in animals. LPS has been used as a potent microglia activator and as a neurotoxin both in vitro and in vivo studies
4
and is also able to cause the loss of dopaminergic neurons (Gao, Jiang et al. 2002, Arimoto and Bing 2003, Hunter, Cheng et al. 2009, Xing, Xin et al. 2010). An increase in microglia’s ability to phagocytize or release NO are positive indicators of successful stimulation. Analysis of inflammatory cytokines and ROS production could also indicate microglia’s activation.
The alternative activated phenotype is characterized by the presence of MHC II, and often shows increased expression of anti-inflammatory cytokines, namely IL-10, TGF- and growth factors such as insulin-like growth factor (IGF), nerve growth factor (NGF) and brain derived neurotrophic factor (BDNF). This phenotype has a repair function, downregulates innate immune responses and contributes to neurogenesis’ maintenance, being induced by IL-4 and IL-13 (Butovsky, Ziv et al. 2006, Colton 2009).
The relevance of the different states of microglial phenotype is that its ability to promote inflammation appears to be related with neurodegenerative diseases. As previously mentioned, age appears to be a relevant factor to develop this type of diseases and such could be associated with the fact that, in normal aging, both low-grade chronic inflammation and alternative activated microglia are present in elder’s brains (Dilger and Johnson 2008). Thus, controlling the state of activated phenotype in microglial cells may be a suggestive way to delay some neurodegenerative disease’s progression and could eventually halt some of the common symptoms of elderly.
2.2 Astrocytes as modulators of microglial reactivity
Aside from microglia there are other glial cells in the CNS, namely astrocytes, that play an important role in the organization and maintenance of the brain (Sofroniew and Vinters 2010). These cells are capable to interact with neurons and microglia, being involved in neurotransmitter secretion, signal transmission, ion homeostasis and modulation of oxidative stress (Halassa and Haydon 2010); they are also capable to modulate microglia phenotype through the release of soluble factors. In a similar way of microglia, activation of astrocytes plays a protective role in the brain but intense activation leads to neuronal death, through homeostasis alteration, which causes neuronal depolarization. Intense activation of astrocytes is common in neurodegenerative diseases, such as Alzheimer’s disease (Soto 2003).
The presence of astrocytes appears to be able to control the dual role of microglia, modulating microglia switching from its neurodegenerative to its neuroprotective role. In line with this, stimulation of microglia with LPS or LPS combined with interferon (IFN)-leads to an increase of IL-12 production, an effect that does not occur if microglia is co-cultured with astrocytes or with astrocyte-derived conditioned medium (ACM) (Aloisi, Penna et al. 1997). The presence of astrocytes is also able to inhibit changes in inducible nitric oxide synthase
5
(iNOS) expression and NO release by microglia stimulated with LPS (Vincent, Van Dam et al. 1996); microglia exposed to ACM also has their phagocytic capacity reduced (DeWitt, Perry et al. 1998). Incubation of microglia cultures with ACM also lead to a decrease in ROS levels, after H2O2 stimulation (Min, Yang et al. 2006). The way it lead to the reduction of ROS production by microglia appeared to be through the increase in the expression of an antioxidant enzyme, heme oxygenase-1. Thus, it appears that released factors from astrocytes are able to modulate microglial reactivity, controlling microglia’s activated state.ACM is known to contain a number of factors such as TGF-, S100, fibroblast growth factor-2, plasminogen activator inhibitor-1, BDNF, cerebral dopamine neurotrophic factor (CDNF), GDNF, among others. From these GDNF has proven to protect dopaminergic neurons as well as control microglia’s activation, therefore it relevance for our study.
2.2.1 GDNF as a neuroprotective factor and a modulator of
microglial reactivity
GDNF was initially identified in conditioned media from a glial cell line, with the ability to increase the survival, cell size and neurite length of DA neurons in culture (Lin, Doherty et al. 1993, Lin, Zhang et al. 1994). It was believed to be a selective survival factor for nigrostriatal dopaminergic neurons, but later studies indicated that GDNF was also able to support the survival of spinal motoneurons (Henderson, Phillips et al. 1994), brain noradrenergic neurons (Arenas, Trupp et al. 1995) and was capable to regulate the survival, differentiation and migration of peripheral neurons (Trupp, Ryden et al. 1995).
It has been described that GDNF has a neuronal survival effect during development and in the adult brain. It does not appear to be absolutely necessary for embryonic development of nigrostiatal dopaminergic system (Moore, Klein et al. 1996) but striatal levels of GDNF regulate normal ontogenic death of dopaminergic neurons in postnatal period (Oo, Kholodilov et al. 2003). In an adult brain, GDNF is necessary for dopaminergic neurons maintenance and protection against injuries.
In animal models of PD, GDNF has proven to have the ability to protect dopaminergic neurons, namely in MPTP and 6-hydroxydopamine (6-OHDA) lesioned animal models (Tomac, Lindqvist et al. 1995, Gash, Gerhardt et al. 1998). In non-human PD models, GDNF lead to an increase in the number of dopamine neurons and also to an improvement of typical PD symptoms, namely bradykinesia, rigidity, balance and posture (Gash, Zhang et al. 1996). Other studies regarding the effect of GDNF in the disease’s model, showed that its effect lies on a facilitation of dopaminergic nerve terminal regrowth, at the site of administration, as
6
well as restoration of dopaminergic phenotype in injured cells (Bowenkamp, David et al. 1996).
The use of animal models to study the efficiency of GDNF in dopaminergic protection is based on an injection with a neurotoxin (6-OHDA or MPTP, for example) followed by a single or several injections of GDNF. Usually a way to verify the loss of dopaminergic neurons is through the number of tyrosine hydroxylase (TH) positive cells, since TH is an enzyme involved in the production of dopamine, but some of the initial loss of immunoreactivity may result from downregulation of TH gene expression rather than actual cell loss. The period of time between injection with neurotoxin and GDNF is variable but dopamine protection has been observed when this gap is 4-5 weeks wide, indicating that there is a window of time where oxidative stress might be reversible (Cohen, Zigmond et al. 2011).
In a PD animal model, the use of 1-methyl-4-phenyl-1,2,3,6-tetrahydropyridine (MPTP) induced degeneration of DA neurons and simultaneously up-regulated GDNF in astrocytes, which could be related to its neuroprotective functions (Chen, Zhang et al. 2006). Also, in PD it appears that, in the substantia nigra pars compacta, although microglia exhibits an inflammatory phenotype, astrocytosis is absent, which makes the inflammatory process in PD different from other neurodegenerative diseases (Mirza, Hadberg et al. 2000). Associated with the absence of astrocytosis, GDNF protein levels are reduced and GDNF mRNA are down-regulated in PD (Song, Halliday et al. 2009).
In short, GDNF released by astrocytes may have an important role in the protection of dopaminergic neurons. Genetically modified astrocytes expressing GDNF may also be capable to protect dopamine neurons. In fact, these modified astrocytes have provided nigral dopamine neurons protection, when implanted into the midbrain of a PD mouse model (Cunningham and Su 2002). It is believed that GDNF induces its effect through GDNF family receptor (GFR)1, since heterozygous mice for this receptor, showed a reduced neuroprotective effect of GDNF in a model of focal ischemia (Tomac, Grinberg et al. 2000).
Beyond its neuroprotective properties, GDNF has also been described as a modulator of microglial reactivity. Soluble mediators released by midbrain astrocytes have been shown to prevent microglial activation evoked by ZyA. Microglial activation was abolished when the action GDNF, present in the ACM, was blocked using a specific antibody. Furthermore, media condicioned by astrocytes silenced for GDNF were not able to prevent microglial activation (Rocha, Cristovao et al. 2012). GDNF has, also, proven to be able to protect dopaminergic neurons in LPS model. As previously mentioned, LPS is capable to induce microglia’s activation and dopaminergic cell death and pre-treatment with GDNF prior to LPS stimulation appears to protect dopaminergic neurons, as well as inhibit microglial activation (Xing, Xin et al. 2010).
7
2.2.1.1
GFR
1 in the modulation of microglial activation by
GDNF
The receptor for GDNF is composed by a transmembrane signaling component, the Rearranged during Transfection (RET) receptor tyrosine kinase, and a ligand associated with RET receptor, GFR. Different GDNF family ligands (GFL) bind to different GFR receptors, in a way that GDNF binds preferentially to GFR1, while neurturin, for instance, binds to GFR2 (Jing, Wen et al. 1996). Once GFL bind to their correspondent GFR receptor, the ligand/receptor complex interacts with RET, inducing phosphorylation of tyrosine residues in RET intracellular region and consequently activating cytoplasmic signaling pathways (Airaksinen, Titievsky et al. 1999). Alternatively, GFR may use neural cell adhesion molecule (NCAM) as signaling receptor for GFL; in cells where NCAM and GFR receptors were expressed, but not RET, GFL induced NCAM phosphorylation (Paratcha, Ledda et al. 2003).
The importance of GFL for nervous system development has been described in in vivo studies, where mice deficient for these, GFR or RET receptors, exhibit deficits in both central and peripheral nervous system (Baloh, Enomoto et al. 2000).
The importance of understanding GDNF signaling in this study lies in the fact that GDNF binds preferentiality to GFR1 receptor, which is important for neuronal survival and differentiation but also relevant in controlling microglial reactivity in the brain (Honda, Nakajima et al. 1999). The ability for this complex GDNF/GFR1 to control microglia phenotype has been reported, where the blockage of GFR1 receptor in microglia cultures, followed by ACM incubation, where GDNF was present, lead to an incapacity of GDNF to prevent ZyA-induced microglial activation (56).
9
Aims of the Project
The dopaminergic protection provided from GDNF has been proven, as well as its ability to prevent microglial activation; the way GDNF manages to control microglia’s activation appear to be through GFR1 receptor. Stimulation with LPS, in co-cultures of microglia with neurons, has been described as capable to induce dopaminergic lesion, as well as microglial activation.
The relation between dopaminergic protection and the control of microglial activation exerted by GDNF is still unanswered. It is not known whether the anti-inflammatory action of GDNF underlie its ability to protect midbrain dopaminergic neurons, in a cause-effect relationship.
In order to answer to this question we propose to:
- Demonstrate the existence of GFR1 in our study cultures: N9 and primary ventral midbrain microglia cultures;
- Silence GFR1 receptor expression in microglia;
- Determine a LPS concentration capable to induce a selective dopaminergic injury in a co-culture of microglia with neuron–glia mixed cultures, without harming other neurons;
- Determine the concentration of GDNF capable to preven microglial activation induced by LPS and to protect dopaminergic neurons in the co-culture between microglia and a neuron-glia mixed culture;
- Block the action of GDNF specifically in microglial cells by GFR1 siRNA and verify its effect in LPS-induced dopaminergic injury.
These set of experiments will clarify the importance of the control of microglial activation by GDNF to the survival of dopaminergic injury.
11
Materials and Methods
1. Primary and cell line cultures
All animals were handled in accordance with the national ethical requirements for animal research, and with the European Convention for the Protection of Vertebrate Animals Used for Experimental and Other Scientific Purposes.
1.1 Ventral midbrain neuron-glia mixed culture
Ventral midbrain cells were obtained from rat Wistar embryos with 15-16 gestation days. The pregnant females were anesthetized with ketamine (87,5 mg/kg) and xilazine (12,5mg/kg). A cut was performed in the abdominal cavity and the embryos were removed from it and placed in a Petri dish with sterile ice-cold phosphate buffered saline, PBS, (NaCl 140 mM, KCl 2,7 mM, KH2PO4 1,5 mM and Na2HPO4 8,1 mM, pH 7,4). To ensure the decease of the animal a cervical dislocation was performed. The embryos were then withdrawn from the pregnant rat and their ventral midbrain was dissected. The tissue resulting from the dissection was transferred into a digestion solution, composed by trypsine (4,5mg/mL) and DNAse (2,5mg/mL) diluted in PBS, and incubated for 4 minutes in a 37ºC bath. In order to stop the enzymatic digestion, the supernatant was removed and replaced by PBS containing 10% Fetal Bovine Serum (FBS, Biochrom AG), followed by mechanical disaggregation. The tissue was pelleted by centrifugation at 405G for 3 minutes (3K18C Bioblock Scientific; Sigma Laboratory Centrifuges) and suspended in Neurobasal medium (Gibco) supplemented with 2% B27 (Gibco), 0,05 μg/mL glutamine (Sigma), 25 μM glutamate (Sigma), 10% FBS (FBS, Biochrom AG), 50 μg/mL gentamicine (Sigma), and 100 U/mL penicillin plus 100 μg/mL streptomycin (Sigma). The cells were then plated onto 15mm coverslips, previously coated with poly-D-lysine (Sigma-Aldrich, St. Louis, USA), at a density of 0,4 × 10⁶ cells/well in 24 well plates (Orange Scientific).
1.2 Ventral midbrain neuronal culture
Primary ventral midbrain neuronal culture was obtained following the previous protocol, only modifying the medium in which cells were cultured. The medium had the same composition as the one used for neuron-glia mixed culture with the alteration that for neuronal cultures the medium contained no FBS.
12
1.3 Ventral midbrain microglia cell cultures
Ventral midbrain was dissected from postnatal day 3-5 Wistar rats, carefully stripped from meninges and put in cold PBS. The tissue was then submitted to enzymatic dissociation, through papain solution (20 units/mL of papain (Sigma 76220), dissolved in cysteine water (1 mM cysteine), 1.5 mM CaCl2, 116 mM NaCl, 5.4 mM KCl, 26 mM NaHCO3, 2 mM NaH2PO4.H2O, 1 mM MgSO4.7H2O, 0.5 mM EDTA, 25 mM glicose and 0.001% phenol red) for 4 minutes at 37ºC and then mechanically dissociated with sequential passes through 20-, 22-, and 25-gauge needles. The tissue was pelleted by centrifugation for 3 minutes at 405G (3K18C Bioblock Scientific; Sigma Laboratory Centrifuges), and suspended in Dulbecco's modified Eagle's medium (DMEMSigma D5648) supplemented with 10% FBS (Biochrom AG), 3,7g/L NaHCO3 and 100 U/mL penicillin plus 100 μg/mL streptomycin (Sigma), pH 7,3). The cells were cultured onto a 6-well plate (Orange Scientific), previously coated with poly-D-lysine, at a density of 0,976x106 cells per well and kept at 37ºC in a 5% CO2, 95% air atmosphere.
Two weeks after cells were plated, microglia was isolated through trypsinization. Trypsin-Ethylene glycol tetraacetic acid (Trypsin-EGTA) solution (0,02% EGTA, 0,05% Trypsin, prepared in PBS) was diluted in serum and antibiotic free DMEM in the proportion of 1:3. After washing the cells twice with serum and antibiotic free DMEM, the trypsin solution was then put into contact with the cells, for 30-40 minutes. Once the astrocytes started to loose, cells had their medium changed to DMEM with 10% FBS (Biochrom AG) and 100 U/mL penicillin plus 100 μg/mL streptomycin, in order to stop the trypsinization and to prevent unintentional release of microglia as well. The cells were washed twice in this medium and then left to rest for 5 days at 37ºC in a 5% CO2, 95% air atmosphere before proceeding with the experiments.N9 microglia cell culture
1.4 N9 microglia cell culture
The N9 murine microglia cell line was cultured in Roswell Park Memorial Institute (RPMI) medium 1640 (Sigma R6504), supplemented with 10 % heat-inactivated FBS ( Biochrom AG), 100 U/mL penicillin and 100 g/mL streptomycin (Sigma), pH 7.3, at 37ºC in a 5% CO2 humidified incubator. The medium was replaced every 3 days until 80-90 % confluence was reached.
1.5 Neuron-glia/N9 microglia co-culture
After 5 days in culture, neuron–glia mixed culture was co-cultured with N9 microglia cells. Co-culture of the neuron-glia cells with N9 microglia cell line was performed through trypsinization of N9 cells, followed by distribution of 0,4x10⁵ microglia cells into each well of a 24 well multi-plate containing coverslips with neuron-glia cells. N9 microglia cells were allowed to rest for 2 h before starting the experiments.
13
Two hours prior to this contact, neuron-glia mixed culture had their medium changed into a Non-Essential Amino Acids Medium (Minimum Essential Medium (MEM, Sigma M5650) supplemented with 1g/L glucose, 0.29g/L L-glutamine, 0.11g/L sodium pyruvate, 1% non essencial aminoacids (Gibco) and 2g/L NaHCO3, 2.6 g/L HEPES, pH 7,3). Co-cultured cells were stimulated with 0.01, 0.1, 1 and 10 g/mL of LPS, for 24h, having then their medium collected for NO analysis and being fixed with 4% paraformaldehyde (PFA) for phagocytosis and immunocytochemistry assay.2. GFR
1 silencing with siRNA transfection
Pre-designed small interfering RNA (siRNA) was used to perform the silencing of GFR1 receptor (Santa Cruz, sc-270400). GFR1 silencing was performed following manufacturer’s instructions. Briefly, N9 microglia was cultured at a density of 0,73x10⁵ cells per well in 12-well plates in serum and antibiotic free RPMI medium for 24 hours. For each well, two separated solutions, A and B, were prepared: 1.10 L (3pmol) and 2.55 l (7pmol) GFR1 siRNA (from the stock 10M GFR1 siRNA solution prepared in a 10M Tris-HCL, pH 8, 20mM NaCl, 1 mM ethylenediaminetetraacetic acid (EDTA) buffered solution) was mixed with 36.46 L transfection medium (solution A); 2.19 L siRNA transfection reagent (Santa Cruz, sc-29528) was mixed with 36.46 L transfection medium (solution B). Solution A was mixed with solution B and, after homogenization, the mixture was left for 30 minutes at room temperature, protected from the light. After that, 292 l of transfection medium was added. N9 cell cultures were washed once with serum free RPMI and then treated with 350 L of the mixture solution. Control siRNA was also prepared in the same way as GFR1 siRNA. The culture was maintained at 37ºC in a 5% CO2, 95% air atmosphere for 6 hours, after which 350 l of RPMI with 20% FBS and 200 U/mL penicillin and 200 g/mL streptomycin was added. After 24 hours, the medium was replaced by RPMI containing 10% FBS, 100 U/mL penicillin and 100 g/mL streptomycin, for an additional period of 24 h at 37ºC in a 5% CO2, 95% air atmosphere.
A similar procedure was followed for GFR1 silencing in ventral midbrain microglia cultures, which were previously plated in 6 well plates as described before. Volumes of siRNA, control siRNA, transfection reagent and transfection medium were adjusted accordingly to the surface area of these plates.
14
3 Western blot
N9 and primary microglial cultures cells were washed once with PBS and then lysed on ice using a lysis buffer (RIPA buffer) containing 150mM NaCl, 50mM Tris-HCl pH 7.4, 5mM EGTA, 1% Triton X-100, 0.5 % sodium deoxycholate and 0.1% sodium dodecyl sulphate (SDS). Protein concentration was determined using the BCA method (PierceTM BCA Protein Assay Kit, Thermo Scientific) following manufacturer’s instructions. Samples were denatured by adding sample buffer (100 mM Tris, 100 mM glycine, 4% SDS, 8 M urea and 0,01% bromophenol blue) and heating at 100 °C for 5 min. Extract volume of of proteins were separated by SDS-polyacrylamide gel electrophoresisusing a 10% resolving gel under reducing conditions, at 45V during the first 30 minutes, and then at 90V over 1 hour. Proteins were then transferred to polyvinylidene difluoride membranes (Amersham Hybond™-P, GE Healthcare) overnight at 4ºC with a voltage of 45V. The next day, the voltage was increased to 100V, letting the transference to elapse for an additional hour. The membranes were then blocked with 5% non-fat milk (Regilait, France) in Tris-Buffered Saline containing Tween-20 (TBS-T: 0.1% Tween-20 in a 20 mM Tris and 500 mM NaCl solution, pH 7.3) for 1 h at room temperature. Incubation with the primary antibody against GFR1 (Santa Cruz Biotechnology H-70, sc-10716) (rabbit, 1:200) diluted in TBS-T was done overnight at 4 °C. After being rinsed three times with TBS-T for 45 minutes (3x15minutes), the membranes were incubated with a horseradish peroxidase conjugated secondary antibody (goat anti-rabbit, 1:5000; Santa Cruz, sc-2004), for 1h at room temperature. Incubation with primary antibody against glyceraldehyde 3-phosphate dehydrogenase (GAPDH) (Invitrogen H1399) (mouse, 1:5000) was performed to obtain protein loading controls. The membranes were then incubated with ECL (ECL Western Blotting Reagent Packs, GE Healthcare) for 2 minutes and then films were placed over the membrane in order to capture the signal. Film exposure times were variable, depending on the protein. GAPDH bands took around 30 seconds of exposure to obtain a clear image, while GFR1 bands took around 4 minutes.
4 Immunocytochemistry
Primary and N9 microglia cells were fixed in 4% PFA for 10 minutes and permeabilized with 1% Triton X-100 in PBS for 10 minutes. Blocking was made through incubation with 20% FBS in PBS containing 0.1% Tween-20 for 60 min at room temperature. The cells were then incubated for 60 min at room temperature with the following primary antibodies, according to the aim of the experiment: mouse antibody against TH (1:2000; BD Biosciences 612300), rabbit antibody against MAP2 (1:500; Santa Cruz, sc-20172), mouse antibody anti-CD11b (1:150; Chemicon MAB 1408), rabbit antibodyanti-GFAP (1:1000, DAKO Z0334) and rabbit antibody anti-GFR1 (1:50, Santa Cruz Biotechnology, H-70). After 6x PBS-T washing over 15 minutes, cells were incubated for 60 min at room temperature with the appropriated
15
secondary antibodies conjugated with Alexa Fluor 546 or 488 (1:1000, Invitrogen). After 6x PBS-T washing over 15 minutes, incubation with Hoechst 33342 (Invitrogen) diluted in PBS-T (final concentration of 2M) over 10 minutes was made. After washing twice with PBS-T, the side of coverslips where cells were located were put into contact with fluorescence mounting medium (S3023 DAKO) and sealed with varnish. The number of TH positive (TH+) and MAP2+ cells were analyzed in 20 different fields using a Zeiss inverted microscope under x63 magnification, and normalized to the total number of nuclei (assessed with Hoescht 33342 staining).5 Phagocytosis Assay
To evaluate the effect of LPS stimulation on N9 microglial reactivity, phagocytic activity was studied. After 24 hours of LPS stimulation, N9 cultures were incubated for 15 min with 0.01% fluorescent 1-m polystyrene microspheres (Molecular Probes), while protected from the light. Cultures were then washed with Non-Essential Amino Acids Medium, to remove nonengulfed microspheres, followed by fixation with 4% PFA over 20 minutes. Incubation with Hoechst 33342 (Invitrogen) diluted in PBS-T (final concentration of 2M) over 10 minutes was performed, followed by 3 times PBS-T washing. Coverslips were mounted as decribed for the immunocytochemistry and then observed on a Zeiss inverted microscope using x63 lens. Cells with bright, punctuated fluorescence were considered phagocytic
.
6 Nitric oxide Quantification
Nitric oxide production assay was based on the Griess reaction to measure the concentration of nitrite in the extracellular medium. To evaluate the effect of LPS stimulation on N9 microglial reactivity in co-culture with the neuron–glia mixed culture, medium was collected and quantified for nitrite concentration. After dispensing 50L Non-Essential Amino Acids Medium into 7 wells of a 96-well plate, standard reference curve was made using with 100, 25, 12.5, 6.25, 3.125, 1.56 and 0 M nitric concentrations. This curve was performed in triplicate. After adding 50L of medium from every experimental condition, 50L of 1% Sulfanilamide in 5% ascorbic acid was added to every well, including the ones of the standard reference curve. After 5-10 minutes protected from light, Naphthylethylenediamine (NED) solution (0.1% diluted in H2O miliQ) was added and let for an additional 5-10 minutes, also protected from light. Absorbance measurement was performed at 550 nm.
16
7 Statistical analysis
Data are expressed as percentages of values obtained in control conditions and are presented as means ± SEM for the indicated number of experiments, performed in independent cell cultures. Statistical analysis was performed using one-way ANOVA followed by Bonferroni's Multiple Comparison or Dunnett’s test, as indicated in figure legends. Values of p<0.05 were considered statistically significant. All statistical procedures were performed using GraphPad Prism 6 software (GraphPad Software Inc.).
17
DAPI GFR1 Merge
Results
1. GFR
1 expression in N9 and ventral midbrain microglia
cells
To ensure that GFR1 was expressed by N9 and ventral midbrain microglia cells, these were processed for GFR1 immunocytochemistry.
N9 microglia cells were immuno-positive for GFR1, indicating that these cells express this receptor (Figure 2). An identical immunochemistry was made for primary microglia cells.. Ventral midbrain microglia was also positive GFR1 which suggests that this receptor is also present in these cells (Figure 3).
Western blot analysis for GFR1 expression in these type of cells was also performed. Immunoreactive bands for this receptor were observed, at a molecular weight of 48, 63 and 75 kDa, corroborating the immunocytochemistry result for the presence of GFR1 receptor in these cultures (Figure 4).
Fig. 2 –Immunochemistry for GFR1 in N9 cells (green). Nuclei were identified through Hoescht staining (blue).
18
B A CA
B
D
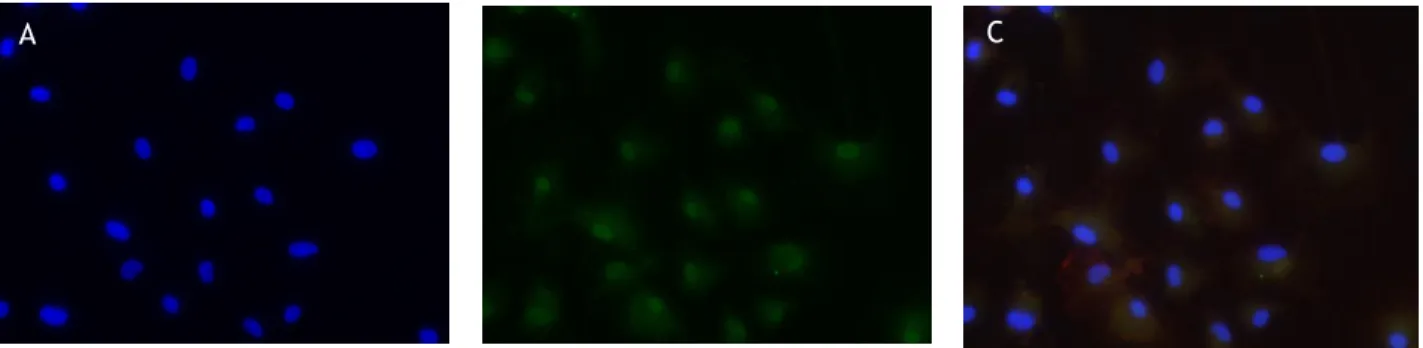
Fig. 3 – Immunochemistry of primary microglial cells to evaluate the presence of GFR1. Nuclei were identified through Hoescht marker (A - blue) and GFR1 (B - green) immunostaining is presented. A merged image for all markers used in this immunocytochemistry is shown in C.
Fig. 4 – Representative Western blot images of GFR1 band (75kDa) for N9 (A) and primary microglia cells (B), with its correspondent GAPDH bands (C and D).
2. GFR
1 silencing in N9 and primary microglia culture
Short interfering RNA (siRNA) technology was used in order to reduce Gfr1 receptor expression in N9 and ventral midbrain microglia cells. The analysis on its reduction was made by comparing the GFR-1 siRNA conditions with the control situation (cells treated with transfection reagent, in the absence of siRNA). A negative control was always included in siRNA experiments. This control siRNA contains a scrambled sequence that will not lead to the specific degradation of any known cellular mRNA. Two different volumes of GFR1 and control siRNA were used: volume 1 will refer to the experiments where 3 pmol of siRNA was used while volume 2 will refers to experiments using 7 pmol of siRNA.
In N9 microglia cell line, using the lower volume of siRNA, a significant decrease of 42.6% in GFR1 expression was observed (Figure 5), when compared the control situation using the transfection reagent (Control-TR); no significant effect of control siRNA on GFR1
19
expression was observed. In experiments where volume 2 of siRNA was used, no significant differences were visualized in Gfr1 expression when compared to Control-TR. No significant effect of control siRNA on GFR1 expression was observed.Fig. 5 –GFR1 relative expression in N9 cell cultures treated with different amounts of GFR1 siRNA (3pmol - vol1 and 7pmol - vol2) and control siRNA (Ctr siRNA). The lower amount of GFR1 siRNA lead to a significant decrease in GFR1 expression; all remaining conditions do not appear to differ when compared to Control-TR (Ctr-TR). GFR1 expression was normalized to GAPDH expression for every conditions. Data shown represent the mean ± SEM of up to 6 independent experiments (N=6 for Control-RT, N=5 for GFR1 (vol1), N=4 for Ctr siRNA (vol1) and N=3 for the remaining conditons). Statistical analysis was performed using one-way ANOVA followed by Bonferroni’s Multiple Comparison test. * P < 0.05, when compared with Control-TR.
GFR1 expression, also using siRNA, was also evaluated in primary cultures of ventral mibrain microglia (Figure 6). In this case only one experiment was performed so data presented are just preliminary results that need to be confirmed. Contrary to the experiments using N9 microglia cell line, only volume 2 of GFR1 siRNA, referring to 7pmol of GFR1 siRNA, was used. However, this preliminary result shows a reduction of 57 % in GFR1 expression was observed when the lower amount of GFR1 siRNA was used. This unique experiment also showed that control siRNA appears to reduce GFR1 expression drastically; however, more experiments need to be conducted to get a more realistic idea of the effect of siRNA in GFR1 expression in primary cultures of microglia.
Con
trol
Ct
r-TR
1
siRNA
(v
ol1
)
GF
R
1
siRNA
(v
ol2
)
GF
R
Ct
r siRNA
(v
ol
1)
Ct
r siRNA
(v
ol
2)
0 50 100 150*
G
F
R
1
r
e
la
tiv
e
e
xp
re
ss
io
n
le
ve
ls (%
C-TR
)
20
Fig. 6 – GFR1 relative expression in primary cultures of microglia treated with GFR1 and control siRNA. The amount of siRNA used is denominated as volume 2, referring to the use of 7pmol of siRNA. Data shown represent the results obtained in one preliminary experiment.
3. Time course for N9 microglial activation in the presence of
LPS
To optimize the incubation time of N9 microglia with LPS in order to obtain a significant NO production by these cells, a time course was performed. LPS was used in a concentration of 0.1 g/mL, followed by NO assay. To evaluate the response of N9 microglia to this stimulus, several times of exposure were tested (1h, 3h, 6h, 9h, 12h, 24h) in order to determine when N9 would have a higher NO production in response to LPS. At 24 hours, a peak of NO production was verified and a gradual decrease of NO was observed for lower incubation times with LPS (Figure 7). At 24 hours of LPS exposure, NO production had a 2-fold increase when compared to control (p <0.05); no significant differences were seen for the remaining LPS incubation times when compared with the control condition.
Ct
r-RT
1
siRNA
(v
ol2
)
GF
R
Ct
r siRNA
(v
ol
2)
0 50 100 150G
F
R
1
r
e
la
tiv
e
e
xp
re
ss
io
n
le
ve
ls (%
Ct
r-RT)
21
Fig. 7 – Effect of LPS on NO production by N9 microglia cells. N9 cell cultures were exposed, for the indicated periods of time, to LPS 0.1 g/mL. Data shown are the mean ± SEM of 5 independent experiments. Statistical analysis was performed using one-way ANOVA followed by Dunnett’s test.P < 0.05, when compared with control (Ctr).4. Effect of LPS on dopaminergic cell viability in co-cultures
of N9 microglia cells and neuron-glia mixed cultures
The aim of this experiment was to determine which concentration of LPS could induced a selective dopaminergic injury in co-cultures of N9 microglia cells and neuron-glia mixed cultures. Analysis of TH+ cells (dopaminergic neurons) and microtubule-associated protein 2 positive (MAP2+) cells (total neurons), allowed to determine which concentration of LPS lead to a significant dopaminergic injury, without affecting the other neurons in culture. Stimulation of co-cultures with 0.01, 0.1 and 1 g/mL of LPS lead to a reduction of 26%, 51% and 63%, respectively, in the number of TH+ cells over the total number of cells (Figure 8 A). The analysis of the number of MAP2+ cells over the total number of cells (Figure 8 B) showed that LPS treatment did not affect the total number of neurons in the culture.
Ctr
1h
3h
6h
9h
12
h
24
h
0
50
100
150
200
250
*
N
O
p
ro
d
u
ct
io
n
(
%
C
tr
)
22
Fig. 8 –Effect of different concentrations of LPS in the number of TH+ (A) and in the number of MAP2+ cells (B) (normalized to the total number of cells). Data presented are the Mean ± SEM of 3 independent experiments, performed in duplicate. Statistical analysis was performed using one-way ANOVA followed by Dunnett´s test.*** P <0.001, * P < 0.05 as compared to control (Ctr).
The number of TH+ cells over MAP2+ cells, followed by normalization to the total number of cells, gave a similar information. For 1 g/mL LPS, a significant reduction of 57% in the TH+/MAP2+ ratio was observed, while a decrease of 47% was obtained when 0.1 g/mL LPS was used (Figure 9).
Fig. 9 –Ratio between the number of TH+ and MAP2+ cells, normalized to total number of cells, after LPS exposure (0.01, 0.1 and 1 g/mL) in co-cultures of N9 microglia cells with neuron-glia mixed cultures. Data presented are the mean ± SEM of 3 independent experiments, performed in duplicate.
A
B
Contro l g/mL LPS 0.01 g/mL LPS 0.1 g/mL LPS 1 0 50 100 150 M A P 2 + / to ta l ce ll s (% Co n tro l) Contro l g/mLL LPS 0.01 g/mLL LPS 0.1 g/m L LPS 1 0 50 100 150 * *** *** TH + c el ls /T ot al c el ls (% C on tr ol ) Ctr g/mL LPS 0.01 g/mL LPS 0.1 g/mL LPS 1 0 50 100 150**
**
TH
+/MAP
2
+norm
a
li
zed t
o
tot
a
l nu
m
be
r
of
ce
ll
s
(%
C
tr
)
23
Statistical analysis was performed using one-way ANOVA followed by Dunnett´s test. ** P <0.01 as compared to control (Ctr).5. Effect of LPS on microglial activation in co-cultures of N9
microglia cells and neuron-glia mixed cultures
Results presented in Figure 9 showed that LPS was able to selectively injury dopaminergic neurons in our co-culture cell setup. Therefore, in the next experiments we aimed at confirming if under these conditions, microglial activation was achieved. To verify LPS ability to induce microglial activation in co-cultures of N9 microglia cells and neuron-glia mixed cultures, different LPS concentrations were used (0.01, 0.1, 1 and 10 g/mL), followed by the analysis of two parameters of microglial activation: NO production and phagocytic activity. In order to confirm LPS stimulation, through NO assay, culture medium was collected after LPS stimulation and the concentration of NO in the medium was determined in order to confirm that microglia is activated under those conditions. After normalization to control levels (considered 100%), NO production upon exposure to LPS 1g/mL concentration was the highest of all tested concentrations having a 1.7 increased fold over the control (p < 0.05). All tested concentrations appear to induce an increase in NO release into medium (although non statistically significant), with the exception of the 0.01 g/mL LPS concentration.
Fig. 10 –Effect of different concentrations of LPS on NO release in co-cultures of N9 microglia cells and neuron-glia mixed cultures. Data presented are Mean ± SEM for up to 6 independent experiments (N=6 for control (Ctr), LPS 1g/mL and LPS 0.1g/mL; N=5 for LPS 0.01g/mL and N=3 for
Ctr
g/
mL
LP
S
0,
01
g/
mL
LP
S
0,
1
g/
mL
LP
S
1
g/
mL
LP
S
10
0
50
100
150
200
250
*
N
O
p
ro
d
u
ct
io
n
(
%
C
tr
)
24
LPS 10 g/mL. Statistical analysis was performed using one-way ANOVA followed by Dunnett’s test.* P < 0.05 as compared to control.
We then analyzed microglial activation using a phagocytosis assay. After LPS stimulation, the co-culture was treated with fluorescent 1-m polystyrene microspheres to evaluate how LPS would affect phagocytosis activity of N9 cells. A 1.8 fold increase in the number of phagocytic cells was verified with 1g/mL LPS concentration, while 0.1 g/mL lead to 1.3 fold increase. Only one experiment was performed, so these results need to be confirmed in additional experiments.
Fig. 11 –Effect of different concentrations of LPS in the number of phagocytic cells (normalized to the total number of cells) in co-cultures of N9 microglia cells with neuron-glia mixed cultures. Data shown represent the results obtained in one experiment, performed in duplicate.
Ctr g/mL LPS 0,1 g/mL LPS 1 0 50 100 150 200