UNIVERSIDADE DA BEIRA INTERIOR
Ciências Sociais e Humanas
Accounting Fundamentals and Volatility in the
Euronext 100 index
Raúl Daniel Navas
Tese para obtenção do Grau de Doutor em
Economia
(3º ciclo de estudos)
Supervisors: Prof.ª Doutora Ana Paula Bernardino Matias Gama
Prof.ª Doutora Sónia Margarida Ricardo Bentes
iii
Agradecimentos
A satisfação de ver quase concluída mais uma etapa da vida, tão ambicionada, faz quase esquecer as inúmeras dificuldades passadas e, tudo parece ter valido a pena. Contudo, é nesta altura que vale a pena fazer uma retrospetiva e relembrar um pouco daquilo que foram os quatro últimos anos, durante os quais este trabalho foi desenvolvido. É quase impossível mencionar todas as pessoas que foram importantes para a sua elaboração, no entanto, primeiro que tudo gostaria de deixar uma nota de agradecimento a todos aqueles que contribuíram para a minha formação, a todos os níveis, ao longo da minha vida, professores e família. Torna-se imperativo mencionar os momentos alegres e menos alegres, que um trabalho desta envergadura envolve, e cuja ajuda e incentivo foram determinantes.
Não porque seja necessário, mas porque seria injusto se o não fizesse, deixo um agradecimento especial às minhas duas orientadoras, Prof.ª Doutora Ana Paula Matias Gama e à Prof.ª Doutora Sónia Margarida Ricardo Bentes, não apenas pelo incentivo que sempre me deram, mas principalmente por ter acreditado em mim desde o primeiro dia. As suas capacidades de investigação, visão e perseverança são para mim um modelo de conduta a seguir. Para elas a minha mais profunda gratidão e admiração.
Ao Professor Doutor José Dias Curto e ao Professor Doutor Rui Menezes agradeço a disponibilidade demonstrada sempre que foi necessário apoio na compreensão de alguns tópicos relacionados com o tema em apreço, para além das valiosas sugestões prestadas no sentido de aperfeiçoar a transmissão dos conhecimentos adquiridos ao longo deste percurso. Ao Professor Doutor João Monteiro agradeço o apoio prestado indispensável à compreensão de algumas temáticas.
À Professora Doutora Maria de Rosário Cabrita pelo incentivo na elaboração desta tese. À instituição académica que acolheu o meu trabalho, a Universidade da Beira Interior, quero manifestar o meu reconhecimento pelo apoio e condições que me disponibilizou.
À minha família, em especial aos meus pais, vale a pena renovar toda a minha gratidão pelo carinho e apoio incondicional que sempre me prestaram. A eles devo a pessoa que sou hoje. Por último, mas não menos importantes, deixo um agradecimento aos meus colegas e amigos, pela amizade, companheirismo, incentivo e bom humor que muito me ajudaram para ultrapassar os momentos menos bons.
iv
Abstract
To determine whether accounting fundamentals can provide relevant information to clarify firm value, this study examines the value relevance of accounting fundamentals in the Euronext 100 index—specifically, whether applying an accounting fundamental strategy to select stocks yields significant, positive excess market buy-and-hold returns after one and two years of portfolio formation. By integrating valuation theory and accounting research, this study introduces a set of accounting fundamental signals (F-score and L-score) that reflect information that can influence security prices, but not necessarily in a timely manner. Annual financial and market data from Euronext 100 index stocks between 2000 and 2014 reveal, after controlling for earnings, book-to-market ratio, and firm size, that the fundamental strategy provides value-relevant information to investors. The relationship between the accounting fundamental signals (i.e., F-score and L-score) and buy-and-hold market future (one- and two-year) returns is significant and positive. That is, portfolios formed on the basis of high scores on the signals achieve a 13% average market excess annual return between 2000 and 2014. In addition to addressing the practical problem of mispriced stocks, this study contributes to scarce accounting research in European capital markets by detailing the “post-earnings” drift phenomenon in a Euronext 100 index.
Because under the period of analysis the Euronext 100 index showed strong volatility, further this studyalso explored asymmetric effects which are fundamental to stock market volatility. Considering their relevance, this study therefore examines the conditional volatility of returns to the Euronext 100, with a particular focus on the asymmetric properties of this market. The analysis entails an estimate of the symmetric GARCH and asymmetric EGARCH and T-GARCH models, using a data set of daily closing prices from the index that spans from December 3, 2000, to December 18, 2015. The findings show that conditional variance is an asymmetric function of past residuals, offering strong evidence of asymmetries in the returns of the Euronext 100.
Keywords
v
Resumo
Para avaliar se a informação financeira (accounting fundamentals – rácios financeiros) permite determinar o valor da empresa, este estudo analisa a relevância dos rácios financeiros no índice Euronext 100. Especificamente, esta investigação examina se utilizando rácios financeiros é possível a seleção de ações para formar carteiras que gerem rendibilidades positivas segundo uma estratégia buy-and hold a um e a dois anos. Assim, integrando a teoria do valor (valuation theory) e análise fundamental, este estudo introduz um conjunto de rácios (F-score e L-score) que refletem informação que pode influenciar os preços, mas não necessariamente de forma imediata (lack of timeliess). Utilizando informação contabilística e informação de mercado das empresas cotadas no índice Euronext 100 para o período 2000-2014, os resultados mostraram que após se controlar o efeito do rácio dos resultados por ação (EPS), o rácio do valor contabilístico sobre o valor de mercado da empresa (BMR) e a dimensão da empresa (logaritmo do total do ativo), o coeficiente do F-score mostra que um incremento de uma unidade deste F-score está associado a um aumento das rendibilidades de 2.9% a 3.1%. O efeito do L-score é mais modesto, cerca de 1.8%. Adicionalmente as carteiras constituídas com os rácios que reportam valores mais elevados
i.e.. high scores para o F-score, segundo uma estratégia buy-and-hold a um ano apresentam
uma rendibilidade média de 13% quando comparada a rendibilidade do índice no período em análise. Atendendo ao fenómeno do “mispricing” das ações, este trabalho contribuí para a escassez de literatura no Mercado Europeu, dando enfoque ao “post-earnings drift
phenomenon”.
Dado que durante o período em análise se verificou uma forte volatilidade no índice Euronext 100, que coincidiu com a crise financeira de 2008/2009 e com a crise da dívida soberana europeia, e de forma a documentar a reação atípica do mercado durante este período, o presente trabalho tem também como objetivo fornecer um contributo para a análise do comportamento da volatilidade dos mercados financeiros, a qual assume especial relevo em resultado da complexidade e incerteza que atualmente caracteriza os mercados à escala global. Mais concretamente, o que se compara nesta tese são os resultados da abordagem tradicional assente no desvio-padrão e em modelos econométricos como o GARCH, EGARCH e
T-GARCH. Para tal, recorre-se a uma amostra constituída pelas rendibilidades do índice
bolsista Euronext 100 no período compreendido entre 3 de Dezembro de 2000 e 18 de Dezembro de 2015. Os resultados mostram que a variância condicional é uma função assimétrica de resíduos do passado, havendo uma forte evidência de assimetrias nas rendibilidades do Euronext 100.
vi
Palavras-chave
Rácios contabilísticos, Rendimentos, Carteira de investimento, Assimetria, EGARCH, T-GARCH.
vii
Resumo Alargado
A utilização da análise fundamental tem provado ter sucesso nos mercados desenvolvidos (e.g., Ball and Brown 1968; Kothari 2001; Richardson et al. 2010). Porém a evidência empírica tem mostrado uma subavaliavação/sobreavaliação ainda que temporária dos preço das ações, comparativamente ao seu valor intrínseco, fenómeno conhecido na literatura por “earnings
announcement drift” (Abarbanell and Bushee 1998; Piotroski 2000, 2005), sugerindo assim, a
necessidade de analisar a aplicabilidade da análise fundamental, mais concretamente rácios contabilísticos, que fornecem informação relevante aos investidores num mercado importante, como o europeu, nomeadamente o índice Euronext 100. Neste contexto, este estudo tem por objetivo analisar a relevância da análise fundamental na determinação do valor das empresas.
De acordo com a teoria do valor (valuation theory), ao longo do tempo os lucros convertem-se em cash-flows para os investidores, credores e para a empresa, constituindo estes o principal determinante do valor da empresa, que será refletido no preço das ações. Por sua vez, a análise fundamental através de um conjunto de rácios permite ao investidor analisar de forma detalhada a informação constante nas demonstrações financeiras, de forma a avaliar a eficiência e eficácia da empresa em gerar resultados e o seu potencial de crescimento no futuro (Dosamantes 2013). Assim, com base nos sinais dos rácios (accounting
fundamentals) propostos por Piotroski (2000) e Lev e Thiagarajan (1993) são utilizados dois
scores: o F-score e o L-score respetivamente, para a formação de carteira seguindo uma estratégia buy-and-hold a um e a dois anos. Estes scores apresentam um grande potencial por terem em conta fatores que se relacionam com os preços futuros das ações (Kim e Lee 2014; Piotrsoki 2005; Amor-Tapia e Tascón 2016). Assim, numa primeira fase, e recorrendo a diferentes modelos econométricos, este estudo evidência a relevância destes accounting
signals, i.e. F-score e L-Score, na previsão de rendibilidades supranormais, controlando-se
variáveis como os resultados por ação (EPS), o rácio do valor contabilístico sobre o valor de mercado da empresa (BMR) e a sua dimensão (e.g., Dosamantes 2013). Os resultados mostram que um incremento de uma unidade do F-score está associado a um aumento das rendibilidades supranormais de 2.9% a 3.1%. O efeito do L-score é mais modesto, cerca de 1.8%. Com efeito, o F-score evidencia uma relação estatisticamente significativa em todos os modelos; O L-score apenas se revela estatisticamente significativo no modelo de efeitos fixos. Numa segunda fase, constroem-se carteira com base no F-score e no L-score segundo uma estratégia buy-and-hold (e.g., Kim e Lee 2014). Os resultados são mais uma vez consistentes com referência ao F-score, que permite rendibilidades supranormais a um ano de 13%, quanto comparado com a rendibilidade do índice no período de 2000 a 2014. As rendibilidades proporcionadas pelo L-score apenas são estatisticamente significativas a dois anos.
viii
Adicionalmente e atendendo que atual contexto de instabilidade nos mercados financeiros à escala global, é relevante a análise do comportamento da volatilidade dos mercados financeiros. Desde o trabalho precursor de Markowitz (1959) que esta é uma variável pertinente, em especial nos processos de tomada de decisão que envolvem variáveis de natureza financeira. Vários autores desenvolveram modelos para tentar descrever as características principais da volatilidade dos ativos financeiros, extensivamente documentadas na literatura e na metodologia. É neste contexto que surge o modelo ARCH(q), proposto por Engle (1982), que tenta modelar a heterocedasticidade condicionada evidenciada pelas rendibilidades dos ativos financeiros. Bollerslev (1986) e Taylor (1986) desenvolveram de forma independente uma extensão deste modelo, vulgarmente designada por GARCH(p,q), cujas principais vantagens residiam, por um lado, no fato de ser mais parcimoniosa do que a anterior e, por outro, na admissão de que a variância condicionada era função não só do quadrado dos resíduos passados mas também dos seus próprios valores históricos. Dada a aceitação que este modelo alcançou, foram propostas numerosas variantes no sentido de contemplar os mais diversos fenómenos associados ao comportamento da volatilidade.
Considerando essas extensões, este trabalho procura examinar a dependência temporal das rendibilidade do índice Euronext 100, para determinar se as rendibilidade apresentam um comportamento assimétrico e, em caso afirmativo, qual o modelo que descreve essa assimetria melhor. Esta questão é relevante dada as respostas distintas aos choques positivos e negativos nos mercados. Dessa forma, aplicaram-se e compararam-se as formulações de heteroscedasticidade condicional assimétricas mais utilizados: EGARCH, GJR / TGARCH, e as especificações GARCH padrão. Estudos prévios favorecem modelos EGARCH (e.g., Cao e Tsay 1992; Loudon et al. 2000), enquanto que outros afirmam a superioridade de especificações
GJR-GARCH/TGARCH (e.g., Brailsford e Faff 1996; Hou 2013; Taylor 2004; Yeh e Lee 2000);
algumas investigações ainda indicam que EGARCH não supera um GARCH padrão para a previsão de volatilidade (e.g., Doidge e Wei 1998; Ederington e Guan 2010). Para complementar e alargar esta literatura, este trabalho tem como objetivo fornecer novas evidências empíricas sobre esta matéria, através de uma análise empírica repartida por três etapas, realizadas durante um período marcado por grande volatilidade do mercado 2000 a 2015. Primeiro, estimamos um modelo auto-regressivo AR (p) para cada série de rendibilidades, para remover qualquer correlação dos dados. Em segundo lugar, para validar esta especificação, testamos a correlação nos resíduos. Em terceiro lugar, estimamos os modelos, utilizando GARCH (1,1), EGARCH (1,1,1) e TGARCH (1,1,1) respetivamente. Os resultados mostram que a variância condicional é uma função assimétrica de resíduos do passado, havendo uma forte evidência de assimetrias nas rendibilidades do índice Euronext 100.
ix
Index
1. Introduction ... 1
2. Theoretical Background ... 5
2.1. Value investing ... 5
2.2. Efficient market hypothesis (EMH) ... 7
2.3. Volatility ... 10
3. Literature Review: Empirical Studies ... 12
3.1. Fundamental analysis (FA) ... 12
3.2. Post-earnings announcement drift (PEAD) ... 20
3.3. Accounting anomalies ... 22
3.4. Fundamental analysis anomalies ... 24
3.5. Volatility ... 26
4. Research Design ... 31
4.1. Accounting signals ... 31
4.1.1. Book-to-Market Ratio (BMR) ... 31
4.1.2. Capital expenditures (CAPEX) ... 31
4.1.3. Cash flow from operations (CFR) ... 31
4.1.4. Current ratio (CR) ... 32
4.1.5. Debt-to-total assets ratio ... 32
4.1.6. Earnings per share (EPS) ... 33
4.1.7. Gross margin (GM) ... 33
4.1.8. Return on operating assets (ROA) ... 33
4.1.9. Sales to assets (AT) ratio ... 33
4.1.10. Sales to employee ratio ... 34
4.1.11. Selling, general and administrative expenses (SGAE) ... 34
4.2. Construction of the fundamental scores: F-score and L-score ... 35
4.3. Fundamental analysis: econometric models... 39
4.4. GARCH Model ... 40
4.5. EGARCH Model ... 42
4.6. TGARCH Model ... 42
4.7. Information Criteria: SIC, AIC and the Logarithm of the Likelihood Function .... 43
5. Volatility: Results ... 44
5.1. Preliminary Data Analysis ... 44
5.2. Results ... 51
6. Fundamental Analysis: Results ... 61
6.1. Preliminary data analysis ... 61
6.2. Explanatory power of accounting signals F-score and L-score ... 67
x 7. Conclusions ... 82 8. References ... 86
xi
List of Figures
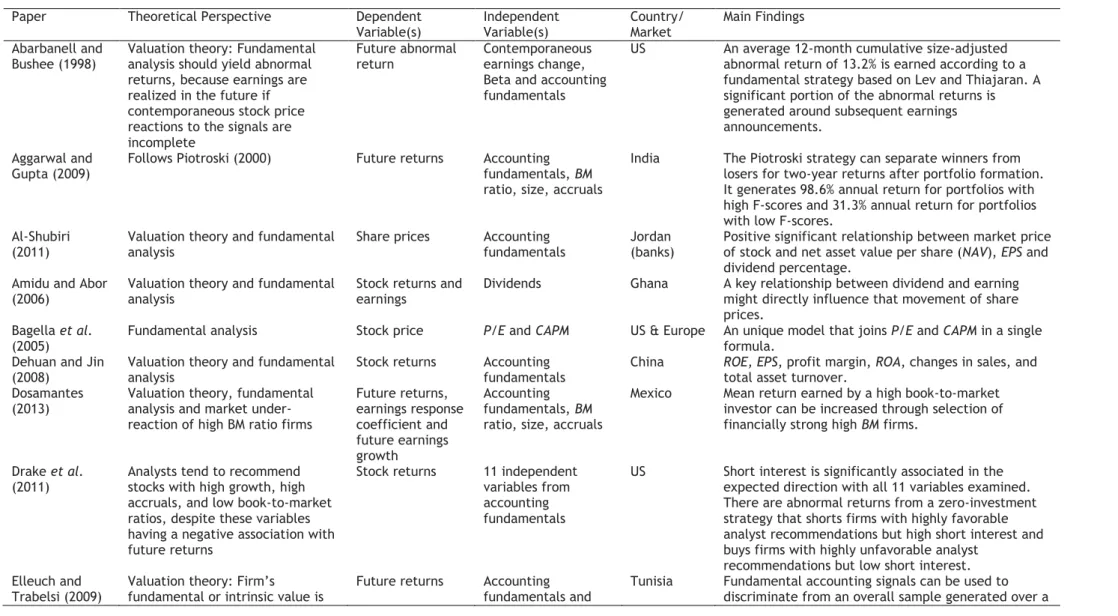
Figure 5.1 - Daily closing prices of the Euronext 100. ... 44
Figure 5.2 - Daily returns of the Euronext 100. ... 45
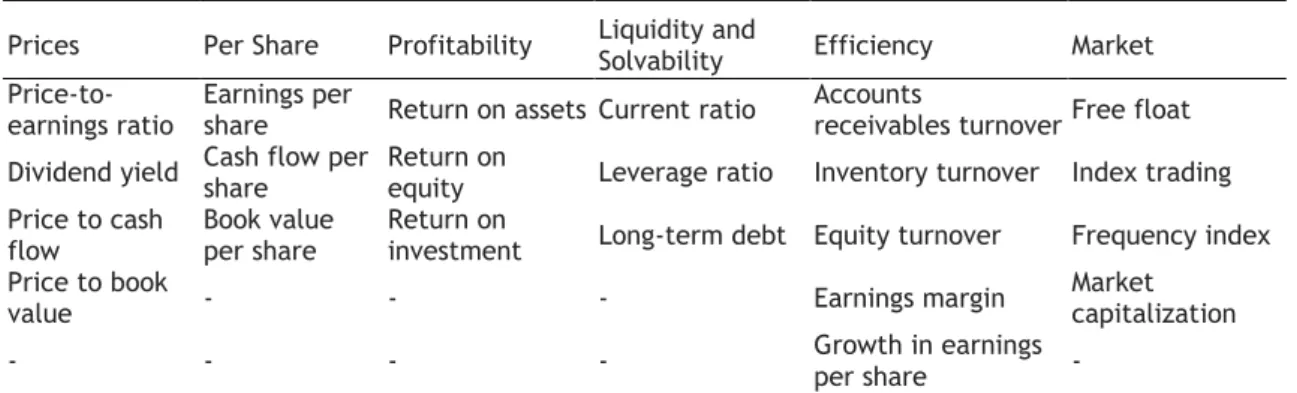
Figure 5.3 - Histogram of daily returns of the Euronext 100. ... 46
Figure 5.4 - Correlogram of returns for the Euronext 100. ... 48
Figure 5.5 - Correlogram of Square Residuals for the Euronext 100. ... 50
Figure 5.6 - Histogram of the residuals of the model AR (5). ... 52
Figure 5.7 - Correlogram of the residuals of the AR (5) model. ... 53
Figure 5.8 - Correlogram of residuals square for AR(5)-GARCH(1,1) model. ... 55
Figure 5.9 - Correlogram of residuals square for AR(5)-EGARCH(1,1,1) model. ... 56
Figure 5.10 - Correlogram of residuals square for AR(5)-TGARCH(1,1,1) model. ... 57
Figure 5.11 - Histogram of the residuals of the AR(5)-GARCH(1,1) model. ... 58
Figure 5.12 - Histogram of the residuals of the AR(5)-EGARCH(1,1,1) model... 58
Figure 5.13 - Histogram of the residuals of the AR(5)-TGARCH(1,1,1) model. ... 59
xii
List of Tables
Table 3.1 - Relevant FA literature. ... 14
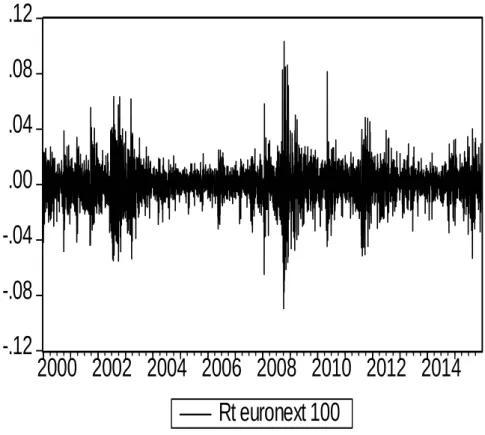
Table 3.2 - Commonly used FA ratios. ... 19
Table 3.3 - Preferred methods of analysis in U.S. ... 19
Table 4.1 - Expected sign of accounting signals ... 35
Table 4.2 - The original F-Score of Piotroski (2000) ... 36
Table 4.3 - The original L-Score of Lev and Thiagarajan (1993) ... 37
Table 4.4 - Adaptation of Lev and Thiagarajan’s (1993) accounting signals ... 38
Table 4.5 - Differences from the original and the adapted L-scores of Lev and Thiagarajan (1993) ... 39
Table 5.1 - Preliminary analysis of the daily returns of Euronext 100. ... 45
Table 5.2 - ADF and KPSS unit root tests for the Euronext 100. ... 46
Table 5.3 - Autocorrelation test BG applied to returns for the Euronext 100. ... 49
Table 5.4 - ARCH-LM test for the Euronext 100. ... 49
Table 5.5 - Residual analysis for the fitted AR(p) model. ... 51
Table 5.6 - Autocorrelation test BG applied to the AR (5). ... 53
Table 5.7 - ARCH Model estimates. ... 54
Table 5.8 - ARCH-LM test for the residuals. ... 54
Table 5.9 - Residual analysis for the AR(5)-GARCH models. ... 57
Table 5.10 - Information criteria. ... 60
Table 6.1 - Sample description ... 61
Table 6.2 - Annual returns, accumulated returns, and total return annualized of the Euronext 100 index. ... 64
Table 6.3 - Descriptive statistics of annual returns of the firms listed on Euronext 100 index for the whole sample period (2000–2014). ... 65
Table 6.4 - Normality test of the annual return of the firms listed on the Euronext 100 index. ... 65
Table 6.5 - Descriptive statistics of the independent variables. ... 66
Table 6.6 - Correlation matrix... 66
xiii
Table 6.8 - Buy-and-hold 12-month returns by F-score. ... 71
Table 6.9 - Buy-and-hold 24-month returns by F-score. ... 72
Table 6.10 - Buy-and-hold 12-month returns by L-score. ... 74
Table 6.11 - Buy-and-hold 24-month returns by L-score. ... 75
Table 6.12 - Buy-and-hold 12-month returns by F-score (New High Score). ... 77
Table 6.13 - Buy-and-hold 24-month returns by F-score (New High Score). ... 78
Table 6.14 - Buy-and-hold 12-month returns by L-score (New High Score). ... 79
xiv
List of Abbreviations
σ Standard deviation
A Total of Assets
ADF Augmented Dicker-Fuller AIC Akaike Information Criteria
AR Auto Regressive
ARCH Autoregressive Conditional Heteroskedasticity
AT Asset Turnover
BG Breusch-Godfrey
BM Book Market
BMR Book-to-Market Ratio
BV Book Value
BVE Book Value of Equity CAPEX Capital Expenditures CAPM Capital Asset Pricing Model CDS Credit Default Swap
CFA Chartered Financial Analyst CFR Cash Flow from Operations COGS Cost of Goods Sold
CR Current Ratio
DCC Dynamic Conditional Correlation DPS Dividends Per Share
DY Dividend Yield
EBIT Earnings Before Interest and Taxes
EBITDA Earnings Before Interest, Taxes, Depreciation and Amortization EGARCH Exponential Generalized Autoregressive Conditional
Heteroskedasticity
EM Earnings Margin
EMH Efficiency Market Hypothesis EPS Earnings Per Share
ET Equity Turnover
FA Fundamental Analysis FIFO First In, First Out
G Growth
GARCH Generalized Autoregressive Conditional Heteroskedasticity GJR-GARCH/
TGARCH
Glosten-Jagannathan-Runkle Generalized Autoregressive Conditional Heteroskedasticity
xv GDP Gross Domestic Product
GGP Growth in Gross Profit
GM Gross Margin
GP Gross Profit
IT Inventory Turnover
J-B Jarque-Bera
K-S Kolmogorov-Smirnova
KPSS Kwiatkowski, Phillips, Schmidt and Shin LIFO Last In, First Out
LR Leverage Ratio
LTD Long Term Debt
MC Market Capitalization
MVE Market Value of the company NAV Net Asset Value
NFO Net Financial Obligations
NI Net Income
NIBD Net Income Before Interest, Taxes and Depreciation
NM Net Margin
NOA Net Operating Assets
OJ Ohlson and Juettner-Nauroth OLS Ordinary Least Square P/E Price to Earnings P/B Price to Book Value PCF Price to Cash Flow
PEAD Post Earnings Announcement Drift
PIIGS Portugal, Italy, Ireland, Greece and Spain
PS Per Share
PTE PreTax Earnings
QMLE Quasi-Maximum Likelihood Estimation ROA Return On Assets
ROE Return On Equity
RT Accounts Receivables Turnover
S-W Shapiro-Wilk
SGAE Selling, General and Administrative Expenses SIC Schwarz Information Criteria
UK United Kingdom
US United States
VIF Variance Inflation Factor XFIN External Financing
1
1. Introduction
The use of fundamental analysis (FA) has been shown to be successful in developed markets (e.g., Ball and Brown 1968; Kothari 2001; Richardson et al. 2010). Yet growing evidence of temporary market mispricing (also known as earnings announcement drift or accounting anomalies; Abarbanell and Bushee 1998; Piotroski 2000, 2005) in such markets suggests the need to examine whether the application of accounting fundamental signals can provide relevant value to investors in an important European markets, namely, the Euronext 100 index. This study accordingly seeks to demonstrate the potential use of accounting fundamental signals to investors in this developed market. According to valuation theory, over time accounting earnings convert into free cash flows that move to investors, creditors, and the firm. These are the main components for estimating the intrinsic value of the firm, as reflected in the stock price. In accounting fundamental analysis, observers examine detailed accounting data from financial statements to improve their understanding of how efficiently and effectively a firm can generate earnings over time, as well as its potential to grow and convert the earnings into free cash flows (Dosamantes 2013).
Generally, a FA entails examining companies’ economic and financial reports (e.g., profit & loss accounts, balance sheets), including both quantitative and qualitative information, to determine its value. Although typically used to evaluate the real value of traded stocks, this method can be carried out by analysts, brokers, and savvy investors (Bentes and Navas 2013). In conducting an FA, investors can use one or both of the following approaches:
i) Top-down: The analyst investigates international and national economic indicators, such as gross domestic product growth rates, energy prices, inflation, and interest rates. The search for the best asset trickles down to the analysis of total sales, price levels, and foreign competition in a particular sector to identify the best company in the sector.
ii) Bottom-up: The analyst starts the search within a specific sector, irrespective of its industry or region.
With the FA, the analyst seeks to predict the company’s future performance, with the recognition that the market price of an asset tends to move toward its intrinsic value. If the intrinsic value of an asset is higher than its market value, it may be time to buy; otherwise, investors should sell.
This study may help such investors use accounting data to construct hedge portfolios in which they can identify possible abnormal returns, which would increase their expected utility. In turn, they might achieve an optimal balance between expected returns and market and country risk. Piotroski (2000) and Lev and Thiagarajan (1993) introduce two key scores: the
F-2
score and the L-score. They should relate positively to one- and two-year future stock returns, such that higher scores increase the likelihood of future market excess returns. To address the possibility of alternative explanations for these scores, including the potential that they instead measure factors that relate consistently to future returns (Kim and Lee 2014; Piotrsoki 2005; Amor-Tapia and Tascón 2016), this study relies on econometric models to show how the scores add value relevance beyond extant factors, such as the book-to-market ratio, firm size, and earnings per share (Dosamantes 2013; Ohlson 1995, 2009).The findings suggest that the F-score provides value-relevant information for investors who form portfolios. A significant relationship arises between the score for one- and two-year stock returns and excess market returns. A sensitivity analysis shows that simple, equally weighted portfolios constructed with high F-score stocks yield consistently positive returns. The L-score instead is significant only two years in the future. These results are robust, as confirmed by combine a pooled ordinary least squares (OLS) approach with a fixed effect model.
During the reporting period there was a strong volatility (2008-2009) which coincides with the financial crisis of 2008/2009 and also with the European sovereign debt crisis. In this context, and in order to better understand the atypical behavior of the market during this period, this thesis also aims to provide a contribute to the analysis of the volatile behavior of financial markets. This assumes special importance as a result of the complexity and uncertainty which currently characterizes the markets.
Bellalah et al. (2016) empirically test the contagion and the transmission mechanism of shocks in volatility between the peripheral Eurozone countries. They employ the sovereign CDS (Credit Default Swap) spreads and the asymmetric model of dynamic conditional correlation GARCH DCC in order to investigate the effects of positive and negative shocks over the long term with a focus in the systemic nature of the crisis in Europe. Results show that changes in the index of sovereign CDS have an extremely noteworthy impact on changes in European stock indexes, especially in the case of Germany, France and the PIIGS (Portugal, Italy, Ireland, Greece and Spain) countries.
Pericoli and Sbracia (2003) defined contagion as the expanding the likelihood of a crisis in a country with the coming of a crisis in another country. This definition expresses that the “infection” may happen amid financial turbulence when there is an increase in the volatility of asset prices and stretches out from one market to another market. For Marais (2003), a concurrent increment in volatility in different markets could arise as a result of ordinary association between these markets or structural changes affecting international markets links. According to Forbes and Rigobon (2002), contagion occurs when cross-border co-movements in asset prices cannot be explained by fundamentals. In this context, contagion
3
can be regarded as critical increment joins between financial markets due to a specific shock to a country or group of countries (Bellalah et al. 2016).In addition to this, it is important for investors to assess the degree of market volatility and how their asymmetric effects have an impact on the value of the shares of a particular company. Thus, the asymmetries in volatility are a topic of particular relevance to our study. Asymmetries have an important role for characterizing price movements, as manifested in the negative correlations that can arise between stock returns and volatility. Large negative shocks tend to be associated with a greater increase in volatility than large positive shocks (Ederington and Guan 2010), a phenomenon for which gasoline markets offer a paradigmatic case: Increasing oil prices trigger jumps in gasoline prices, but oil price decreases of the same amount invoke smaller dips in gasoline prices. Similarly, in financial markets, the impact of bad news (negative shocks) traditionally is greater than the impact of good news (positive shocks), as initially documented by Black (1976) in stock market returns (see also Christie 1982; Engle and Ng 1991; Pagan and Schwert 1990; Sentana 1992). Asymmetries also arise in sophisticated frameworks, such as those derived from Chinese stock markets (Hou 2013; Yeh and Lee 2000), FTSE 100 spot and futures markets (Tao and Green 2012), Jakarta’s Stock Exchange Index IND (Leeves 2007), several European and U.S. stock indices (Ferreira et al. 2007), and the S&P 100 (Liu and Hung 2010) and S&P 500 (Awarti and Corradi 2005). According to an analysis of asymmetric influences of days of the week across five indices (Charles 2010), calendar effects are especially interesting when incorporated in models with good volatility forecasts (Bentes et al. 2013).
The asymmetric impacts of good and bad news might be explained by leverage theory, which asserts that decreased value for a firm’s stock causes that firm’s debt-to-equity ratio (in market value terms) to rise (Black 1976 and Christie 1982). That is, a company’s financial risk causes greater volatility in its stock returns. Alternatively, volatility feedback (or risk premium) theory postulates that return oscillations due to good news create expectations of greater volatility, which increases the required rate of return and thereby lowers prices (Campbell and Hentschel 1992). The increased expected volatility caused by substantial bad news also raises the required rate of returns and lowers stock prices, thus magnifying the negative impact of bad news.
A popular framework also accounts for the temporal dependencies of stock market volatility, using conditional heteroskedasticity models (e.g., autoregressive or ARCH, generalized autoregressive or GARCH), which assume that markets are predictable (Bollerslev 1986). That is, in the original formulation (Engle 1982), current volatility is a function of prior squared residuals, but according to Bollerslev (1986), it also depends on the lagged values of the variance. Although the first generation of ARCH models enforce a symmetric response of volatility to positive and negative shocks and can accommodate volatility clustering—namely,
4
big shocks are followed by big shocks, and small shocks are followed by small shocks—they cannot capture asymmetric velocity, because of the assumption that only the magnitude of the shock, not the sign, affects price oscillations. In addition, the estimated coefficients often violate the parameter constraints, and these constraints may restrict the dynamics of the conditional variance process, which limits the application of both models. To account for asymmetric effects, more flexible specifications allow for different impacts of positive and negative shocks on volatility, such as the exponential GARCH (EGARCH, Nelson 1991), which relies on the non-negativity of conditional variance and constrains it to a logarithmic function to capture asymmetric effects, GJR-GARCH (Glosten et al. 1993) or threshold GARCH (TGARCH, Zakoian 1994), which include extra terms for negative lagged residuals (Bentes etal. 2013).
Considering these extensions, this chapter seeks to examine the temporal dependence of the returns to the Euronext 100, a representative European market, to determine if index returns volatility is asymmetric and, if so, which model describes this asymmetry best. This question is highly relevant because of the likely distinct responses to positive and negative shocks in markets. Accordingly, we apply and compare the most widely used asymmetric conditional heteroskedasticity formulations: EGARCH, GJR/TGARCH, and standard GARCH specifications. In prior empirical research, some studies favor EGARCH models (e.g., Cao and Tsay 1992; Loudon et al. 2000), whereas others assert the superiority of GJR-GARCH/TGARCH specifications (e.g., Brailsford and Faff 1996; Hou 2013; Taylor 2004; Yeh and Lee 2000); some investigations even indicate that EGARCH does not outperform a standard GARCH for forecasting volatility (e.g., Doidge and Wei 1998; Ederington and Guan 2010). To complement and extend this literature, we provide new insights with a three-step empirical analysis, undertaken during a period marked by massive market volatility. First, we estimate an autoregressive model AR(p) for each return series, to remove any serial correlation from the data. Second, to validate this specification, we test for serial correlation in the residuals. Third, we estimate the models, using GARCH (1,1), EGARCH (1,1,1), and TGARCH (1,1,1) specifications.
The next section presents the theoretical background for this study, followed by a literature review of empirical studies. Section 4 presents the research design; Section 5 offers the results of volatility, following the results of fundamental analysis in Section 6. Section 7 concludes by presenting the main conclusions, the contributions and limitations of the studies.
5
2. Theoretical Background
Most research on accounting FA in capital markets uses archival data and econometric models based on multiple regression models, sometimes complemented with time-series analysis for forecasting. The main theoretical background is valuation theory, the efficient market hypothesis (EMH) and followed by volatility.
2.1. Value investing
Valuation is the process of estimating what something is worth. The value of an asset or liability commonly is referred to as its market value, fair value, or intrinsic value. Financial statements prepared in accordance with generally accepted accounting principles report assets based on their historic costs rather than their current market values. Value investing analyses started with the publication of Security Analysis by Graham and Dodd in 1934 (Greenwald et al. 2004). These authors detail investment techniques that promise success, regardless of market cycles. Graham, who also published The Intelligent Investor in 1949, often is credited as the creator of the equity analyst profession and was one of the founders of the Chartered Financial Analyst function. In addition to his academic contributions, Graham also mentored Warren Buffett, who opted for diversified portfolios and focused on quantitative aspects such as the price-to-earnings ratio (P/E) and price-to-book ratio (P/B) early in his career. Yet over time, and under the influence of another Berkshire Hathaway partner, Buffett also started noting qualitative aspects (e.g., competitive advantages, sustainability), thus expanding the original investment strategy proposed by Graham (Holloway et al. 2013).
The value investing strategy offered by Graham and Dodd is based on three key characteristics of financial markets:
1) The prices of financial stocks are subject to significant, “capricious” movements. The market shows up every day to buy or sell any financial asset.
2) Fundamental economic values are relatively stable and can be measured with reasonable accuracy by a diligent, disciplined investor. The intrinsic value of a security is one thing; the current price at which it is trading is something else. Although the intrinsic value and market prices may be identical on any given day, they often diverge.
3) A strategy of buying stocks only when their market prices are significantly below the calculated intrinsic value will produce superior returns in the long run. Graham referred to
6
the gap between value and price as “the margin of safety”; ideally, the gap should amount to about half, but not less than one-third, of the fundamental value. He sought to buy a dollar for 50 cents; the eventual gain would be large and, more important, secure.Starting with these assumptions, the central process of value investing is simple: A value investor estimates the fundamental value of a financial security and compares that value to the current price that the market is offering. If price is lower than the value by a sufficient margin of safety, the value investor buys the security. That is,
1) Select stocks for valuation.
2) Estimate their fundamental values.
3) Calculate the appropriate margin of safety required for each security.
4) Decide how much of each security to buy, then construct a portfolio and choose a certain level of desired diversification.
5) Decide when to sell stocks.
To estimate value, value investors also rely on a three-phase process:
1) Search to locate potentially rich areas where value investments may locate.
2) Take a valuation approach that is powerful and flexible enough to recognize value in different guises, while still protecting the investor from deluded expectations.
3) Construct an investment portfolio that reduces risk and provides a check on individual security selections.
For Greenwald et al. (2004), value investing is an intellectual discipline, but the qualities essential for success in this task may be less mental than temperamental. In particular, a value investor must be aware of the limits of his or her personal competence and be able to distinguish genuine understanding from general competence. Most value investors are specialists in particular industries or certain circumstances, such as bankruptcy workouts. Not every stock that looks like a bargain is worth more than its price. A value investor must be able to identify the difference between an underpriced asset and a cheap price. Even the most experienced investor performs best when operating within his or her circle of competence. Furthermore, value investing demands patience, to wait for the market to offer a bargain, and then, after stocks are purchase, wait for the rest of the market to come around.
7
Valuation theory defines that the value of the firm is the present value of the future free cash flows that the firm can generate. To estimate these cash flows, it is necessary to estimate future earnings. To estimate future earnings, the analyst needs to examine present and past financial statements, which form the basis for calculating earnings. The assumption is that earnings, sooner or later, transform into free cash flow to investors, in the form of dividends (Dosamantes 2013; Piotroski 2000; Bartov and Kim 2004). Still, value investors have been improving the technique, and several other elements were included in the criteria for selection of assets (Holloway et al. 2013).2.2. Efficient market hypothesis (EMH)
An investment strategy that solely seeks to "beat the market" is doomed to failure; in an efficient stock market, stock prices incorporate and reflect all relevant information. According to the EMH, stocks always trade at their fair value on stock exchanges, so investors cannot purchase undervalued or sell overvalued stocks. It thus should be impossible to outperform the overall market, regardless of expert stock selection or market timing, and the only way an investor might obtain higher returns would be to purchase riskier investments. Ultimately, the EMH suggests that developed capital markets incorporate all available public and private information about the present and past operational performance of the firm into its stock price.
The EMH also is closely linked to the random-walk model and Martingale model. The random character of stocks market prices was first modeled by Jules Regnault, a French broker, in 1863 and then by Louis Bachelier, a French mathematician, in his 1900 PhD thesis, The Theory of Speculation (Kirman, 1992). His work was largely ignored until the 1950s; however, in the early 1930s, several works corroborated his thesis. In particular, Working (1934), Cowles and Jones (1937), and Kendall and Hill (1953) proved for U.S. stock prices and related financial series followed a random walk model. Then the EMH emerged as a prominent theory in the mid-1960s. Paul Samuelson began circulating Bachelier's work among economists. In 1964, Bachelier's dissertation was collected with the resulting empirical studies in an anthology. In 1965, Eugene Fama published his dissertation, arguing for the random walk hypothesis, and Samuelson published a proof of a version of the EMH. Fama (1970) also reviewed both the theory and the evidence for the EMH.
Based on utility-maximizing agents, the EMH requires agents to accept the rational expectations that, on average, the population is correct (even if one person is not), and when new, relevant information appears, they should update their expectations. Agents do not have to be rational though; the EMH acknowledges that when faced with new information, some investors overreact and others underreact. Therefore, the EMH assumes that investors'
8
reactions are random and follow a normal distribution pattern, so that the net effect on market prices cannot be exploited reliably to make an abnormal profit, especially with transaction costs (e.g., commissions, spreads). Thus, each person can be “wrong” about the market, but the market as a whole is always “right” (Fama 1998).Furthermore, the EMH appears in three main versions. In the weak version, prices of traded assets already reflect all publicly available information. In the semi-strong form, prices reflect all publicly available information and change instantly to reflect new public information. The strong form of the EMH also claims that prices instantly reflect even hidden or "insider" information. Another view of the EMH indicates that the stock market is “micro efficient” but not “macro inefficient” (Samuelson 1947), such that the EMH may be better suited for individual stocks than for an aggregate stock market. Research based on regression and scatter diagrams supports this view too (e.g., Jung and Shiller 2005). No one can consistently achieve returns in excess of average market returns on a risk-adjusted basis, given the information available at the time the investment is made. Timmermann and Granger (2004) argue that stable forecasting patterns thus are unlikely to persist for long periods of time and will self-destruct when discovered by many investors. For example, Grossman and Stiglitz (1980) observe that security prices first need to be efficient, which requires capital market participants to trade actively with useful information that drives the security prices toward their "true" level. In this sense, the capital market is adaptive in its efficiency: What was once mispriced becomes correctly priced.
A firm's stock price theoretically reflects both supply and demand sides of the market, usually regarded as investors' views of corporate valuation. If the capital market is efficient in reflecting all available information, nobody can outperform it in assessing a firm's value. However, information collection is costly, so some groups of people may value the firm better than the market (Laih et al. 2015). Khan (1986) finds that, following the release of large trader position information, a futures market reports semi-strong efficiency. In European indexes, Borges (2010) reports results in line with the weak EMH between January 1993 and December 2007, thereby concluding that daily and weekly returns are not normally distributed, because they are negatively skewed, are leptokurtic, and display conditional heteroscedasticity. With mixed evidence across nations, Borges rejects the EMH when considering daily data from Portugal and Greece, due to the first-order positive autocorrelation in the returns, yet also provides empirical tests that show that these two countries approached Martingale behavior after 2003. The French and U.K. data also reject EMH, but in these cases due to the presence of mean reversion in weekly data. The tests for Germany and Spain do not reject of EMH, and the latter market was the most efficient. With a different approach, Himmelmann et al. (2012) examine underreactions and overreactions in the EuroStoxx 50 Index according to the abnormal returns of those stocks in subsequent price increases and decreases. Large price increases and decreases tend to be
9
followed by average market returns, in support of the EMH. In an examination of the fundamental determinants of stock prices in India, Srinivasan (2012) uses annual time-series data for six key sectors during 2006–2011 and concludes that the market is largely efficient. Yet the EMH does not consistently hold in less developed markets, compared with more developed markets (Aggarwal and Gupta 2009; Richardson et al. 2010; Sloan 1996; Xie 2001). The more developed a capital market, the closer it comes to market efficiency, according to most researchers. Therefore, in developed markets, prices likely incorporate all available information efficiently into stock prices. Yet a lack of market efficiency might arise when investors do not incorporate all the information disclosed in financial statements; as Abarbanell and Bushee (1997, 1998) indicate, even sophisticated analysts systematically underestimate accounting signals in their earnings forecast, so stock prices often are temporarily underestimated.Some research spurred by a lack of support for the EMH relies on accounting FA in capital markets, which leverages information in current and historical financial statements, together with industry and macroeconomic information, to estimate a firm’s intrinsic value (Kothari 2001). In addition, FA may work better in emerging or less developed markets; Dosamantes (2013) argues that valuation theory and FA are more valuable and relevant for identifying temporary mispriced stocks than the EMH. Accordingly, FA might produce better results in less efficient markets than in developed markets.
These questions about the validity of the EMH are relevant for investment strategies, and thus for academicians, investors, and regulatory authorities. In particular, EMH is widely accepted as a theory that predicts market movements, but de Sousa and Howden (2015) find that some other, constant impacts clearly challenge the EMH (e.g., January impact; Rozeff and Kinny 1976; Reinganum 1983). Academicians thus seek to understand the behavior of stock prices and standard risk-return models, such as the capital asset pricing model (CAPM), which depends on the hypotheses of normality or random walk behavior of returns. Jegadeesh (1990) offers proof of consistency in individual stock returns, but perhaps the most well-known inconsistency is the size impact. In the long run, equities of smaller companies persistently generate higher returns than those of larger companies (Keim 1983; Fama and French 1993). The preferred solution suggests that beta is not the best proxy for risk and that size can add some predictability to returns. If the problem is a lack of independent variables in the CAPM, a three-factor asset-pricing model might offer an appropriate benchmark for measuring anomalies (Fama and French 1993). Such multi-factor models can improve predictive power and do not contest the EMH but instead define “predictability” according to the factors being studied. Prices still follow a random walk.
For investors, trading strategies have to be designed to account for whether future returns can be predicted according to their past behavior or not, as in the case of the weak form
10
EMH. If a stock market is not efficient, the pricing mechanism also cannot ensure the efficient allocation of capital in an economy, which would have negative effects for the overall economy, such that regulatory authorities may need to undertake reforms (Borges 2010).Two factors thus motivate the current study. First, different studies reveal contradictory evidence regarding the EMH for the same countries and same time periods, suggesting the need for replications. Second, market efficiency seemingly develops over time, so constant updates to previous studies are necessary, using more recent data and emerging, powerful techniques, such as those based on joint variance ratio tests. Most research on FA in capital markets instead uses valuation theory and EMH as its main theoretical perspectives (Dosamantes 2013).
2.3. Volatility
The volatility of financial markets is particularly relevant in the modern era, considering its effects on the daily lives of companies and individuals. According to Bollerslev et al. (1992: 46): “Volatility is a key variable which permeates most financial instruments and plays a central role in many areas of finance.” Since Markowitz (1959) introduced the concept, it has remained a relevant variable, especially in decision-making processes involving financial variables. Such decision making becomes especially evident in times of crisis, such as the 2008 global financial crisis (e.g., Soros 2009). Furthermore, instability is increasing in financial markets may be due to several causes. For example, people experience high levels of risk and uncertainty, and markets are increasingly complex, filled with sophisticated products that have emerged from the derivatives market. Added to these developments, globalization trends extend the range of possible fluctuations of prices in a given market to more financial markets, according to their degree of integration. Therefore, it becomes necessary to analyze and model the volatility of returns on financial assets traded in the stock markets, to give investors the tools they need to make appropriate decisions. The role of information is particularly important in this process, in that it provides decision makers essential knowledge about market behavior (Bentes 2011).
Recognizing the importance of these arguments, several authors have developed models to try to describe the main characteristics of the volatility of financial assets, extensively documented in the literature and methodology. It is in this context that the ARCH (q) model appears and it is proposed by Engle (1982), which attempts to model the conditional heteroskedasticity evidenced by the returns of financial assets. It is worth to refer that the author mentioned above would, along with Clive Granger to be awarded the Nobel Prize in Economics in 2003 for his work at the time was pioneering. Roughly speaking, this model
11
assumes the existence of time-dependent behavior of volatility, considered to the effect that the conditional variance is not constant. It was particularly useful in modeling the so-called volatility clustering and fat tails and the empirical distribution of the returns of financial assets.Bollerslev (1986) and Taylor (1986) developed independently an extension of the ARCH model, commonly known as GARCH (p,q). Their main advantages reside, on the one hand, in the fact that it is more parsimonious than the previous one and, secondly, the admission that the conditional variance function was not only the square of past residuals but also its own historical values. Given the acceptance that this model has achieved, numerous variants have been proposed in order to contemplate the various phenomena associated with to behavior of volatility, some of them might be seen in more detail in section 4.
12
3. Literature Review: Empirical Studies
3.1. Fundamental analysis (FA)
When investors seek to determine which stocks to buy/sell at which price, they might conduct a fundamental analysis or a technical analysis. The former postulates that stock markets misprice an asset in the short run but not in the long run, when the "correct" price will emerge. Because there is a long-term equilibrium for every stock price, investors can earn profits by trading the mispriced asset in the short term and then waiting for the market to recognize its "mistake" and re-price. The latter instead assumes that all information already is reflected in the stock price, so trends will benefit the investor, and sentiment changes can predict trend changes. Investors’ emotional responses to price movements thus lead to recognizable price chart patterns. Price predictions based on a technical analysis are extrapolations from historical price patterns. Investors also might combine these two approaches; for example, many fundamental investors use technical analyses to determine their entry and exit points, and some technical investors use FA to restrict their portfolios to “good and financially healthy companies” (Menezes 2010). The choice of which approach to apply also depends on the investor's belief in different paradigms regarding the functioning of the stock market.
The FA relies on financial reports, which provide fundamental data for calculating financial ratios. Each ratio provides an evaluation of different aspects of a firm’s financial performance (Silva 2009). Penman (2009) defines FA as the analysis of information that focuses on valuation and Kothari (2001) considers its use a powerful means to identify mispriced stocks relative to their intrinsic value. Richardson et al. (2010) highlight the research overlap between FA and accounting anomalies and note that recent FA research tends to focus on forecasting earnings, stock returns, or the firm’s cost of capital. In addition, FA evaluates firms’ investment worthiness by looking at their business at a basic financial level (Thomsett 1998), such as its sales, earnings, growth potential, assets, debt, management, products, and competition. This strategy also might entail analyzing market behavior that encapsulates underlying supply and demand factors (Doyle et al. 2003; Piotroski 2000). The goal is to gain a better ability to predict future security price movements, then apply those improved predictions to the design of equity portfolios (Edirisinghe and Zhang 2007).
According to Bentes and Navas (2013), FA is mainly used by shareholders, including Warren Buffett, perhaps the most famous investor in the world, who repeatedly carries out this strategy and acts contrary to many commonly used Wall Street investment strategies. By exploiting bear markets and down stocks, he became the second richest person in the world, according to Forbes. The success of this strategy stems from five of its benefits:
13
1) It allows investors to identify companies with durable or long-term competitive advantages.2) It is easy to implement.
3) It is a structured, consistent process, performed on the basis of the available financial reports.
4) It can select potential stocks to acquire and thus facilitate the creation of an investment portfolio.
5) It can estimate the intrinsic value of the stocks. Stock markets are not perfectly efficient, so there is always an opportunity to find undervalued stocks (Matos 2009a, b). Investors also can use FA with different portfolio management styles (Bentes and Navas 2013). For example, buy-and-hold investors believe that identifying good businesses allows them to hold assets that will grow with the company. Using the FA, they can find “good” companies, lower their risk, and mitigate the chance of failure. Managers also might use the FA to identify companies with high future growth rates or to evaluate “good” and “bad” companies, with the assumption that “bad” companies' stock prices will move up and down more than those of “good” companies. The increasing stock price volatility then would create profit opportunities. Using the economic cycle, managers also can determine the “right” time to buy or to sell. Furthermore, the FA allows investors to make their own assessment of the company’s value and ignore the market in the short run. For value investors, the FA helps them restrict their attention to undervalued companies.
Noting these benefits, various studies investigate FA, as summarized in Table 3.1. Overall, empirical literature indicates that accounting fundamental signals successfully predict future earnings and future stock returns. The fundamental signals also have the potential to identify temporary abnormal returns, especially right after earnings are announced and in some cases up to a year after the announcement or disclosure (Dosamantes 2013).
14
Table 3.1 - Relevant FA literature.
Paper Theoretical Perspective Dependent
Variable(s) Independent Variable(s) Country/ Market Main Findings Abarbanell and Bushee (1998)
Valuation theory: Fundamental analysis should yield abnormal returns, because earnings are realized in the future if contemporaneous stock price reactions to the signals are incomplete
Future abnormal return
Contemporaneous earnings change, Beta and accounting fundamentals
US An average 12-month cumulative size-adjusted abnormal return of 13.2% is earned according to a fundamental strategy based on Lev and Thiajaran. A significant portion of the abnormal returns is generated around subsequent earnings announcements.
Aggarwal and Gupta (2009)
Follows Piotroski (2000) Future returns Accounting fundamentals, BM ratio, size, accruals
India The Piotroski strategy can separate winners from losers for two-year returns after portfolio formation. It generates 98.6% annual return for portfolios with high F-scores and 31.3% annual return for portfolios with low F-scores.
Al-Shubiri (2011)
Valuation theory and fundamental analysis
Share prices Accounting fundamentals
Jordan (banks)
Positive significant relationship between market price of stock and net asset value per share (NAV), EPS and dividend percentage.
Amidu and Abor (2006)
Valuation theory and fundamental analysis
Stock returns and earnings
Dividends Ghana A key relationship between dividend and earning might directly influence that movement of share prices.
Bagella et al.
(2005) Fundamental analysis Stock price P/E and CAPM US & Europe An unique model that joins P/E and CAPM in a single formula. Dehuan and Jin
(2008)
Valuation theory and fundamental analysis
Stock returns Accounting fundamentals
China ROE, EPS, profit margin, ROA, changes in sales, and total asset turnover.
Dosamantes (2013)
Valuation theory, fundamental analysis and market under-reaction of high BM ratio firms
Future returns, earnings response coefficient and future earnings growth Accounting fundamentals, BM ratio, size, accruals
Mexico Mean return earned by a high book-to-market investor can be increased through selection of financially strong high BM firms.
Drake et al.
(2011) Analysts tend to recommend stocks with high growth, high accruals, and low book-to-market ratios, despite these variables having a negative association with future returns
Stock returns 11 independent variables from accounting fundamentals
US Short interest is significantly associated in the expected direction with all 11 variables examined. There are abnormal returns from a zero-investment strategy that shorts firms with highly favorable analyst recommendations but high short interest and buys firms with highly unfavorable analyst
recommendations but low short interest. Elleuch and
Trabelsi (2009)
Valuation theory: Firm’s fundamental or intrinsic value is
Future returns Accounting fundamentals and
Tunisia Fundamental accounting signals can be used to discriminate from an overall sample generated over a
15
correctly determined by
information reflected in financial statements. Sometimes, stock prices do not reflect all
information in a timely manner or correctly, so they deviate from fundamental values
accruals 15-month holding period, with negative returns of –
11.6%, a winner portfolio generating positive return of 1.9% from a loser one generating negative return of –22.9% over the same holding period.
Holloway et al. (2013)
Valuation theory and fundamental analysis
Future returns Accounting fundamentals and size
Brazil 11 accounting ratios plus 3 sizes: DY, σ EPS, GGP, Debt/ A, ROA, ROE, GM, EBITDA margin, NM, SGAE/GP, Depreciation/GP, A, Dummy for
participation in Bovespa Index, Dummy for financial sector.
Karathanassis and Philippas (1988)
Valuation theory: Fundamental
analysis Share prices Accounting fundamentals Greece (banks) Dividends, retained earnings and size has showed a significant positive influence on share prices. Lev and
Thiagarajan (1993)
Valuation theory and fundamental
analysis Earnings response coefficient and future earnings growth
12 accounting signals, earnings per share
US More than earnings, the 12 fundamental signals proposed add approximately 70%, on average to the explanatory power of earnings with respect to excess returns.
Lev et al.
(2010) Valuation theory: When there is quality in financial information, and it is not compromised, it should be reflected by the
prediction of enterprise cash flows and earnings
Future cash flows and future earnings
Accounting
fundamentals US Accounting estimates beyond those in working capital items (excluding inventory) do not improve the prediction of cash flows. Estimates improve the prediction of the next year’s earnings, though not of subsequent years’ earnings.
Midani (1991) Fundamental analysis Share prices Accounting
fundamentals Kuwait (industrial services & food)
In a sample of 19 Kuwaiti companies, EPS is a determinant of share prices.
Nisa (2011) Valuation theory: Fundamental analysis and micro economy
Share prices Share prices and economics data
Pakistan P/E Ratio, Net Profit after Tax, Inflation, DPS, GDP and Annual Turnover as stock price determinant. Piotroski (2000) Valuation theory and market
under-reaction of high BM ratio firms: Markets do not incorporate historical financial information into prices in a timely manner
Future returns Accounting fundamentals, BM ratio, size, accruals
US Mean return earned by a high book-to-market investor can be increased by at least 7.5% annually through selection of financially strong high BM firms. Richardson et
al. (2010)
Literature review on accounting anomalies and fundamental analysis
Future earnings and future stock returns
Accounting information
Mainly US Accounting anomaly and FA literature demonstrate the usefulness of accounting information in forecasting future earnings and stock returns. Anomalous return patterns are commonly
16
concentrated in a subset of small and less liquid firms with high risk.
Shen and Lin (2010)
Valuation theory: Fundamental analysis
Stock returns Accounting fundamentals, EPS and a vector of the corporate
governance
Taiwan market
Corporate governance affects the impact of the relationship between fundamental signals and stock returns. The study employs an endogenous switching model, which combines the response equation and governance index equation simultaneously. Somoye et al.
(2009)
Fundamental analysis Share prices Dividends per share and EPS
Nigeria Dividend per share and earnings per share as determinants of share prices.
Sunde and Sanderson (2009)
Fundamental analysis, macro and micro economy
Share prices Accounting fundamentals, economy data
Zimbabwe Corporate earnings, management, lawsuits, mergers and takeovers, market liquidity and stability, availability of substitutes, Government policy, macroeconomic fundamentals, investor sentiments, technical influences and analyst reports as factors influencing share prices.
Tsoukalas and Sil (1999)
Dividends Future returns Dividends ratios United
Kingdom
Based on dividend/price ratio and dividend growth on the share prices. The dividend/price ratio predicts real stock returns for the UK stock market, and there was a strong relationship between real stock returns and dividend yields.
Walkshäusl (2015)
Valuation theory and market underreaction of high BM ratio firms. Future returns, earnings response coefficient and future earnings growth Accounting fundamentals, BM ratio, size, accruals
Europe As in the US, European value-growth returns strongly depend on the valuation signals contained in the firm’s equity financing activities. The high returns of value firms are due to value purchasers; the low returns of growth firms are due to growth issuers. Notes: US = United States; UK = United Kingdom; FA = Fundamental analysis; BM = book-to-market ratio; P/E = price-to-earnings ratio; CAPM = capital asset pricing model; DY = dividend yield; σ (EPS) = standard deviation of earnings per share; GGP = growth in gross profit; A = total assets; ROE = return on equity; ROA = return on assets; GM = gross margin; EBITDA = earnings before interest, taxes, depreciation, and amortization; NM = net margin; SGAE = selling, general and administrative expenses; GP = gross profit; DPS = dividends per share; GDP = gross domestic product.
17
In particular, considerable research in U.S. markets offers strong empirical evidence of the value relevance of FA for explaining future market returns (e.g., Lev and Thiagarajan 1993; Abarbanell and Bushee 1998; Piotroski 2000; Bagella et al. 2005; Lev et al. 2010; Richardsonet al. 2010; Drake et al. 2011). Research in European markets is comparatively scarce, though
some notable exceptions offer insights. For example, Bagella et al. (2005) predict that a large group of investors follows a fundamental approach to stock picking, so they build discounted cash flow models that they test with a sample of high-tech stocks to determine if strong and weak versions receive support from U.S. and European stock market data. Their empirical results show that fundamental earning price ratios explain significant cross-sectional variation in the observed P/E ratios, and other variables are only partially, weakly relevant. Their results also indicate significant differences between the European and U.S. markets, such that the relationship between observed and fundamental P/E ratios is much weaker in Europe.
Walkshäusl (2015) extends a U.S. study by Bali et al. (2010) to European stock markets. The European value growth returns are similarly strongly dependent on the valuation signals contained in a firm’s equity financing activities. The high returns of value firms come from value purchasers; the low returns of growth firms are due to growth issuers. Among value issuers and growth purchasers, no value premium exists. The large return difference between value purchasers and growth issuers cannot be explained by common risk factors. However, with Piotroski and So’s (2012) market expectation errors approach, these authors conclude that the observed value growth returns can be attributed to mispricing.
Oberlechner (2001) conducts a survey regarding the perceived importance of technical analysis and FA among foreign exchange traders and financial journalists in Frankfurt, London, Vienna, and Zurich. Most of the traders use both forecasting approaches; the shorter the forecasting horizon, the more important they consider a technical analysis. Financial journalists put more emphasis on FA than the traders. Furthermore, the importance of technical analysis appears to have increased over the previous decade. This study identifies four distinct clusters of traders, with unique forecasting styles, who vary in the overall importance they attach to fundamental versus technical analysis across different trading locations.
Furthermore, firms with low market-to-book ratios (BM) generate systematically lower future stock returns, and Dechow et al. (2010) document how short-sellers position themselves in the stock of such firms, then cover their positions as the ratios revert to the mean. Short-sellers refine their trading strategies to minimize transaction costs and maximize investment returns. This evidence is consistent with the idea that short-sellers deploy information about ratios to take positions in stocks with lower than expected future returns.