Abstract
The applicability of probability models to time series representing minimum and maximum daily flow rates were tested for Itabapoana River in Brazil. The series represents data from 1968 to 2007, 40 year period. The distribution adequacy was verified using Kolmogorov-Smirnov and chi-square tests. For maximum flow rates, the statistical distribution best fitted were 2 and 3 parameters log-normal. For minimum flow rates, the best fitting were obtained through Weibull and Gama functions. Using these fittings, the maximum and minimum flow rates could be estimated with high confidence for Itabapoana river.
Key-words: Probability models. Flow. Specific flow rate indexes.
Introduction
High water needs by world population has required larger exploitation of rivers causing demand conflicts and environmental impacts due to water availability shortage. Such pressure on water resources imposes higher needs for accuracy estimating flow rates. On the other hand, flooding has caused economical damages due to irregular occupancy of river beds. In this case, correct flood level estimation is necessary.
Besides that the maximum flow of a river which is understood as the value associated with a risk of being equaled or exceeded in use in flood forecasting and design hydraulic structures such as culverts, channels, conduits, among others. Thus, knowledge of the maximum flow is needed to control and mitigate flooding in a given area or basin in hydraulic works and rural urban drainage in irrigation schemes, dams and spillways of dams, among others.
The estimation of this value is of decisive importance in the cost and safety of engineering projects, to be the result of precipitation occurring or likely to occur (TUCCI, 2001).
According Silvino et al. (2007), the water, due to its scarcity in quantity and quality, is no longer a free resource and economic value gained from the law of the National Water Resources Policy (Law No. 9433) of 8 January 1997. Due to this reason, design of water structures to supply water, irrigate, generate electricity and others, has demanded very precise estimates of maximum and minimum flow rates in order to reduce costs of constructions.
Tucci (1997) proposes that high flow rates, at short or long terms, can be estimated through probability models, based on risk analysis. The short term flow rate estimate is based on present precipitation values. According to Euclydes (2002), maximum flow rate estimates can be associated to recurrence and it is very important to predict flooding levels, being very important for adoption of structural constructions to control or attenuate flooding effects.
The minimum flow rate is characterized by two factors: its magnitude and duration. At practice, the instantaneous minimum values are not that important since it approaches the minimum daily value. Minimum values of flow rate with larger duration are, however, more important to be determined, since it can represent an unfavorable situation for water use or environmental preservation (TUCCI, 2002).
When flow rate time series are available, it is necessary to work them out adequately through probabilistic analysis and stochastic studies (HAAN, 2002; DOUGLAS; VOGEL, 2006).
105
PROBABILISTIC MODELS FOR
ESTIMATION EXTREME VALUES
OF WATERSHED FLOW RATES
1
Leandro Campos Pinto
2
Pedro Terra Lima
3
João José da S. Junior
1
Universidade Federal de Lavras - Engenheiro Agrícola, Doutorando em Ciência do Solo, DCS - UFLA/Lavras-MG. [email protected]
2
Universidade Federal de Lavras - Engenheiro Agrícola, Doutorando em Ciência do Solo, DCS - UFLA/Lavras-MG. [email protected]
3
Universidade Federal de Lavras - Engenheiro Agrônomo, Professor substituto departamento de Engenharia Agrícola, Doutorando em Recursos Hídricos em Sistemas Agrícolas - UFLA/Lavras-MG. Bolsista da Fapemig. [email protected]
Maione (1977) applied Gumbel probabilistic models, as well as Log-normal (two and three parameters), Fuller-Coutagne and Pearson with two and three parameters, at high flow rate time series at Dora Baltea river in Italy and demonstrate that the Log-Normal with two parameters provided the best fitting. (EUCLYDES: PICOLLO, 1985) applied these same models at a watershed at Water Circuitry Region of Minas Gerais state in Brazil and observed that values predicted by Gumbel and Log-Normal two parameters were very close.
Kaviski (1983) applied probabilistic models at minimum flow rates at small watersheds at Santa Catarina state in Brazil and concluded that the Weibull distribution was the most precise for estimating values.
Based on the diversity of probabilistic models for flow rate studies (maximum and minimum values), as well as the need for accuracy on water structures design, this research decided to investigate the time series analysis for Itabapoana river in Brazil.
Methodology
Watershed
2
Itabapoana watershed (Figure 1) is 4875 km large. The river is 264 km long, starting at Caparaó ranges between Espirito Santo and Rio de Janeiro state, discharging its water at Atlantic Ocean. This river is important due to its hydro-eletric potential with several waterfalls along it. Its tributaries are Preto and São João rivers. Then it collects water from Muqui do Sul, Guaçui, Calçado and other small rivers. According to Reis et al. (2008), the main activities at Itabapoana watershed are services at primary sector, mainly those linked to pasture, coffee, sugarcane and tropical fruit growth.
Figura 1: Itabapoana Watershed location at Brazilian territory.
Daily flow rates were obtained at Hidroweb, a Brazilian water information database, managed by ANA – National Water Agency. The flow rate station is based at Itabapoana bridge, at coordinates 21º 12' 22” S e 41º
2
27' 46” W, 40 m altitude and draining area of 2854 km . The time series investigated has maximum and minimum flow rates from 1968 to 2007, for 40 years long.
Probability distribution functions and adherence tests
We used the Gumbel probability distributions, which is applied to the time series of extreme values. According to Tucci (2002), its Probability Density Function can be obtained from equation (1), Log-normal on 2 and 3 parameters given by equations (4) and (8) and the range equation (16) to estimate the maximum flows and the same distributions plus the Weibull distribution equation (13) to estimate the minimum flows for various return periods. The distributions were adjusted based on the method of moments (NAGHETTINI: PINTO, 2007).
To assess the adequacy statistical distributions for all periods studied, we used the Kolmogorov-Smirnov (KS) equation (21) and Chi-square (λ ²) equation (22) at 5% significance level, following guidelines Ferreira (2005) and Naghettini e Pinto (2007). These tests were chosen because they are the most commonly used in the literature and considered as the most appropriate for continuous random variables such as flow rates (SILVINO et al., 2007).
In the test of KS comparison is made between the maximum deviation in magnitude due to the difference between the values observed and theoretical frequency, with the tabulated value based on the sample size and level of significance. In the test of λ ² comparison is made between the sum of squared deviations between the observed frequencies and theoretical (λ ² calculated) and the value in the table (λ ² tabulated), depending on the number of degrees of freedom (number of classes - number of parameters - 1) and level of significance. Obtained the number of classes grouping the square root of the number of data. For the model to probabilities is deemed appropriate, the calculated values should be equal to or less than tabulated for each test.
Gumbel probability distribution
Gumbel, in 1945, suggested that this distribution of extreme values would be appropriate for frequency analysis of flooding, since the series was annual, that is, each flow rate range of the extreme values were the highest throughput of a sample of 365 possibilities ( higher flow year).
The distribution also known as Gumbel extreme value distribution of type I or type II distribution Fisher-Tippet, according to Gumbel (1958), has the function of cumulative probabilities given by equation 1.
107
109
Results and discussion
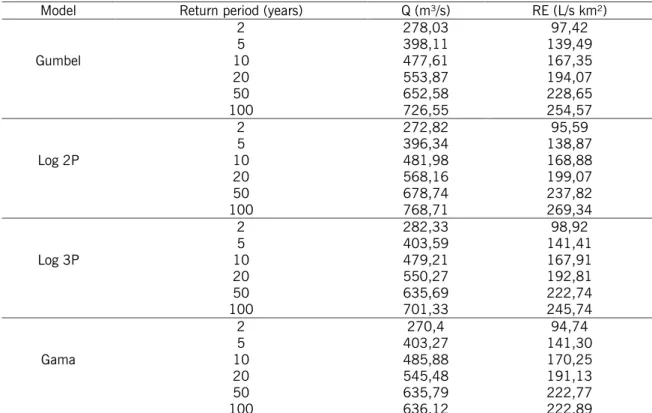
Table 1 – Maximum flow rates (Q) and maximum specific flow rate indexes (RE) for different periods of return at Itabapoana
flow rate station.
Table 2 – Adherence test results for probability functions used to estimate the maximum flow rates.
Model Returnperiod (years) Q (m³/s) RE (L/s km²)
2 278,03 97,42 5 398,11 139,49 Gumbel 10 477,61 167,35 20 553,87 194,07 50 652,58 228,65 100 726,55 254,57 2 272,82 95,59 5 396,34 138,87 Log 2P 10 481,98 168,88 20 568,16 199,07 50 678,74 237,82 100 768,71 269,34 2 282,33 98,92 5 403,59 141,41 Log 3P 10 479,21 167,91 20 550,27 192,81 50 635,69 222,74 100 701,33 245,74 2 270,4 94,74 5 403,27 141,30 Gama 10 485,88 170,25 20 545,48 191,13 50 635,79 222,77 100 636,12 222,89 110
Conclusions
- Investigation of best fitting models to estimate flow rate extreme values is very important to gain safety for water structure design as well as management of watersheds.
- The Log-normal 2 parameters represented highest security on estimating flow values for periods of return larger than 10 years.
- Gumbel and Gama probability functions were adequate to fit the maximum daily flow rates. Log-normal 2 parameters presented, however, the best fitting according to Kolmogorov-Smirnov tests. Log-normal 3 parameters best fitted the values according to Chi-square test.
- Gumbel and Log-normal 2 and 3 parameters were adequate to fit the minimum daily values. Weibul function generated best fitting based on Kolmogorov-Smirnov test, while Gama function was the best according to chi-square test.
Modelos de probabilidade na determinação de vazões de
extremos
Resumo
Analisou-se, neste trabalho, a aplicação de modelos de probabilidade às séries históricas de vazões máximas e mínimas diárias anuais para diversos períodos de retorno no rio Itabapoana, localizado entre a divisa 111
Table 3
dos estados do Espírito Santo e Rio de Janeiro. A série histórica compreende as vazões máximas e mínimas anuais entre 1968 e 2007 resultando em 40 anos de dados. Na verificação da adequação das distribuições, foram utilizados os testes de Kolmogorov-Smirnov e Qui-quadrado. Observou-se que, para as vazões máximas, as distribuições que obtiveram maior aderência foram a Log-normal 2e 3 parâmetros e para as vazões mínimas, as distribuições Weibull e Gama. Com isto,puderam-se estimar com maior grau de confiabilidade, as vazões máximas e mínimas para o rio Itabapoana.
Palavras-chave: Modelos de probabilidade. Vazão. Índices de vazão específica
Literature
ANA (Agência Nacional das Águas). Sistema Nacional de Informações hidrológicas. Disponível em:< http://www.ana.gov.br/> Acesso em: abr. 2011.
CLARKE, R. T. Hidrologia Estatística. in Hidrologia Ciência e Aplicação. Porto Alegre: Editora da UFRGS. 1993. P. 659 - 698.
DOUGLAS, E. M.; VOGEL, R. M. Probabilistic behavior of floods of record in the United States. Journal of Hydrologic Engineering, Reston, v.11, n.5, p.482-488, 2006.
EUCLYDES, H.P. Regionalização de vazão máxima, mínima e média de longo período e da curva de permanência para a bacia do Alto Médio São Francisco, In: Tecnologia para elaboração de projetos hidroagrícolas em bacias. Viçosa: FV/RURALMINAS, 2002 p. 1-142. (Boletim Técnico, n.6)
EUCLYDES, H. P.; PICCOLO, M.J. Aplicação de um critério de semelhança hidrológica pela distribuição de probabilidade de vazão de pico de cheia da Microregião do Circuito das Águas - Sul de Minas Gerais. 1985. (Monografia). Istituto di Idraulica e Construzioni Idrauliche del Politecnico di Milano, Itália.
FERREIRA, D. F. Estatística básica. Lavras: UFLA, 2005. 654 p.
KAVISKI, E. Vazões de estiagens em pequenas bacias hidrográficas do estado de Santa Catarina. In: Simpósio Brasileiro de Hidrologia e Recursos Hídricos, 5, 1983. Florianópolis. Anais... Florianópolis: ABRH, 1983, p.43-67.
HAAN, C. T. Statistical methods in hydrology. 2 ed. Ames: The Iowa State University, 2002. 377p. MAIONE, U. Apointidiidrologia – Le pienefluviali. Pavia, La Goliardica Pavese. 1977, 224p.
MELLO, C. R.; VIOLA, M. R.; BESKOW, S. Vazões máximas e mínimas para bacias hidrográficas da região Alto Rio Grande, MG. Ciência e Agrotecnologia, Lavras, v. 34, n.2, p. 494-502, mar/abr., 2010.
NAGHETTINI, M.; PINTO, E. J. A. Hidrologia Estatística. Belo Horizonte: CPRM, 2007. 552p.
P O L Í T I C A N A C I O N A L D E R E C U R S O S H Í D R I C O S . D i s p o n í v e l e m : <http://www.planalto.gov.br/ccivil_03/leis/l9433.htm> Acesso em: 06 jun. 2014.
REIS, J. A. T.; GUIMARÃES, M. A.; BARRETO NETO, A. A.; BRINGHENTI, J. Indicadores regionais aplicáveis à avaliação do regime de vazão dos cursos d'água da bacia hidrográfica do Rio Itabapoana. Geociências, v. 27, n.4, p. 509-516, São Paulo, UNESP. 2008.
SILVINO, A. N. O.; SILVEIRA, A.; MUSIS, C. R.; WYREPKOWSKI, C. C. Determinação de vazões extremas para diversos períodos de retorno para o Rio Paraguai utilizando métodos estatísticos. Geociências, v. 26, n.4, p. 369-378, São Paulo, UNESP. 2007.
TUCCI, C. E. M. Regionalização de vazões. Ed. Universidade/UFRGS, 2002, 256 p. ______ . Hidrologia: ciência e aplicação. 2. ed. Porto Alegre, RG: UFRGS, 2001. 943 p.
______ . Hidrologia: ciência e aplicação. Porto Alegre: Ed. da Universidade: ABRH: EDUSP, 1997.
Histórico
Submetido em: 29/07/2013 Aceito em: 16/07/2014