Cognitive biases and power in colective decision making
25
0
0
Texto
(2) regards the association between power and cognitive biases as well as risk in judgment and decision making (Anderson & Galisnky, 2006; Sivanathan & Galinsky, 2007; Fast et al., 2009). The present study follows this line of reasoning.. Thus, this work aims to investigate whether power is related to cognitive biases of investors associated to investment clubs. Assuming the possibility that stable individual differences in judgment may be partially shaped by a group’s social environment, it is expected that biases be socially reinforced to a greater extent in investors who have more power. 2. LITERATURE REVIEW The present work focuses on a cluster of related biases largely investigated by researchers from cognitive psychology and behavioral economics and finance, namely, overconfidence, better-than-average effect, illusion of control and selfattribution. Research evidence has consistently demonstrated the prevalence and relevance of these biases. Overconfidence has been shown to affect financial markets and many models of volatility and volume have incorporated it (Odean, 1998; Daniel et al., 1998, Hirshleifer, 2001). Illusion of control makes investors trade too often and too speculatively (Barber & Odean, 2001), leading them to believe widely that risk can be managed by knowledge and trading skill and, hence, disregarding portfolio diversification (Statman, 1995). Self-attribution bias has been argued to cause successful investors to become progressively more overconfident in trading activities (Gervais & Odean, 2000), and to intensify overreactions and lead to short-term momentum and long-term reversals in stock prices (Daniel et al. 1998; Hirshleifer, 2001). 2.1 Behavioral Finance: Cognitive Biases Although finance has traditionally assumed the neoclassical framework of microeconomics, there has been substantial debate in the field concerning the neoclassical-based versus the behaviorally-based paradigm (Shefrin, 2001). One of the main reasons of this controversy refers to the consistent divergence of empirical findings from core statements 2. underlying traditional theories , evidencing that modern finance can play just a limited role in understanding why individual investors trade, how they perform, how they choose their portfolios, and why returns vary across stocks for reasons other than risk (Subrahmanyam, 2007). This void in investor behavior understanding has been partially filled by a growing body of research under the banner of behavioral finance, a different approach to financial markets emerging partially in response to the difficulties faced by the traditional paradigm.. 2. For instance, research findings have consistently show cross-sectional variance of expected returns not associated to risk, and also, that investors very often maintain just few stocks in their portfolios, disregarding thus the benefits of diversification stated by traditional theory.. 2.
(3) The microfoundation of behavioral finance lies in the behavioral decision making3 which draws mostly on cognitive psychology to provide a descriptively accurate model of human behavior. In this sense, the behavioral stream of finance focuses on how people actually behave in financial settings, reflecting a model of investor behavior which account for susceptibility to frames and other cognitive errors, varying attitudes toward risk, aversion to regret, imperfect self-control, and preferences to both utilitarian and value-expressive characteristics (Statman, 1999). In the 1970’s and early 80’s, cognitive scientists made substantial advances in the research on biases and heuristics in reasoning and decision making (to a review, see Nadel & Piattelli-Palmarini, 2002) contributing to the behavioral finance sprouting as these advances caught the attention of economists and emerged as a research field in the 1980’s (Thaler, 1980, 1985; Shiller, 1981; Bondt & Thaler, 1985, 1987; Shefrin & Statman, 1985). Shiller (2002) points out as the 1990’s as another important moment in the development of behavioral finance, when “a lot of the locus of academic discussion away from these econometric analyses of time series on price, dividends and earnings towards developing models of human psychology as it relates to financial markets”. Thenceforth, many researchers have incorporated biases, such as, overconfidence and self-attribution in their economic models in order to develop a theoretical framework that more adequately accounts for diverse factors likely to influence investor behavior and market prices (Barberis et al., 1998; Daniel et al., 1998; Hong and Stein, 1999; Gervais & Odean, 2001). Shefrin (2000) places heuristic-driven bias, frame dependence and inefficient markets as the three themes composing the phenomena approached by behavioral finance. Diversely from traditional supporters which assume the appropriate and correct use of statistical tools by practitioners, frame independence and market efficiency, behavioral researchers recognize that investors rely on heuristics and are subjected to the frame of decision problems in their perceptions of risk and return, and that both, heuristic-drive bias and framing effects, cause market prices to deviate from fundamental values and hence to be inefficient. Next, it is present the biases investigated in the present work. 2.1.1 Overconfidence Overconfidence has fascinated many researchers from different areas for so many years. Because of its generality and importance, overconfidence research has been broadly influential outside the psychology field, including in the financial domain (Schoemaker & Russo, 1992; Billett& Qian, 2005; Aukutsionek & Belianin, 2001; Koellinger et al., 2007; Barber & Odean, 2000, 2002; Gervais & Odean, 2001; Kirchler & Maciejovsky, 2002; Alemanni & Franzosi, 2006; Glaser & Weber, 2007). There is no precise definition for overconfidence in psychology literature, and the bias has been conceived in three distinct ways, namely, as the overestimation of one’s actual ability, performance, level of control, or chance of success; the. 3. To a review, see Shefrin (2001).. 3.
(4) overestimation of one’s ability or performance relative to others; and the excessive precision in one’s beliefs (to a review, see Moore & Healy, 2008). Calibration studies provide much of the evidence supporting judgmental overconfidence. One of the most consistent findings is that people are miscalibrated, that is, they are prone to overestimate the probability that their judgments are correct (for a review, see Lichtenstein, Fischhoff, & Phillips, 1982). When people are too confident, they are prone to believe strongly in the correctness of their judgments, believing thus that they know more than they really know or that their accuracy is higher than it in fact is (Pulford, 1996). Notably, overconfidence is the most prevalent phenomena identified by psychological researchers, and while in the area of cognitive psychology the study of their causes and consequences has been an issue for a long time, in the Economics and Finance literature it is a rather new field of research (Alemani & Franzosi, 2006). Behavioral researchers have investigated overconfidence in financial decision-making with field data (Barber & Odean, 2000; Statman et al., 2003; Glaser & Weber, 2007; Alemani & Franzosi, 2006), modeled in theoretical frameworks (Kyle & Wang, 1997; Benos, 1998; Odean, 1998; Barber & Odean, 1999; Gervais & Odean, 2000;Daniel, Hirshleifer, & Subramanyam, 1998, 2001; Caballé & Sákovics, 2003), and in laboratory settings (Adams et al., 1995; Benos & Tzafestas, 1997; Camerer & Lovallo, 1999;Kirchler & Maciejovsky, 2002; Brenner et al 2005). Selecting common stocks that will outperform the market is the type of task for which people are most overconfident (Barber & Odean, 2002). Overconfidence becomes more intensive when tasks are challenging and complex, and feedback is unclear or inconclusive, like investing in the stock market, which involves a high degree of uncertainty and requires investors to deal with highly speculative issues to uncover securities that have the highest expected returns (Daniel et al., 1998). Overconfidence has substantial importance in the financial market where forecasters need to deal with numerical predictions, such as, currency exchanges, earnings and stock prices (Bolger & Onkal-Atay, 2004), and confidence judgments become crucial to gauging the certainty of these forecasts since a prediction of decreasing stock prices made with 95% certainty is naturally taken more seriously than a prediction made with 60% certainty (Sieck, Merkle & Zandt, 2007). Having appropriate confidence is important for making appropriate risky decisions, and for knowing when to seek advice and information (Soll & Klayman, 2004). Overconfident investors believe their knowledge is more accurate than it really is, that their forecasts are more precise than their experience should validate (Baker & Nofsinger, 2002), and their personal assessments of the security’s value are more accurate than the assessments of others, believing more strongly in their own valuations and concerning themselves less with the beliefs of others (Odean & Barber, 2002). Overconfidence can make investors too certain about their own opinions leading them to insufficiently consider the opinions of others. Based on unrealistic beliefs about how. 4.
(5) high their returns will be and how precisely they can be estimated, overconfident investors lower their expected utility by trading too much and spending time and money on investment information (Wood & Zaichkowsky, 2004). It has been argued that overconfident investors either overestimate their ability to predict the value of the risk asset or underestimate the asset’s variance in their financial forecasts, providing thus too narrow confidence intervals corresponding to a specific probability to contain the actual prices (Glaser, Langer & Weber, 2005; Glaser & Weber, 2007; Alemani & Franzoni, 2006). Besides the well-know explanation of cognitive biases in information processing, the prevalence of overconfidence in the financial domain has also been explained as a function of self-attribution bias, the people’s tendency to attribute success to their own skills, but blame failure on bad luck or others (Daniel et al. 1998, 2001; Barberis & Thaler, 2002, Barber & Odean, 20024); hindsight bias, the proclivity to see past events as being predictable (Barberis & Thaler, 2002); illusion of knowledge, the tendency for people to believe that the accuracy of their forecasts increases with more information (Oskamp, 1965; Nofsinger, 2008), and illusion of control, the tendency to overestimate their level of control and underestimate the role of luck when investing (Barber & Odean, 2002). 2.1.2 Better-Than-Average Effect Research findings point out that most people perceived themselves to be better than others with regards to skills or positive personality attributes very often (Svenson, 1981, Taylor & Brown, 1988; to a review see Alicke & Govorun, 2005). This phenomenon has been largely labeled in the literature as “better-than-average” effect, which occurs when people believe and rate themselves as above average, despite the fact that, by definition, the median lies exactly in the middle, with the population equally divided on either side. The better-than-average effect is a particular type of social comparison where people compare their characteristics or behaviors against a norm or standard, which is usually the average standing of their peers on the characteristic (Alicke & Govorun, 2005). The people’s unrealistically self-evaluation is regarded as one of the most consistent of the selfenhancement phenomena (see Taylor & Brown, 1988). In the financial field, it has been argued that overconfident investors are likely to believe that their personal assessments of security’s values are more accurate than the assessments of others, believing more strongly in their own valuations and concerning themselves less with the beliefs of others (Odean & Barber, 2002), which should lead investors to overestimate their abilities to correctly interpret public signals, and among other consequences, to underestimate risk or to overestimate. 4. Barber & Odean (2002) sustained the joint operation of three biases underlying investor overconfidence, arguing that whose earn high returns trading online are likely to attribute this success disproportionately to their own investment ability rather than luck, becoming, then, overconfident by operation of the self-attribution bias, and moreover, that investors’ overconfidence could be reinforced by illusion of knowledge and illusion of control, since online investors have access to enormous volume of investment data and also manage their own stock portfolios and execute trades at the click of a mouse.. 5.
(6) their ability to beat the market (De Bondt, 1998). Moreover, overconfidence can make investors too certain about their own opinions leading them to insufficiently consider the opinions of others. (Wood & Zaichkowsky, 2004).. 2.1.3 Illusion of Control Although the outcomes yielding from decisions are typically dependent on an arrangement of luck and skill, research findings have evidenced that people hold an exaggerated view of how much control they exert over outcomes even of uncontrollable ones (Langer, 1975; Langer & Roth, 1975;Mckenna, 1993; Koehler, Gibbs & Hogarth 1994;Thompson et al. 1998; Hougton et al. 2000; Dixon, 2000). Langer (1975) labelled illusion of control as this expectancy of a personal success probability inappropriately higher than the objective probability would warrant. Research evidence has shown that people under the operation of illusion of control become prone to behave as though their personal involvement could influence the outcome of chance events, and also more subject to other cognitive illusions and biases. People are likely to be more overconfident when feeling control over the outcome of even chance events (Barber & Odean, 2001; Odean & Barber, 2002; Nofsinger, 2008), and illusion of control appears to influence the overoptimism of participants’ in predicting the future performance of their investments (Moore et al., 2009). Illusion of control has been found across different tasks and in many situations (to a review, see Presson & Benassi, 1996), and people are also subject to overestimate their level of control and underestimate the role of luck when investing (Statman, 2005). There is often true difficulty in making the discrimination between controllable and uncontrollable events, “since there is an element of chance in every skill situation and an element of skill in almost every chance situation” (Langer, 1975). This closed association becomes more confusing in investment decision-making where investors are likely to confuse the control they have over investment options, with the control that they lack over the return of those investments (Barber & Odean, 2001) motivated by high complexity and high uncertainty of financial decision which compels the decision-maker to rely on intuition (Kahneman & Riepe, 1998). De Bondt (1998) advocates that investors widely believe that risk can still be managed by knowledge and trading skill even after funds have been committed - believing, for instance, that it is possible to limit equity exposure selling quickly in the market. Then, deceived by this illusion of control based on a false belief in universal liquidity, investors could become encouraged to invest in few assets. In fact, empirical findings have indicated that, very often, individual investors hold in their portfolios only few stocks (Subrahmanyam, 2007), disregarding portfolio diversification despite the fact that “we have no control over financial markets” (Statman, 1995). Barber & Odean (2001) argue that illusion of control may lead investors to trade too speculatively, and many investors indicated the “feeling of empowerment” as the most important reason to make the transition to online trading, and. 6.
(7) advertisements for online brokerages often emphasize the importance of taking control of one’s investments (Wood & Zaichkowsky, 2004).. 2.1.4 Self-attribution Bias Empirical findings have consistently shown that people are prone to take personal responsibility for their desirable outcomes, yet externalize responsibility for the undesirable outcomes. Notwithstanding the common feature of human beings to learn about their abilities by observing the consequences of their actions, psychological literature has reported that individuals tend to overestimate the degree to which they are responsible for their success, and attribute them to themselves, and conversely, to attribute failures to bad luck, the actions of others or other external factors, a phenomenon which has been labeled as self-attribution bias (Bem, 1965; Miller & Ross, 1975). Although most research efforts have focused on individuals performing alone, the analysis of self-serving attributions by individuals performing within a group has also been addressed by researchers interested in which contextual conditions individuals are prone to engage in self-enhancing and self-protective attributions (Schlenker, 1975; Forsyth & Schlenker, 1977; Schlenker & Miller, 1977; Forsyth, Berger & Mitchell; 1981; Miller & Schlenker, 1985; Zaccaro, Peterson & Walker, 1987). Self-attribution bias seems to be an important component of how investors process information concerning their investment outcomes and abilities. The behavioral stream of finance and economics has indicated the bias as one of the mechanisms underlying overconfidence, since “as individuals observe the outcomes of their actions, they update their confidence in their own ability in a biased manner” (Daniel et al. 1998). According to Hirshleifer (2001), self-attribution causes investors to learn to be overconfident instead of converging to an accurate self-assessment. The author argues self-attribution as a barrier arising from self-deception which impedes investors to simply learn with the outcomes of their past (biased) judgments, since already thinking of themselves as competent. In Daniel et al. (1998) self-attribution bias intensifies overreactions and leads to short-term momentum and long-run reversals in stock prices5, since confidence changes asymmetrically as a function of their biased perception, resulting from the comparison between preceding private signals and new public signals. Gervais & Odean (2001) found that traders’ overconfidence level increases in the early stages of their career, and so, it should decrease as a function of their gained experience and greater recognition of their own abilities. Billett & Qian (2005) found that self-attribution yielding from past success in mergers and acquisitions acquirers to managerial overconfidence in future decision-making.. 5. Daniel et al. (1998) argue that such continuing overreaction causes momentum in security prices, but that suchmomentum is eventually reversed as further public information gradually draws the price back toward fundamentals. Thus, biased self-attribution implies short-run momentum and long-term reversals.. 7.
(8) 2.2 The Effects of Power on Those Who Possess It Since there is no consensus in the definition of power, and given the variety of conceptions found in the literature, it becomes appropriate to specify the conception of power adopted here. The focus of the present work on the effects of power in a group context leads to drawing from social psychology literature, where the traditional conception defines power in terms of social influence (Lewin, 1951; Lippitti et al., 1952; French & Raven, 1959; Vescio et al., 2003; Overbeck, 2010) and control over outcomes (Kelman, 1958; Thibault & Kelley, 1959; Fiske, 1993; Keltner et al. 2003 Fiske & Berdahl 2007). Thus, in the present work, power is defined as an individual’s relative capacity to influence others in the collective decision process by the control of rewards and punishments, attractiveness, expertise/credibility, access and control over information required by other members (French & Raven, 1959; Raven, 1965, 1992, 1993; Keltner et al. 2003; Forsyth, 2009). 2.2.1 Power Effects on Cognition and Information Processing Elevated power appears to be related to stereotyping (Fiske, 1993); to psychological distance with respect to others, and, hence, more abstract information processing (Smith & Trope, 2006); and to increased reliance on the ease of retrieval (Weick & Guinote 2008). Power leads people to action (Galinsky, Gruenfeld, & Magee, 2003), and misperception of control in situations largely determined by chance (Fast et al. 2009). Powerful individuals are less likely to conform and be influenced by context variables (Galinsky et al., 2008), and to take additional perspectives into account (Galinsky, Magge, Inesi & Gruenfeld, 2006). People in high power positions engage in biased self-enhancement through the devaluating of others (Kipnis, 1972), providing increasingly negative evaluations of others’ performances as becoming more powerful (Georgesen & Harris, 1998), and are prone to explain collective performance in terms of their own attributes (Fan & Gruenfeld, 1998). Powerful individuals are more likely to take risks and hold positive expectations about outcomes (Anderson & Galinsky, 2006), and also more prone to better-than-average beliefs and overconfidence (Sivanathan & Galinsky, 2007). To a review, see Keltner (2008), Forsith (2009), Fiske, Gilbert & Lindsay (2010) and Guinote & Vescio (2010). It has been argued that elevated power can lead individuals to use automatic social cognition, and recognizing thus the environment in a more automatic, rapid, and effortless way, through the use of cognitive heuristics and simple rules to make judgments, instead of controlled social cognition, which is deliberate and effortful, and accounts to multiple response options and stimulus characteristics (Fiske, 1993; Goodwin, Gubin, Fiske, & Yzerbyt, 2000; Keltner et al. 2003; Russel & Fiske 2010). Guinote (2010) argues that, however, whether powerful people are systematic information processors capable of efficient judgment, planning and goal-directed action or mindless information processors guided by heuristics depends on situational factors, such as task difficulty and motivation.. 8.
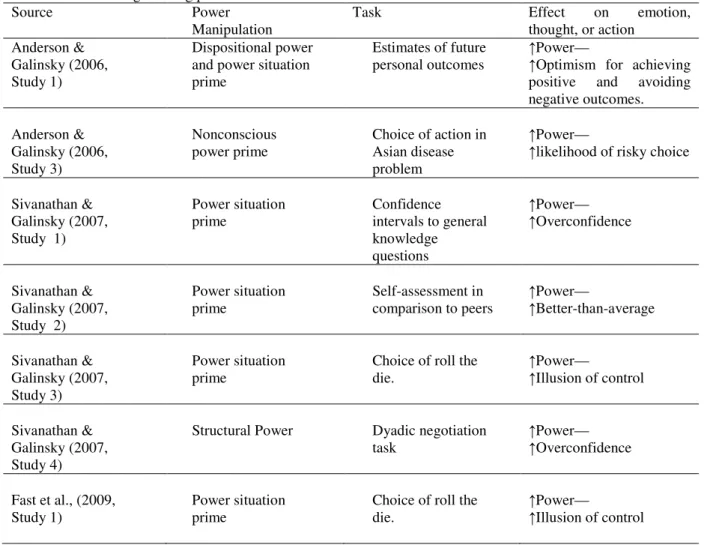
(9) The relationship between power, biases and risk attitude has been the focus of selected literature. The Table 1 presents the findings from this recent psychological literature.. Table 1 Recent findings linking power to biases and risk Source Power Task Manipulation Anderson & Dispositional power Estimates of future Galinsky (2006, and power situation personal outcomes Study 1) prime. Effect on emotion, thought, or action ↑Power— ↑Optimism for achieving positive and avoiding negative outcomes.. Anderson & Galinsky (2006, Study 3). Nonconscious power prime. Choice of action in Asian disease problem. ↑Power— ↑likelihood of risky choice. Sivanathan & Galinsky (2007, Study 1). Power situation prime. Confidence intervals to general knowledge questions. ↑Power— ↑Overconfidence. Sivanathan & Galinsky (2007, Study 2). Power situation prime. Self-assessment in comparison to peers. ↑Power— ↑Better-than-average. Sivanathan & Galinsky (2007, Study 3). Power situation prime. Choice of roll the die.. ↑Power— ↑Illusion of control. Sivanathan & Galinsky (2007, Study 4). Structural Power. Dyadic negotiation task. ↑Power— ↑Overconfidence. Fast et al., (2009, Study 1). Power situation prime. Choice of roll the die.. ↑Power— ↑Illusion of control. 2.3 Hypotheses Based on psychological literature on power, and on the cognitive psychology literature on judgmental biases, I intend to test the positive association between power with the aforementioned cognitive biases. Power and Overconfidence (Miscalibration): Power makes people recognize the environment in a more automatic, rapid, and effortless way, through the use of cognitive heuristics and simple rules when making judgments (Fiske, 1993; Goodwin, Gubin, Fiske, & Yzerbyt, 2000; Keltner et al. 2003; Russel & Fiske 2010), as well as, increases reliance on the ease of retrieval, making people more likely to judge based on what easily comes to their minds (Weick & Guinote, 2008). Power also makes people focus more on rewards associated with a given decision (Keltner et al., 2003; Guinote, 2007) and on their own ideas (Galinsky et al., 2008), and disregard others perspectives and cues in the environment (Galinsky, Magge, Inesi & Gruenfeld, 2006; Sivanathan & Galisnky, 2007; Galinsky et al., 2008). As a result, powerful individuals are more likely to anchor on their own private information and be at greater risk to incur in overconfidence, in accordance with miscalibration findings often explained in terms of a self-focused bias whereby individuals miscalibrate information. 9.
(10) without the benefit of information available in the environment (Soll, 1996). Thus, taken together, I propose that members with more power in investment clubs will show more overconfidence in their judgments about both general knowledge and stock market forecast. Thus: : The greater the power of an investment club member, the greater his/her level of overconfidence.. Power and Better-than-average effect: Better-than-average effect has been explained by people’s biased informationprocessing about self and others, in which one keeps excessive focus on the self with a corresponding lack of attention to others, serving as the basis of comparison (Griffin & Brenner, 1994).People anchor on their perceived level of skill, personality attributes or performance, and then adjust insufficiently for the comparative nature of social judgments, providing comparisons considerably more based on themselves than in their peers (Kruger, 1999). People also retrieve information about self in greater amounts and with greater perceived ease (Schwarz et al., 1991), and when retrieving information regarding others they engage less exhaustively and turn up less supporting evidence for the skills and performance of their peers (Chambers & Windschitl, 2004). Power has been shown to influence the selection and weigh of the information available in the environment which is processed by people’s cognitive structure (Guinote, 2010).Powerful individuals make judgments in a more automatic, rapid, and effortless ways (Fiske, 1993; Goodwin, Gubin, Fiske, & Yzerbyt, 2000; Keltner et al. 2003; Russel & Fiske 2010), relying more on the ease of retrieval than those with less power (Weick & Guinote, 2008), and stereotyping people (Fiske, 1993).Powerful individuals pay less attention to their social environment than low-powered individuals (Galinsky et al., 2006), appearing not to be influenced by others (Galinsky et al., 2008), disregarding perspectives which are not their own,(Galinsky, Magge, Inesi & Gruenfeld, 2006)and maintaining psychological distance with respect to others (Smith & Trope, 2006). Last, power influences power holder’s perceptions about self and others, leading individuals to evaluate performance of their peers negatively and their own positively (Georgesen & Harris, 1998). Taken together, I propose that members with more power in investment clubs will present higher self-evaluations in abilities related to investment activities in comparison with those which have less power. Thus: : The greater the power of an investment club member the greater the level of better-than-average effect.. Power and Illusion of Control: Besides the true difficulty in making the discrimination between controllable and uncontrollable events -since there is an element of chance in every skill situation and an element of skill in almost every chance situation6 - individuals are motivated to control their environment (Langer, 1975; Rothbaum et al, 1982) causing. 6Langer. (1975).. 10.
(11) the presence of cues related to having control, such as competition, choice and involvement, to lead to illusion of control (Langer, 1975; Langer & Roth, 1975; Thompson et al. 1998). Recent research has shown that power serves as one such cue, (Sivanathan & Galinsky, 2007; Fast et al, 2009), which increases the sense of control of individuals experimenting or having power, thus leading them to illusory control on events based on chance or largely determined by it. Investors are likely to confound the control they have over investment options with the control that they lack over the return those investments realized (Barber & Odean, 2001), and this misperception can become even stronger in powerful club investors experiencing more influence over other members and control on the collective outcomes. Possessing resources which other members do not have (e.g., expertise and information), members are likely to feel in greater control of their decisions and environment. Taken in concert, I propose that powerful members develop a greater sense of control related to the outcomes of their investments, and hence, higher illusion of control on stock market concerns in comparison with investors which have less power. Thus: : The greater the power of an investment club member, the greater the member’s illusion of control.. Power and Self-attribution: People often erroneously associate control primarily with the occurrence of a desired outcome seeing themselves as causal, and becoming, thus, more likely to perceive a relationship between their behavior and outcomes when they succeed than when they fail (Miller & Ross, 1975). Empirical findings have shown that power affects the perceived connection between one’s action and the desired outcome (Fast et al., 2009), which makes powerful individuals more likely to engage in self-enhancement phenomenon. Power also influences power holder’s perceptions about self and others less powerful, leading individuals in higher power positions to make self-serving attributions established on false feedback about his own worth, through the devaluation of performance of the less powerful subjects (Kipnis, 1972), to explain collective performance in terms of their own attributes (Fan & Gruenfeld, 1998), and to evaluate performance of others negatively, and their own positively (Georgesen & Harris, 1998). Based on these evidences, I hypothesize that powerful investors are more likely to biased self-attributions related to performance in investment clubs. Thus: : The greater the power of an investment club member, the greater the level of member’s self-attribution.. 3. METHODS The approach of the effects of power or other relational constructs, requires investigating small groups in real settings, since to develop experiments able to reproduce such characteristics is pretty hard. Thus, in order to investigate the relationship between member’s power and his/her level of self-deception biases, I sampled small groups of investors. 11.
(12) acknowledged as investment clubs, voluntary associations of people who pool their money to invest in stocks in the Brazilian capital market. Differently from investment funds, in which people invest in a fund that is managed by a financial institution, in an investment club, the group members manage their investments. In order to do that, members meet regularly to make decisions on investments, new member entrance, and amount of capital invested. There are basically two kinds of Brazilian clubs, closed and openinvestment clubs. The latter in fact, are not investment clubs in their true conception, but investment funds formed and managed by brokerage firms and banks, and due this fact their members do not participate in the decision-making process. So, they were not regarded in the present work. During the clubs’ meetings, members articulate their reasons, pros and cons to buy or sell stocks, discussing their opinions and judgments overtly. By law, all members can cast one vote in decision making, and in practice, clubs operate under the majority-rule decision scheme. Although investment clubs are non-hierarchical organizations, and thus, nobody has legitimate power in the group, members may rely on their power bases to influence other members and make decisions. When judging, club members can take advice of those who they believe having superior knowledge, or they can turn to others who generally hold specific information to a better judgment. Moreover, a member can occasionally accept influence for reasons of identification and respect, or just to avoid conflict and other relational problems. Thus, the processes underlying decision making may include diverse relations (e.g., identification, expertise, and information) built on actors’ power bases. 3.1 Sampling and Data Gathering Since there was not an available list of open and closed Brazilian investment clubs or any public or private source to draw from, I contacted for the first time each one of the 72 Brazilian brokerage houses which are responsible for the register of investment clubs in the BOVESPA and CVM7 ,and, for the execution of buying and selling orders. This contact with brokerages revealed a small number of real investment clubs which accomplished often mettings, where could be observed social interaction. Thus, after have access to 21 investment clubs, I sampled 7 with full conditions to compose the present work. Data gathering occurred by means of a questionnaire developed to collect data on psychometric and relational measures, in order to analyze the relationship between power and biases at individual level, being applied during the meetings by one of the researchers.. 7. CVM – Brazilian Stock Exchange and Brazilian Securities and Exchange Commission.. 12.
(13) 3.2 Variable Measurement The measurement of power and cognitive biases was based on the conceptions of the constructs presented in the literature review. Next, it is present the operationalization of each one. Power: Power has received expressive attention by network analysts, and the development of numerical indices at individual level (e.g., measures of network centrality or sociometric status) able to describe the power of an actor in terms of features of his network environment has been an important agenda in social network research (Wasserman & Faust, 1994). In many cases, simple degree centrality measures have been associated with power (Burkhardt & Brass, 1990; Brass & Burkdardt, 1992, 1993; Krackhardt & Brass, 1994), and I followed this approach to measure club members’ power. Here, power is regarded as the individual’s relative capacity to influence others by the control over rewards and punishments, attractiveness, expertise, and access to and control over information required by club members (French & Raven, 1959; Raven, 1965, 1992, 1993; Keltner et al. 2003). In this sense, to obtain measures of the power of each member, all of them were asked to check off the names of the members who control a particular base of interpersonal power (Friedkin, 1993). As a measure of the member’s power, I took the sum of the his/her normalized degree centrality of the 5 matrices constructed from the members' responses, where k, and. =. ⥡. is the matrix of responses for power base. = 1 if member i reports that member j controls the base (e.g., i identifies with j), or. = 0 otherwise.. Overconfidence (Miscalibration): Club members were asked to create confidence intervals with a probability of 90% containing the true quantities relative to ten questions concerning stock market forecast, and 10 questions from the test developed by Russo and Schoemaker (1992). Surprise index and the percentage of judgments which lie beyond the boundaries of the confidence intervals, were compared with the confidence level required to compute individual overconfidence measures. Better-than-average effect: To measure better-than-average effect, members will be asked to rate themselves in comparison to other members of the club, and also, in comparison with the average investor on the next skills in investment decision making. The average of the percentages provided by each member was taken as proxy of the bias. Illusion of Control: To measure illusion of control over investments outcomes in the stock market, I employed the fouritem scale developed by Glaser & Weber (2003) composed by a set of questions on luck and skill. The sum of the scores derived from responses was taken as measure of investor’s illusion of control. Self-attribution: To estimate self-attribution bias members were asked to respond – on a 7-point unipolar scale anchored by not at all (1) and very much (7) – four items adapted from Miller and Schlenker (1985) referring to their personally responsibility to the success and failures in the investment club, and also about the responsibility of all other members. A positive/negative score indicates a member attributing more/less responsibility for the failures in the club to all other. 13.
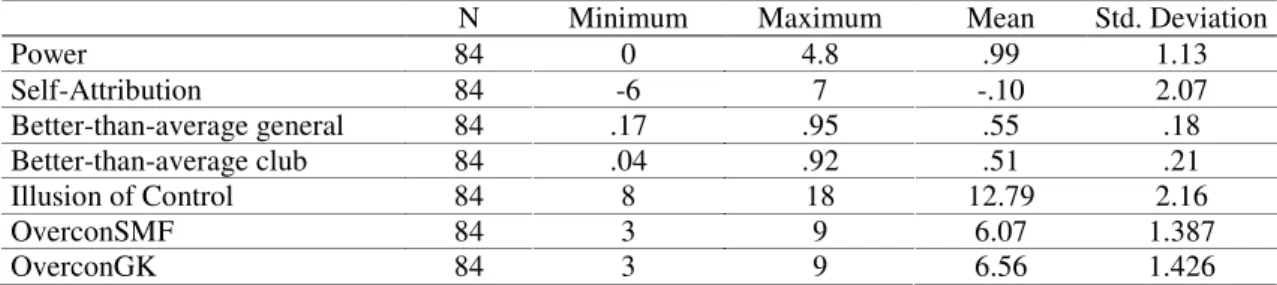
(14) members than to himself, while a positive/negative score indicates a member claiming more/less responsibility for the success in the club than they are allowing the others. 4. STATISTICAL ANALYSIS The Table 2 presents descriptive statistics relative to all measures computed for the whole sample. Table 2 Descriptive statistics of measures N Power 84 Self-Attribution 84 Better-than-average general 84 Better-than-average club 84 Illusion of Control 84 OverconSMF 84 OverconGK 84. Minimum 0 -6 .17 .04 8 3 3. Maximum 4.8 7 .95 .92 18 9 9. Mean .99 -.10 .55 .51 12.79 6.07 6.56. Std. Deviation 1.13 2.07 .18 .21 2.16 1.387 1.426. Investors were overconfident of their judgments on general knowledge and stock market forecasts, in line with previous research in the financial field (Kirchler & Marciejovsky, 2002; Alemani & Franzoni, 2006; Glaser & Weber, 2007; David, Graham & Harvey, 2010). Overconfidence measure (mean of surprise) was higher for the general knowledge scale (M = 6.56; SD = 1.42) than for the stock market forecast scale (M = 6.07; SD = 1.38), t(83) = 2.980; p < .005, indicating that both tasks were difficult with the former being significantly more difficult that the latter. The average percentage of surprises was 76% for general knowledge scale and 71% for stock market forecasts, in line with prior research. Russo & Schoemaker (1992) found percentages ranging between 42% and 64%; Glaser & Weber (2007) presented 75% for general knowledge questions and 61% for stock market forecasts; and Hilton et al. (2011) showed percentages from 62% to 78%. In terms of better-than-average, a mean result of 55% shows that investors believe they are slightly above average in investment skills, in comparison with the average investor in the stock market. When asked to evaluate themselves in comparison with other members of their investment clubs, the mean self-evaluation of investors resulted in close to 50%, indicating absence of better- or worse-than-average effect. However, when controlling to power variable the findings evidence significant differences between people having power, and those in a powerless position. In conducting an ANOVA, members in a higher power position show higher and above average self-evaluations related to most investor in the market (M = 59%, SD = 17% compared to M = 51%; SD = 18%), F(1,82) = 5186, p < .05) than members in lower power position. While the comparison with other members of the investment club shows also better-than-average effect to members in a higher power condition, investors in powerless positions rank themselves as worse-than-average (M = 58%, SD = 21% compared to M = 42%; SD = 18%), F(1,82) = 14.06, p < .0001). These findings give primary support to the predicted relationship between psychological traits and power. In order to test the hypotheses on the positive relationship between power and cognitive biases, I performed a correlation analysis between the variables (Table3).. 14.
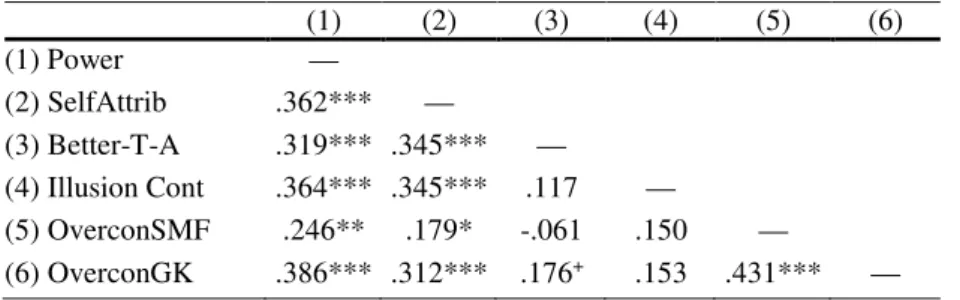
(15) Table 3 presents Pearson’s correlations between variables.. (1) Power (2) SelfAttrib (3) Better-T-A (4) Illusion Cont (5) OverconSMF (6) OverconGK. (1) (2) — .362*** — .319*** .345*** .364*** .345*** .246** .179* .386*** .312***. (3). (4). (5). (6). — .117 -.061 .176+. — .150 .153. — .431***. —. *p < .10; **p < .05; *** p < .01, two-tailed. Even though general knowledge questions and stock market forecasts are absolutely diverse tasks8, their scores are positively and significantly correlated, r = .43, p< .001, supporting stable individual differences in the degree of miscalibration. Glaser & Weber (2007) found similar results employing both type of tasks, and also Hilton et al. (2011) presented a positive and significant relationship when using two different scales in general knowledge tasks. In addition to the two overconfidence measures, it was also calculated each investor’s interval width score by taking each item, ranking the width of each respondent’s interval, and summing the ranks across investors. Overconfidence scores were positive and significantly correlated with interval width (r = .45, p< .001, for general knowledge questions, and r = .59, p< .001 for stock market forecasts) indicating that more overconfident investors also assigned narrower confidence intervals. Notably, while the overconfidence scores for stock market forecasts were negatively and not significantly associated with better-than-average measures relative do investment skills, overconfidence in general knowledge task was virtually significantly and positively associated with better-than-average scores (r = .176, p = .109). The absence or the little correlation found here between overconfidence and positive illusions9 such as illusion of control and better-than-average is consistent with the findings in the psychological literature which have reported no significant relationship (Deaves et al., 2003; Régner et al., 2004; Moore & Healy, 2008; Hilton et al., 2011). In the financial field, Glaser, Langer & Weber (2005), Alemanni & Franzosi (2006) and Glaser & Weber (2003, 2007) found similar results. The more a member discrepancy in attributions of personal responsibility to success and failures in the investment clubs, the higher his or her overconfidence in both general stock market forecasts and general knowledge questions. In line with theoretical and empirical evidences about the straight relationship between the two biases, self-attribution scores were significantly positively associated with the calibration scores of general knowledge questions and almost significant with those for stock market forecasts (r = .312, p< .10 for GKQ and r = .179, p< .11 for SMF). The association between selfattribution and overconfidence biases is an underlying assumption in financial models (Daniel et al., 1998; Gervais &. 8 9. Glaser & Weber (2003). Taylor & Brown (1988) labeled them as positive illusions.. 15.
(16) Odean, 2001; Hirshleifer, 2001). Self-attribution scores were also significantly and positively associated with the betterthan-average effect and illusion of control measures (r = .3447, p< .10, and r = .3455, p< .10 respectively). Table 3 shows that all psychological traits were positively associated with power measure, supporting all the developed hypotheses in the present work, according to higher levels of power would lead to higher levels of biases. Since gender has often been associated to stable individual differences in the extant literature, I present also descriptive statistics computed for the whole sample clustered by gender as well as F-statistics and p-values relative to mean differences for all measures (Table 4). Table 4 Oneway ANOVA by gender Women Mean. Men SD. Mean. SD. Power .685 .199 Self-attribution -.968 .354 Better-than-average .454 .029 Illusion of control 12.452 .388 OverconFin 6.226 .250 OverconGer 6.935 .252 *p < .10; **p < .05; *** p < .01, two-tailed.. 1.173 .415 .609 12.981 5.981 6.340. .152 .270 .022 .297 .191 .193. F(1,82). P-Value. 3.776 9.650 17.479 1.175 .606 3.520. .055* .003*** <..000*** .282 .438 .064*. Data showed interesting significant gender differences. For instance, women appear more overconfident in the precision of their knowledge, while men judge themselves more responsible for success, but not for failures in the club in comparison with other members, and also more prone to consider themselves as better than average in questions concerning investment skill.. Moreover, men are assigned as having more power in investment club settings. In order to address some relationships between different power measures, I dichotomized high- and low-power by performing a median-split of the power measure concerning power bases obtained for the whole sample. I found that higher-power individuals were more sought after for advice and information than low-power individuals (M = .37, SD = .27 compared to M = .03; SD = .06; F(1,82) = 65.04, p <.0001), according with Friedkin’s (1998) assumption that actors with noteworthy power basis on expertise and information in domains of interest to others actors would be more sought after. Powerful members also judged themselves both more responsible for success (M = .74, SD = .27 compared to M = -1.31; SD = 1.52; F(1,82) = 32.95, p<.0001), and less responsible for failures (M = -.07, SD = 1.50 compared to M = .45; SD = 1.23; F(1,82) = 3.0445, p<.01) than those powerless. Moreover, the self-attribution measure employed to capture the discrepancy between the attribution of success and failures revealed that power holders were more biased (M = 0.67, SD = 2.32 compared to M = -0.86; SD = 1.44), F(1,82) = 13.047, p <.001) than members with less power.. 16.
(17) 4.1 Regression Analysis The sample is composed of 84 members nested in seven investment clubs, which can make the use of the single level regression model not appropriated. Data collected in groups can violate assumptions of independence, and provide biased estimation of error variance due to correlation of a group member’s scores (see Kenny & Voie, 1985), which may affect inferential statistics and p-values, and hence lead to false conclusions. Thus, nonindependence was investigated for each dependent variable. Kenny and La Voie (1985) suggest testing the intraclass correlation of each variable when searching for evidence of nonindependence, a useful parameter associated to one-way Anova with random-effects (Bryk & Raundenbush, 2002). The intraclass correlation can be interpreted as the correlation between the scores from two individuals who are in the same group, or alternatively, as the proportion of variation in the outcome measure that is accounted for by a group (Kashy & Kenny, 2000). In order to compute intraclass coefficients, the variance decomposition by a fully unconditional hierarchical linear model was performed, in which there is no specified predictor at individual or group levels (see Bryk & Raundenbush (2002). In the level-1 model (individual). was set to zero for all j (investment club), yielding:. =. where each. +. , level-1 error, is assumed normally distributed with mean zero and constant level-1 variance,. . The. prediction of the psychometric scores within each level-1 unit was performed with only one group parameter, the intercept , in this case, equal to the mean score of the psychometric measure for the jth, that is, (investment club). was set to zero for the ANOVA with random effects: =. where. . In the level-2 model. +. represents the grand-mean of the psychometric mesure in the population, and. associated with group j, and is assumed to have a mean zero and variance. is the random effect. . Thus, the combined random effects model10. results: =. +. +. → grand mean → group (level-2) effect → individual (level-1) effect. 10. The label random effects model is due the random process employed in the construction of the group effects.. 17.
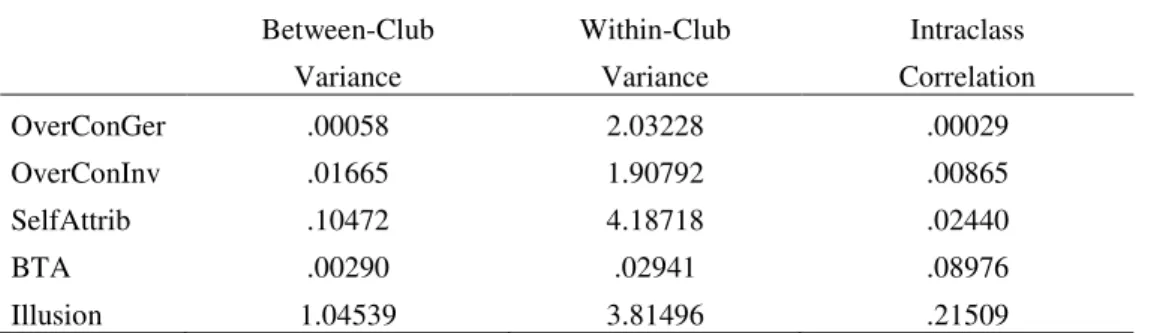
(18) Table 5 shows the estimated between-group variance - corresponding to the term INTRCPT1 - and within group variance - corresponding to the term level-1. The intraclass correlation coefficient for each variable was obtained by the ratio of the two variance components estimates in the fully unconditional model: Var$Y&' ( = Var$u ' + r&' ( = τ ,= where. is the between-group variance, and. /. +σ. +. is the within-group variance. Table 6 presents the intraclass correlation. for each dependent variable. Table 5 Variance Components of Biases. Overconfidence GKQ. INTRCPT1, R0 level-1, E. Standard Deviation .02417 1.42558. Overconfidence SMF. INTRCPT1, R0 level-1, E. .12905 1.38127. .01665 1.90792. 6. 6.54832. .364. Self-attribution. INTRCPT1, R0 level-1, E. .32360 2.04626. .10472 4.18718. 6. 7.35897. .288. Illusion of control. INTRCPT1, R0 level-1, E. 1.02244 1.95319. 1.04539 3.81496. 6. 24.86621. .001. Better-than-average. INTRCPT1, R0 level-1, E. .05383 .17150. .00290 .02941. 6. 13.20971. .039. Random Effect. Variance Component .00058 2.03228. df. Chi-square. P-value. 6. 4.83505. >.500. The hypothesis of no between-group variance for illusion of control and better-than-average effect was rejected (table 6), supporting that a significant portion of the total variance of the two biases occurs between groups. Table 6 Intraclass Correlation Coefficients for Biases Between-Club. Within-Club. Intraclass. Variance. Variance. Correlation. OverConGer. .00058. 2.03228. .00029. OverConInv. .01665. 1.90792. .00865. SelfAttrib. .10472. 4.18718. .02440. BTA. .00290. .02941. .08976. Illusion. 1.04539. 3.81496. .21509. The 7 investment clubs sampled are small groups of 10 to 15 people, which reduces the potential effects of intraclass correlation on p values. The ICC for overconfidence in both tasks were very small, which might allow accomplishing the statistical analysis at single level performing a traditional multiple linear regression for these dependent variables. However, since an intraclass correlation equal to .01 is still likely to bias standard errors, and that the measures obtained for self-attribution, better-than-average effect and illusion of control were higher than this parameter; it was decided to. 18.
(19) treat this problem of nonindependence by adopting a hierarchical linear model design.. RANDOM INTERCEPT MODEL Based on the fully unconditional model employed previously, where there is no predictor at individual or group levels, a random intercept model was performed by adding power and the control variables age, genre, financial background and the “Big Five factors” as predictors at individual level. Diversely from the traditional analysis regression, the coefficients, t-statistics and p-values provided by the random intercept model are unbiased. Table 7 Random Intercept Model - Coefficients for the Regression of Biases on Power and Control Variables Dependent Variables Independent Variable. OvercGK. OvercSMF. SelfAttrib. IlluControl. BTA. 5.623*** (3.967). 6.850*** (4.689). 2.437 (1.177). 11.546*** (5.341). 0.563** (3.281). .024* (1.692). .027* ( 1.829 ). .036* (1.750). -.007 (-.309). .000 (.099). 1.437*** (3.825). .603+ (1.646). -.771 (-1.432). -.036 (-.062). -.086** (-1.887). FinBack. -.042 (-.072). -.226 (-.369). -.145 (-.169). 1.156 (1.318). -.034 (-.476). Extraversion. -.010 (-.432). .022 (.904). -.037 (-1.100). -.019 (-.550). -.000 (-.156). Agreeableness. -.040 (-1.267). -.023 (-.717). -.076+ (-1.646). -.032 (-.685). -.008 (-2.198). Conscientiousness. -.016 (-.574). -.044 (-1.465). -.036 (-.854). .050 (1.200). .000 (.175). Emotional Stability. .019 (.934). .010 (.453). -.003 (-.111). .004 (.130). .000 (.092). Intelect. .017 (.587). -.023 (-.740). .035 (.804). .019 (.422). .008** (2.187). .548*** (3.267). .339** (2.080). .494** (2.161). .471** (2.009). .036* (1.922). Constant Age Genre. Power – PA. *p < .10; **p < .05; *** p < .01, two-tailed. Among the control variables included in the models, age resulted significantly and positively related to self-attribution and overconfidence, in both general knowledge questions and stock market forecasts, in line with assumptions that the variable affects financial decisions (Barber & Odean, 2001; Dorn & Huberman, 2002; Glaser & Weber 2004, 2007). Intelect appeared to be determinant to. In line with this finding signalized by the oneway ANOVA developed primarily, after to control for the other variables, regression results indicated that women were more overconfident about the. 19.
(20) precision of their knowledge, but less prone to believe themselves as better than average in investment skills. This positively significantly association between gender and overconfidence contrasts with previous research, which found no gender differences in miscalibration studies (e.g., Lichtenstein et al. 1982; Gigerenzer, et al. 1991; Biais et al., 2005). Moreover, gender appeared positively and almost significantly at 10% level (p < .11) associated with overconfidence in stock market forecasts, contrasting with former studies in the financial field, which have assumed a higher level of the bias amongst men (Barber & Odean, 2001). As hypothesized, power was found to be positively significant for all dependent variables11. Regression coefficients indicated that individuals having more power were more overconfident in both general knowledge questions and in their predictions on stock market forecasts; made higher than average self-assessment of investment skills in comparison to other investors; believed more to be able to control or predict the market; attributed more personal responsibility to success than failures with respect investment performance in the club; and were most optimist about the future. Interesting, investors having more power in the investment club did not appear more prone to risk than investors in less power positions.. 5. DISCUSSION AND CONCLUSIONS The present research examined the relationship of power in investment club settings with a cluster of cognitive biases. Based on cognitive psychology literature, and on theoretical and empirical evidence from recent social psychology research, it was hypothesized that powerful members show higher levels of biases than powerless members. As predicted, power shows a significant positive association with all psychological traits treated here. Club investors showed overconfidence in their judgments and, most important, power appeared to affect the degree of the bias in information processing. Powerful investors presented higher overestimations of their judgments than those powerless, and also assigned narrower confidence intervals in their stock market forecasts, evidencing that having power in a real investment setting leads to greater confidence in the precision of specific knowledge about investments. Although the average investor did not show biased attribution with respect group performance, after considering power differences the pattern appeared overtly. It was founded found that powerful investors assigned themselves as more responsible for successes, but not for failures, in the group performance, according with evidence that powerful people make self-serving attributions (Kipnis, 1972), evaluate others’ performance negatively whereas himself positively (Georgesen & Harris, 1998) and explain collective performance in terms of their own attributes (Fan & Gruenfeld, 1998).. 11. I tested to possible moderation effects of gender and age variables. There were no moderation effects of the two variables in the relationship between power and biases.. 20.
(21) Financial theorists have argued an important role to self-attribution bias in their market models, and also claiming that overconfidence partially stems from it (Daniel et al. 1998, 2001; Hirshleifer, 2001; Barberis & Thaler 2002). The likely misperception experimented by individual investors related to the control that they have over investment options, with the control that they lack over the return of those investments realized (Barber & Odean, 2001), seemed to be reinforced by power. Club investors with more power perceived stock market outcomes as more controllable and predictable, supporting the hypothesis that power can work as a cue, leading to biased perceptions of control (Fast et al., 2009). Powerful investors showed greater better-than-average perceptions about their investment skills in comparison to other members of their groups, which could be partially explained by perceptions to be more able to influence investment concerns in the club. However, when asked to compare themselves with the ordinary average investor, powerful members also viewed themselves as better than average. On the other hand, investors in powerless positions showed worse-thanaverage perceptions in comparison with the other members of their own group, and when asked to evaluate themselves in comparison with the average investor, their mean response lay on the mean. Taken in concert, these findings suggest that powerless individuals adjust their self-evaluations accounting to the context of the social comparison, while the powerful see themselves invariably better. Financial theorists often assume gender differences in overconfidence, sustaining a higher level of the bias amongst men (Barber & Odean, 2001), although outside of the financial field, research findings have pointed out no gender differences to the bias (Lichtenstein et al., 1982; Gigerenzer, et al., 1991; Biais et al., 2005). Here, notably, women were significantly more overconfident (miscalibrated) than men in both general knowledge and stock market forecast and, moreover, they considered themselves worse-than-average in investment skills, and less responsible for success in investment club performance. Notably, the findings in the present research point out a paradoxical situation: powerful members in investment clubs are both, the more sought for advice and information and also the more biased in their judgments related to investment concerns, which can compromise the collective performance. The identification of power as one of the factors influencing the investors’ level of biases may contribute to the better understanding of investor’s attitude and behavior, as well as offering the possibility to improve it, by providing some cues to debiasing actions: “Learning more about what makes some people more prone to overconfidence, how, and when, will be invaluable in understanding the processes that affect confidence judgments and how those can be improved” (Klayman & Burt, 1998). Last, although the current research is carried out in investment clubs, I believe that the analysis of the relationship between social power and biases could be translated to other settings where investment decision-making is performed in groups, such as retirement or pension funds in which investment decisions are made by an elected board. Since pension funds and. 21.
(22) other kinds of institutional investors12 pool large sums of money and hold an important share in the stock market, it would be interesting to account for individuals’ biases and social power in group decision processes of market stock players, and investigate potential consequences for financial markets and institutions.. REFERENCES Alemanni, B., Franzosi, A., (2006). Portfolio and psychology of high frequency online traders. Second report on the Italian market. Alicke MD and Govorun O. ( 2005) The better-than-average effect. In: Alicke MD, Dunning DA and Krueger JI (eds) The Self in Social Judgment. New York: Psychology Press, 85-106. Anderson, C. & Galinsky, A. (2006).Power, Optimism & Risk-Taking. European Journal of Social Psychology.,36, 511– 536 Aukutsionek, S. P. & Belianin, A. V. (2001). Quality of forecasts and business performance: A survey study of Russian managers. Journal of Economic Psychology, 22, Issue 5. Baker, K. H. & Nofsinger, J. R. (2002). Psychological biases of investors. Financial Services Review, 11, n. 2, p. 97-116. Barber, B. M. & Odean T. (2000). Trading Is Hazardous to Your Wealth: The Common Stock Investment Performance of Individual Investors. Journal of Finance, 773–806. Barber, B. M. & Odean, T. (1999). The courage of misguided convictions. Financial Analysts Journal, 41-55. Barber, B. M., & Odean T. (2002). “Online investors: Do the slow die first?” Review of Financial Studies, 15, 455–89. Barber, B. M., & Odean, T. (2001). Boys will be boys: Gender, overconfidence, and common stock investment. Quarterly Journal of Economics, 116, 261-292. Barberis, N. & Thaler, R. (2002).A Survey of Behavioral Finance. NBER Working Papers 9222, National Bureau of Economic Research, Inc. Barberis, N., Shleifer, A., & Vishny, R. (1998). A model of Investor Sentiment. Journal of Financial Economics , 49, 307-343. Bem, D.J. (1965). An experimental analysis of self-persuasion. Journal of Experimental Social Psychology, 1(3), 199– 218. Benos, A. & Tzafestas, E. (1997). Alternative distributed models for the comparative study of stock market phenomena. Information Sciences, 99 (3-4), 137-157. Benos, A. V. (1998). Aggressiveness and survival of overconfident traders. Journal of Financial Markets, 1, 353-383. Biais, B., Hilton, D., Pouget, S., & Mazurier, K. (2005).Judgmental overconfidence, self-monitoring and trading performance in an experimental financial market. Review of Economic Studies, 72, 297–312. Billett, M. T. & Qian, Y. (2005). Are Overconfident CEOs Born or Made? Evidence of Self-Attribution Bias from Frequent Acquirers. Management Science, October. Bolger, F., and D. Önkal-Atay (2004).The effects of feedback on judgmental interval predictions. International Journal of Forecasting, 20, 29-39. Brass, D. J., & Burkhardt, M. E. 1992.Centrality and power in organizations. In N. Nohria & R. Eccles(Eds.), Networks and organizations: Structure, form, and action: 191-215.Boston:Harvard Business School Press. Brass, D. J., & Burkhardt, M. E. 1993. Potential power and power use: An investigation of structure and behavior. Academy of Management Journal, 36: 44-470. Brenner, L., Griffin, D. & Koehler, D. (2005). Modeling patterns of probability calibration with Random Support Theory: Diagnosing case-based judgment. Organizational Behavior and Human Decision Processes, 97, 6481. Bryk, A., & Raundenbush (1992).Hierarchical linear models. London: Sage Publications.Burkhardt, M. E., & Brass, D. J. 1990. Changing patterns or patterns of change: The effect of a change in technology on social network structure and power. Administrative Science Quarterly, 35: 104-127. Caballé, J. & József Sákovics (2003).“Speculating Against an Overconfident Market”. Journal of Financial Markets, 6, 199-225. Camerer, C. & Lovallo, D. (1999). Overconfidence and excess entry: An experimental approach. American Economic Review, 89 (1), 306 -318. Chambers, J. R., & Windschitl, P. D. (2004). Biases in social comparative judgments: The role of nonmotivated factors in above-average and comparative-optimism effects. Psychological Bulletin, 130, 813-838. Daniel K., D. Hirshleifer, & Subrahmanyam, A. (1998). Investor psychology and security market under and overreactions. Journal of Finance, 53, 1839- 1885. Daniel, K., Hirshleifer, D., & Subrahmanyam A. (2001). Overconfidence, Arbitrage, and Equilibrium Asset Pricing’’ Journal of Finance, 56(3), 921–965. David, I, Graham, J. R. & Harvey, C. R. (2010).Managerial Miscalibration. Working Paper. De Bondt, W. F. M. & Thaler, R. H. (1985). Does the stock market overreact? Journal of Finance, 40, 3, 793-805. 12. Banks, insurance companies, retirement or pension funds, hedge funds and mutual funds.. 22.
(23) De Bondt, W. F. M. & Thaler, R. H. (1987).Further Evidence on Investor Overreaction and Stock Market Seasonality. Journal of Finance,American Finance Association, vol. 42(3), pages 557-81, July. De Bondt, W. F. M. (1998). A portrait of the individual investor. European Economic Review, 42, 831-844. De Bondt, W., Muradoglu, G., Shefrin, H. & Staikouras, S. K. (2008).Behavioral Finance: Quo Vadis? Journal of Applied Finance, 18, 2. Deaves, R., E. Lüders and G. Y. Luo (2003).An experimental test of the impact of overconfidence and gender on trading activity. Working paper. Dorn, D. & Huberman, G. (2002). Who trades?.Working Paper, Columbia University. Fan, E.T., & Gruenfeld, D.B. (1998). When needs outweigh desires: The effects of resource interdependence and reward interdependence on group problem solving. Basic and Applied Social Psychology, 20, 45-56. Fast, N.J., Gruenfeld, D.H, Sivanathan, N., & Galinsky, A.D. (2009). Illusory control: A generative force behind power’s far-reaching effects. Psychological Science, 20, 502–508. Fellner, G., & Maciejovsky, B., (2007). Risk attitude and market behavior: Evidence from experimental asset markets. Journal of Economic Psychology, 28, Issue 3, June, Pages 338-350. Fischhoff, B. (1982). Debiasing. In D. Kahneman, P. Slovic, & A.Tversky (Eds.), Judgment under uncertainty: Heuristics and biases (pp.422–444). New York: Cambridge University Press. Fiske, S. T. & Berdahl, J. L. (2007). Social power. In A. Kruglanski, & E. T. Higgins (Eds.), Social psychology: A handbook of basic principles (2nd ed., pp. 678–692). Oxford University Press. Fiske, S. T. (1993). Controlling other people: The impact of power on stereotyping. American Psychologist, 48, 621–628. Fiske, S. T., Gilbert, D. T., & Lindsey, G. (eds.). (2010). Handbook of social psychology, 5th ed., Vol 1. New York: Wiley. Forsyth, D. R. (2009). Group dynamics. Belmont, CA: Thomson Wadsworth. Forsyth, D. R., & Schlenker, B. R. (1977). Attributing the causes of group performance: Effects of performance quality, task importance, and future testing. Journal of Personality, 45, 220-236. Forsyth, D. R., Berger, R., & Mitchell, T. (1981).The effects of self- serving vs. other-serving claims of responsibility on attraction and attribution in groups. Social Psychology Quarterly, 44, 59-64. French, J., & Raven, B. (1959).The Bases of Social Power.Pp. 150-67 in Studies of Social Power, edited by D. Cartwright. Friedkin, N. E. (1993). Structural bases of interpersonal influence in groups: A longitudinal case study. American Sociological Review, 58: 861-872. Galinsky, A. D., Gruenfeld, D. H., & Magee, J. C. (2003).From power to action. Journal of personality and Social Psychology, 85, 453–466. Galinsky, A. D., Jordan, J., & Sivanathan, N. (2008).Harnessing power to capture leadership. In D. Forsyth and C. Hoyt (Eds.).Social Psychology and Leadership. Praeger Press. Galinsky, A. D., Magee, J. C., Inesi, M. E.,&Gruenfeld, D. H (2006). Power and perspectives not taken. Psychological Science, 17, 1068-1074. Georgesen, J., & Harris, M.J. (1998). Why’s my boss always holding me down? A meta-analysis of power effects on performance evaluations. Personality and Social Psychology Review, 3, 184–195. Gervais, S. & Odean, T. (2001). “Learning to Be Overconfident,” Review of Financial Studies, 14, 1-27. Gervais, S., Heaton, J. B. & Odean T. (2001). Learning To Be Overconfident. Review of Financial Studies, 14, 1-27. Gigerenzer, G., Hoffrage, U. & Kleinbolting, H. (1991). Probabilistic mental models: A brunswikian theory of confidence. Psychological Review, 98, 506-528. Glaser, M. & Weber, M. (2003).Overconfidence and Trading Volume. CEPR Discussion Paper. Glaser, M. & Weber, M. (2004). Which Past Returns Affect Trading Volume? Working Paper, University of Mannheim. Glaser, M. & Weber, M. (2005). Which Investors are able to Correctly Estimate their Past Realized Portfolio Performance. Working Paper. Glaser, M. &Weber, M. (2007).Overconfidence and Trading Volume. Geneva Risk and Insurance Review 32(1), June 2007, 1-36. Glaser, M., Langer, T., & Weber, M. (2005). Overconfidence of Professionals and Lay Men: Individual Differences Within and Between Tasks? Working Paper. Goodwin, S. A., Gubin, A., Fiske, S. T., & Yzerbyt, V. Y. (2000). Power can bias impression processes: Stereotyping subordinates by default and by design. Group Processes & Intergroup Relations, 3, 227–256. Griffin, D. & Brenner, L. (1994).Perspectives on Probability Judgment Calibration. In Blackwell Handbook of Judgment and Decision Making, D. Koehler and N. Harvey (Eds.), Malden Mass.: Blackwell, pp. Guinote, A. & Vescio, T. K. (2010).The social psychology of power. New York: Guilford Press. Guinote, A. (2010). The Situated Focus Theory of Power. Chapter 5 In: A. Guinote & T. K. Vescio (Eds.), The social psychology of power. New York: Guilford Press. Hilton, D., Régner, I., Cabantous, L., Charalambides, L. & Vautier, S. (2011). Do positive illusions predict overconfidence in judgment? A test using interval production and probability evaluation measures of miscalibration. Journal of Behavioral Decision Making, Volume 24, Issue 2, pages 117-139, April. Hirshleifer, D. (2001), Investor Psychology and Asset Pricing. The Journal of Finance, 56, No. 4, Papers and Proceedings of the Sixty-First Annual Meeting of the American Finance Association, New Orleans, Louisiana, January 57, pp. 1533-1597. Hong, H., & Stein, J. C. (1999). A unified theory of underreaction, momentum trading and overreaction in asset markets. Journal of Finance, 54, 2143-2184.. 23.
Imagem

+2
Documentos relacionados
To make things worse, the leader makes poor quality decisions because he does not master the necessary knowledge on those urgent decisions, which may involve, for example, knowledge
Two months after the first session real acupuncture group had better scores than sham acupuncture group in terms of pain intensity during activity, rest and at night and BDI, mental
A regra jurídica referenciada não permitia, prima facie, o acesso daquele que pretenderia frequentar o ensino primário. Não constituía, em si, a atribuição de
O caminho para a descoberta da dupla hélice do DNA tem cinco grandes protagonistas e decorreu em três grandes centros de investigação: no Cavendish, com James Watson e
This task was developed and based in bibliographic research, articles and in national laws, visit to Department of public Works in the city, in addition to check
E assim, finalizando com o tema, judicialização do direito à saúde no fornecimento de medicamentos e a efetividade do princípio da supremacia do interesse público,
From impulse-response functions the results, with annual data for a set of 14 OECD countries covering the period 1970-2007, show that the mark-up (i) depicts a pro-cyclical behaviour
From impulse-response functions the results, with annual data for a set of 14 OECD countries covering the period 1970-2007, show that the mark-up (i) depicts a pro-cyclical
