Wheel-surface model parameters estimation: sand humidity influence
on traction effort of all-terrain unmanned vehicle
Tomasz Czaplaa*
Marcin Ficea
Roman Niestrója
a Silesian University of Technology, Akademicka 2A, 44-100, Gliwice, Poland. E-mail: [email protected], [email protected],
* Corresponding author
http://dx.doi.org/10.1590/1679-78255005
Abstract
The aim of the paper is to present the experimental results for material model of the sand, case of wet and dry probe. Since traction and side forces derivation methodology and tire-round interaction models for on-road vehicles are widely described, there is a lack of methods for off-on-road vehicles. The methodology, presented in this work, includes test in various ground conditions and different driving direction. Test results, presented in the paper were acquired for dry and humid sand, for various tire tilt angle. Traction and side forces were acquired and then will be used for black-box model parameters identification of the wheel-ground interaction.
Keywords
Electric drive, tire-ground interaction, wheel model.
1 INTRODUCTION
The area of application of the model described in this paper is an investigation of propulsion system performance for all-terrain vehicles. Since on-road vehicles wheel-road interaction models and traction characteristics are well investigated and various models is presented, there is a need of the off-road vehicles behavior identification based on wheel-surface. The off-road vehicles have significantly higher energy consumption due to higher traction resistance compared to railway and on-road cases. Furthermore, rolling resistance and grip are strongly related to terrain characteristics. Another parameter increasing the rolling resistance is tire pressure lower than in case of on-road vehicles in comparison to on-road solutions. In case of off-road vehicles, surface cannot be considered as a rigid body and, in consequence, the interaction model formulation method should take into account ground plastic deformation.
Hybrid electric and electric drive systems control system setup and efficiency optimization algorithms should be provided with a complete and accurate data for traction effort energy consumption assessment. For skid-steered vehicles, there is a strong relation between the number of maneuvers during the operation cycle, so that assessment the turning characteristics and perform simulation for various terrain conditions and maneuver intensity is demanded to avoid the power station and battery characteristics and size overestimation.
2 CURRENT STATE-OF-ART ANALYSIS
In case of wheel and rigid surface interaction for road conditions deformation under vertical load (steady state), longitudinal and lateral (transverse) forces are taken into account. Longitudinal forces are the effect of driving torque application and lateral forces are being generated during cornering. Stress pattern and tire deformation is strongly related to load conditions and internal structure of a tire.
On-road dynamics models are strongly focused on friction and sliding behavior of a wheel. Simple rigid body models introduced by Dahl (1968) was taking into account the pre-sliding behavior of the wheel body. As an application of Dahl work, Lu-Gre bristle model was developed as described by Olsson et al. (1998). As an experimental approach Magic Formula model was presented by Bakker et al. (1989). The significant experience in vehicle dynamics testing and development effected with an experimental model of tire dynamics.
Wheel deformation affected by lateral forces has a significant influence on rolling resistance according to Wong (2001) although is commonly neglected in analytical wheel – surface interaction models and numerical calculation methods. For more adequate calculations several approaches are used: empirical models, spring-damper wheel models and numerical calculation methods as it was described by Sharma and Pandey (1996).
The early stage of tire-ground interaction models development was based on experimental tests including cone testing for soil shear, tension and extension strength assessment in reference to Collins (1971) and Czapla et al. (2017). Modern Cone Penetrometer Testing methods are based electromechanical sensors usage in order achieve ground characteristic along the measurement line. Vital information can be provided with test performed on the specific ground surface with using testing technology firstly introduced by Bekker (1960). Methodology was based on two tests: plate sinkage test and shear test. A number of plates with normalized dimensions were used for the sinkage measurement and shear rings or plates simulated the shear assessment. Test results achieved with various methods are used to calculate relationships between pressure and ground deformation indicated by sinkage.
𝜎𝜎=�𝑘𝑘𝐵𝐵𝑐𝑐+𝑘𝑘𝜑𝜑� ∙ 𝑧𝑧𝑛𝑛, (1)
𝜏𝜏= (𝑘𝑘𝑐𝑐𝑐𝑐ℎ𝑒𝑒𝑒𝑒𝑒𝑒𝑐𝑐𝑛𝑛+σ ∙sin𝜑𝜑)∙ �1− 𝑒𝑒𝑗𝑗�𝐾𝐾�, (2)
where:
𝜎𝜎 – normal pressure,
kc, k𝜑𝜑, n – soil properties parameters,
z – soil sinkage,
B – tire width,
𝜑𝜑 – free angle of shearing soil resistance,
ô – shear stress,
kcohesion – soil cohesion,
j – shear displacement.
Bekker (1956) introduced the first significant modelling method for stress calculation in the tire – soil contact area and beneath. Bekker equation is used to calculate the normal pressure as a function of the sinkage (Eq. 1), modified Coulomb equation (Eq. 2) can be used to calculate the shear stress with taking into account shear displacement, cohesion and soil shear deformation parameters as described by Sharma and Pandey (1996).
The Bekker model and other methods based on rigid wheel have a great disadvantage the tire deformation influence on wheel – surface dynamics which is a wheel deformation neglection. Models introduced later by Schmid (1995) allow to take into account the tire deformation. Present research methods and interaction models in most of cases use Finite Element Analysis approach.
3 METHODOLOGY DESCRIPTION
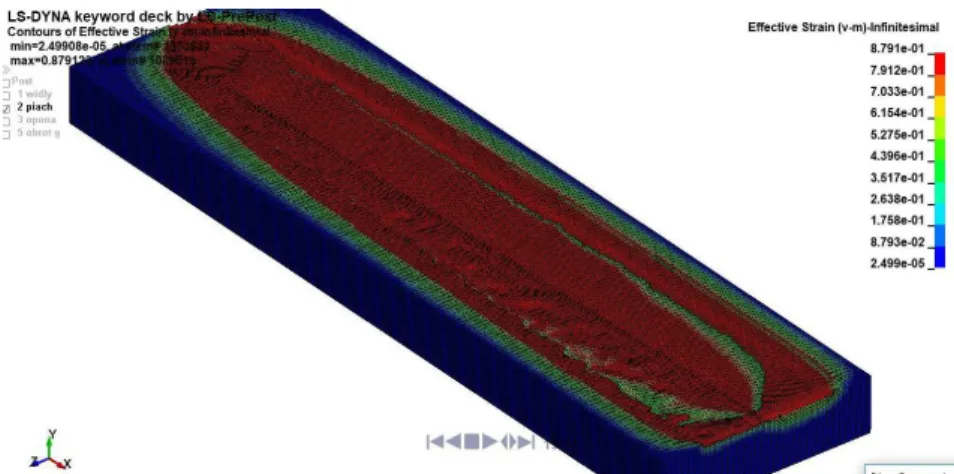
Figure 1: FE track model with the deformation caused by the wheel
Based on test results, skid-steered vehicle rolling resistance for various terrain conditions can be calculated. In case of skid-steered vehicle, unlike the classic solutions, different velocities on both sides of vehicle technique is used to achieve turn. The greatest advantage is higher maneuverability and simplified design compared to classical solutions. Additional feature for electric and other advanced transmission systems is zero-turn availability.
Wheel parameters
Road conditions Vehicle
parameters
Figure 2: Ground-tire interaction model
On the Fig. 3 the basic and simplified geometrical model of the skid-steered vehicle is shown. Model is simplified to a symmetrical skid-steering case, assuming that the mass center is located in geometrical center of vehicle and the vehicle is moving on ideal surface. The model is sufficient for presented research which is aimed at determining the wheel-surface rolling resistance.
R
c
v1
v2 v0 L
v2,f
v2,r
ω
v1,r
W v1,f
α1,r α
2,r
�𝛼𝛼1,𝑓𝑓�=�𝛼𝛼1,𝑟𝑟�= |𝛼𝛼1| = atan 𝐿𝐿
𝑅𝑅+12𝑊𝑊, (3)
�𝛼𝛼2,𝑓𝑓�=�𝛼𝛼2,𝑟𝑟�= |𝛼𝛼2| = atan
𝐿𝐿
𝑅𝑅−12𝑊𝑊. (4)
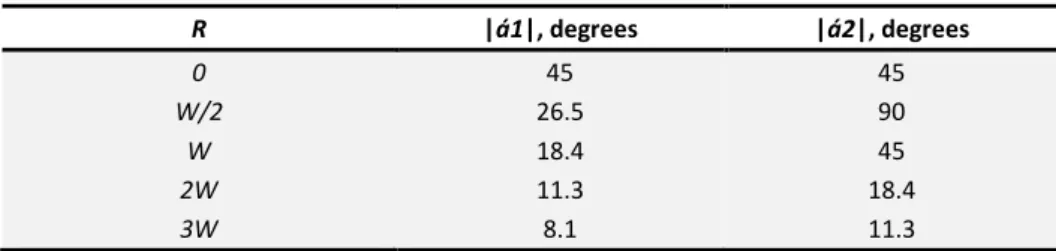
Table 1: Values of slip angle in depending on a turn radius.
R |á1|, degrees |á2|, degrees
0 45 45
W/2 26.5 90
W 18.4 45
2W 11.3 18.4
3W 8.1 11.3
Values of slip angle in depending on a turn radius are listed in Table 1. The wheel cart during the tests was propelled by external excitation system. The wheel had no driving torque applied for presented test facility configuration. Propulsion system is based on a rail with a cart propelled by an electric motor. Rail is responsible for keeping the straightforward motion of the cart and allows the system to rotate in the rail axis. A frame containing the wheel suspension is placed on a cart moving on a rail. Wheel is attached to the frame via adjustable fork, that allows to change the attack angle. The fork frame has two degrees of freedom constrained by rods containing force transducers, thus the lateral and longitudinal forces are isolated and measured (Fig. 4).
Figure 4: Experimental stand.
Experimental stand was intended to perform various wheel behavior tests in a number surface conditions. Laboratory stand allows to change a wide range of parameters including: angle of attack (difference between wheel vertical symmetry plane and direction of motion), wheel pressure, wheel vertical load, ground type. Unique design of the stand is intended to isolate and measure longitudinal and lateral forces in the coordinate system related to moving cart. The tests were carried out with using an 20x10.00-8” all-terrain vehicle wheel. On the Fig. 4 wheel geometry during the skid-steering maneuver and measured forces is shown according to work of Czapla et al. (2017).
Related to the figure 4 total longitudinal and transverse forces related to geometrical axes of the wheel can be expressed as below:
𝐹𝐹𝑙𝑙𝑐𝑐𝑛𝑛𝑙𝑙𝑤𝑤ℎ𝑒𝑒𝑒𝑒𝑙𝑙=𝐹𝐹𝑙𝑙𝑐𝑐𝑛𝑛𝑙𝑙∙cos(−𝛼𝛼w)− 𝐹𝐹𝑙𝑙𝑙𝑙𝑙𝑙∙sin(−𝛼𝛼w), (5)
𝐹𝐹𝑙𝑙𝑙𝑙𝑙𝑙𝑤𝑤ℎ𝑒𝑒𝑒𝑒𝑙𝑙 =𝐹𝐹𝑙𝑙𝑐𝑐𝑛𝑛𝑙𝑙∙sin(−𝛼𝛼w) +𝐹𝐹𝑙𝑙𝑙𝑙𝑙𝑙∙cos(−𝛼𝛼w). (6)
For the case shown in the Fig. 4 for chosen coordinate system Flat wheel has negative value. In case of maximum wheel turn angle, áw = 90°, xwheel axis is parallel to y axis and ywheel axis will be consequently parallel to x-axis, so:
𝐹𝐹𝑙𝑙𝑐𝑐𝑛𝑛𝑙𝑙𝑤𝑤ℎ𝑒𝑒𝑒𝑒𝑙𝑙=−𝐹𝐹𝑙𝑙𝑐𝑐𝑛𝑛𝑙𝑙, (7)
𝐹𝐹𝑙𝑙𝑙𝑙𝑙𝑙𝑤𝑤ℎ𝑒𝑒𝑒𝑒𝑙𝑙 =𝐹𝐹𝑙𝑙𝑙𝑙𝑙𝑙. (8)
Resultant longitudinal force Flong wheel, is responsible for traction torque generation. It can be assumed to be traction effort force. Each wheel generates the resistant force caused by slip necessary for turn performance in case of skid-steered vehicle.
4 RESULTS ANALYSIS
Tests were performed for two surfaces, dry and humid sand. Volumetric humidity of a humid sand was approx. 30%. The tire pressure for both tests was 0.15 MPa and tests were carried out for 4 slip angles áw = 0°, 30°, 60° and 90°. For both cases, wheel axis load was 80 kg. The wheel was propelled on the sand surface with the speed of 0.5 m/s. Results for steady-state conditions are shown in graphs and photos below.
4.1 DRY SAND
As the first, results of experiment for dry sand will be presented. For the first tests, sand with natural humidity was used.
Figure 6: Waveforms of measured longitudinal and lateral forces related to movement direction (a) and calculated longitudinal and lateral forces related to the wheel geometry (b) for áw = 30°. The wheel on the experimental stand, after test (c) and tire track (d).
Figure 7 Waveforms of measured longitudinal and lateral forces related to movement direction (a) and calculated longitudinal and lateral forces related to the wheel geometry (b) for áw = 60°. The wheel on the experimental stand, after test (c) and tire track (d).
Figure 8: Waveforms of measured longitudinal and lateral forces related to movement direction (a) and calculated longitudinal and lateral forces related to the wheel geometry (b) for áw = 90°. The wheel on the experimental stand, after test (c) and tire track (d).
4.1 WET SAND
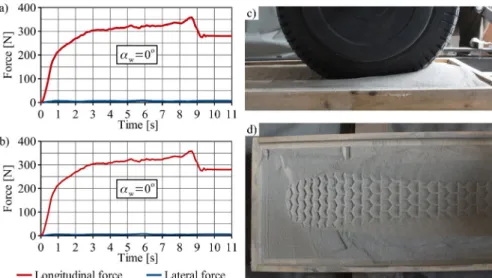
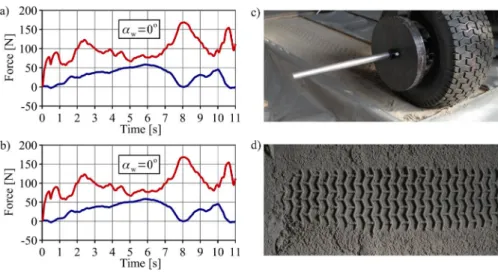
Figure 9: Waveforms of measured longitudinal and lateral forces related to movement direction (a) and calculated longitudinal and lateral forces related to the wheel geometry (b) for áw = 0°. The wheel on the experimental stand, after test (c) and tire track (d).
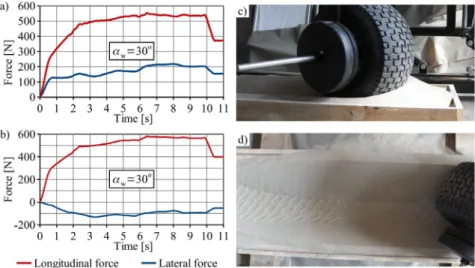
Figure 10: Waveforms of measured longitudinal and lateral forces related to movement direction (a) and calculated longitudinal and lateral forces related to the wheel geometry (b) for áw = 30°. The wheel on the experimental stand, after test (c) and tire track (d).
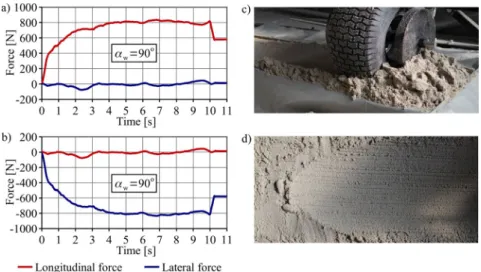
Figure 12: Waveforms of measured longitudinal and lateral forces related to movement direction (a) and calculated longitudinal and lateral forces related to the wheel geometry (b) for áw = 90°. The wheel on the experimental stand, after test (c) and tire track (d).
On the figures 5-12 there could be observed that forces values vary during the measurement period. The experiment starts when the wheel is placed on flat sand surface, not in the tire track. Before the wheel was reaching the edge of sand container, it generated the sand pile in the front that caused the force increase (Fig. 13 and 14). Figures 13 and 14 show detailed view of test results for áw = 0° and wheel on tested surface for ground behavior pattern. For further analysis, averaged forces values were taken into account from the range from approximately 3 to 7 seconds. For both cases, dry and wet sand, analogical test routine was used. Apart from the small difference between measured load values, the sand pattern caused by the wheel-surface interaction was similar. Since the wet sand was more cohesive, the track was sharper and more consistent.
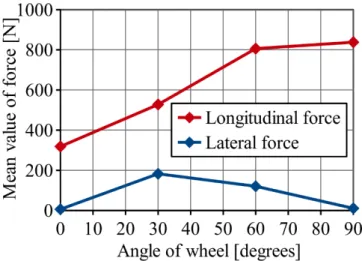
Longitudinal force increased in the function of slip angle áw and for 60° and 90° was similar. For 60° angle the wheel turn decayed what could be observed on the photos showing the tire track. The wheel pattern track cannot be indicated. Lateral force for angles 0° i 90° was equal approx. 0 N what can be explained by the symmetry of kinematical structure.
Figure 13: Waveforms of measured longitudinal and lateral forces for áw = 0°.
5. WHEEL SURFACE MODEL FORMULATION
Proposed approach leads to empirical traction effort calculation model development for skid-steered vehicle. The effect of the model application is accurate calculation of yaw moment value for skid-steered wheeled vehicle in various terrain conditions. The first step was resistance forces calculation function that allows to obtain torque for each wheel.
Input parameters for the model are:
• slip angle,• normal force (wheel vertical load),
• wheel pressure,
• ground pattern.
Output parameters of the model:
• longitudinal force – contribution to the traction resistance of the vehicle,
• lateral force – contribution to the traction resistance of the vehicle,
• longitudinal wheel force – generates traction resistance for each wheel,
• lateral wheel force – generates bending moment for the wheel and loads for the suspension system.
Magic formula model is based on experimentally derived load patterns for loads acting on each vehicle wheel. Figure 15-16 show an averaged test results in the function of slip angle for performed test conditions.
Resultant traction resistance could be derived as it is shown in Eq. 9
𝐹𝐹𝑙𝑙=𝑔𝑔𝑚𝑚∙ 𝑝𝑝𝑙𝑙∙ 𝑓𝑓𝑙𝑙(𝛼𝛼𝑤𝑤), (9)
where:
ft – traction resistance coefficient,
pt – tire pressure coefficient,
gm – wheel load.
Figure 16: Values of longitudinal and lateral forces depending of the slip (attack) angle for wet sand.
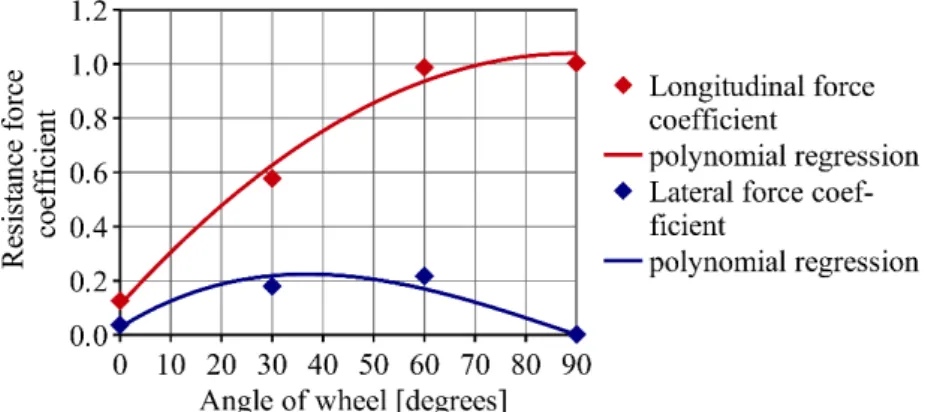
In order to generalize results, two coefficients are introduced: longitudinal and lateral resistance coefficient (Eq.10,11).
𝑓𝑓𝑙𝑙𝑐𝑐𝑛𝑛𝑙𝑙 =𝐹𝐹𝑙𝑙𝑙𝑙𝑙𝑙𝑙𝑙𝐺𝐺 - longitudinal wheel resistance coefficient, (10)
𝑓𝑓𝑙𝑙𝑙𝑙𝑙𝑙=𝐹𝐹𝑙𝑙𝑙𝑙𝑙𝑙𝐺𝐺 – lateral wheel resistance coefficient, (11)
where:
G – vehicle weight (m·g).
Fig. 17-18 show the range of mentioned above coefficients in the function of slip angle for dry sand case. In addition, approximation of coefficient values for all wheel slip range with using 3rd rank polynomial.
Figure 17: Values of longitudinal and lateral force coefficients depending of the slip (attack) angle for dry sand
Figure 18: Values of longitudinal and lateral force coefficients depending of the slip (attack) angle for wet sand
force is sand deformation. Wet sand, as more adhesive, reduces the tire sinkage and in consequence the rolling resistance. For higher angles of attack, the mass of the sand displaced is comparable, so that resistance force coefficient difference has been reduced.
6. CONCLUSIONS
The methodology presented in the article is based on test facility designed by authors and has unique abilities for direct traction loads measurement for various wheel-surface configurations.
First results show that the methodology allows to determine the most significant differences in resistance coefficient between various wheel operation and soil conditions.
Since the tests were performed with using preliminary setup and were intended to verify the methodology correctness, the track was relatively short and narrow. Laboratory facility development plans include the test track modification. Increasing track length will allow to achieve longer periods of force stable values. Test track modification will also allow to avoid possible collisions between the tire and the track walls.
Presented tests were performed for technical conditions assessment for laboratory facility development and future work will be focused on methodology mastering, evaluation of complementary, FEM model and measurement automation and widening the parameters range (speed measurement, tire track investigation methods).
Presented methodology is not intended to develop the wheel-surface interaction models, so that considerations of mentioned phenomena will be limited to the range that is necessary for turning moment of skid-steered vehicle assessment.
Since, the wheel was propelled by external device (dragging rod), the difference between dragged and driven wheel has to be investigated. Laboratory equipment will be developed in order to enable driven wheel tests performance for various terrain conditions.
REFERENCES
Bakker E., Pacejka H.B., Lidner L.: A New Tire Model with an Application in Vehicle Dynamics Studies. SAE paper 890087, Monte Carlo, 4th Autotech Conference, 1989
Bekker, M. G.: Off-the-road locomotion. Ann Arbor, Michigan: The University of Michigan Press, 1960
Bekker, M. G.: Theory of land locomotion. Ann Arbor, Michigan: The University of Michigan Press, 1956
Collins, J. G.: Forecasting trafficability of soil. Technical Memo 3-331, Vicksburg, Miss: USA Corps of Engineers Waterways Experiment Station, 1971
Czapla T., Fice M., Niestrój R.: Wheel-surface model parameters estimation for all-terrain vehicle - experimental basis. 14th Conference Dynamical Systems Theory and Applications, DSTA 2017, £ódŸ, 11-14, 2017, Abstracts. Eds. J. Awrejcewicz, M. KaŸmierczak, P. Olejnik, J. Mrozowski. £ódŸ: Wydaw. Politechniki £ódzkiej, 2017, p. 121
Dahl. P.R.: A solid friction model. The Aerospace Corporation, El Segundo, CA, TOR-158(3107-18), 1968.
Schmid. I.C.: Interaction of vehicle and terrain results for 10 years research at ikk. Journal of Terramechanics, 32(1):3–26, 1995
Olsson H., Åström K.J., Canudas de Wit C., Gäfvert M., Lischinsky P.: Friction Models and Friction Compensation, European Jourtnal of Control, Elsevier, 1998
Sharma A. K., Pandey K. P.: A review on area measurement of pneumatic tyre on rigid and deformable surfaces. Journal of Terramechanics, Vol. 33. No. 5, pp. 253-264, Elsevier Science Ltd. 1996