ContentslistsavailableatSciVerseScienceDirect
Ecological
Engineering
jou rn a l h o m e pa g e:w w w . e l s e v i e r . c o m / l o c a t e / e c o l e n g
Impact
of
aeration
conditions
on
the
removal
of
low
concentrations
of
nitrogen
in
a
tertiary
partially
aerated
biological
filter
Antonio
Albuquerque
a,∗,
Jacek
Makinia
b,
Krishna
Pagilla
caCivilEngineeringandArchitecturalDepartment,UniversityofBeiraInterior,Calc¸adaFontedoLameiro,6200-001Covilhã,Portugal bFacultyofCivilandEnvironmentalEngineering,GdanskUniversityofTechnology,GabrielaNarutowicza11/12,80-233Gda´nsk,Poland
cCivil,ArchitecturalandEnvironmentalEngineeringDepartment,IllinoisInstituteofTechnology,3201SouthDearbornStreet,Room228AlumniMemorialHall,Chicago,IL 60616-3793,USA
a
r
t
i
c
l
e
i
n
f
o
Articlehistory:Received25September2011
Receivedinrevisedform21February2012 Accepted26March2012
Keywords:
Biologicalaeratedfilter Denitrification Nitrogenremoval Nitrification Partialaeration Residualremoval
a
b
s
t
r
a
c
t
Asubmergedbiologicalaeratedfilter(BAF)partiallyaeratedwasusedtostudytheremovaloflow concen-trationsofammonianitrogen(0.3gN/m3to30.5gN/m3)typicallyfoundinnutrientenrichedriverand
lakewaters,andtreatedeffluents.Fourseriesofexperimentswereperformedwithasynthetic wastewa-teratammonialoadingratesbetween6gN/m3dand903gN/m3dandC/Nratiosfrom2to20.Theresults
showedthatammoniaremovalratesreachedhighervalues(172gN/m3dto564gN/m3d)forC/N=2and
lowervalues(13.6gN/m3dto34.6gN/m3d)forC/N=20.Between50%and70%oftheammoniawas
removedintheuppersectionoftheBAF,wherethedissolvedoxygen(DO)concentrationwasover2.1g O2/m3andthebiofilmdepthrangedfrom0.4to0.6mm.Atthebottomsectionofthereactor,
simulta-neousremovalofammoniaandnitratewasobservedattheDOconcentrationsintherange0.4gO2/m3
to0.8gO2/m3.Therewasnoremovalofammonianitrogenforloadsbelow15gN/m3.d.Theresults
indi-catethattheremovalofnitrogeninpartiallyaeratedBAFmaynotonlybeexplainedbytheconventional mechanismsofnitrification/denitrification.
© 2012 Elsevier B.V. All rights reserved.
1. Introduction
Thedischargeofnitrogencompoundstosoilandwatersmay adverselyaffectwaterresourcesinseveralwaysincluding contri-butiontoeutrophication,depletionofoxygen,toxicitytoaquatic environmentandpublichealthconcerns.Nitrogenpolluted sur-facewatersincludingthosefromlakesandriversoftenneedtobe pretreatedpriortouseindrinkingwatersystems.Hence,removal of nitrogen(bothreduced formsuchas ammoniaand oxidized formsuchasnitrate)fromtreatedwatersandsurfacewatersfor reusehasbecomeanimportantneedtoprotectpublichealthand reduceecologicalrisk.Inordertosatisfystringentregulations con-cerningnitrogenremovalfromwastewaterintheEuropeanUnion (UrbanWastewaterDirective 91/271/EEC,10 to15gN/m3)and
USA(totalN=3gN/m3insomeregions),conventionalsecondary
wastewatertreatmentsystemsneedtoberetrofittedorthe treat-mentschemeshouldbeexpandedwithpolishingtreatment.The researchdescribedhereaddressesnitrogenremovalfromsurface
∗ Correspondingauthor.Tel.:+351275242058;fax:+351275329969. E-mailaddresses:[email protected],[email protected](A.Albuquerque), [email protected](J.Makinia),[email protected](K.Pagilla).
watersandwastewatereffluentsusinglowmaintenanceand effec-tivebiologicalaeratedfilters.
Applicationofsubmergedbiologicalfiltrationtoremove resid-ualloads(nutrients,traceelementsandpathogens)asatertiary and/orpolishingstepcanbeapromisingalternativetoretrofitting (Tchobanoglous et al., 2003; Jeong et al., 2006; Schulz and Menningmann, 2008; Farabegoli et al., 2009; Jenssen et al., 2010).Submergedbiologicalaeratedfilters(BAF),alsoknownas submerged aerobic biofilters (Schulz and Menningmann, 2008) present several advantages over other fixed-film reactors (e.g. rotatingbiologicalcontactors(RBC)ortricklingfilters)including a highconcentration of active biomass, good control of excess biomass,highsludgeretentiontime(SRT)thatenables degrada-tionofcomplexcompounds,betterprotectionagainsttoxicpeaks bythebiofilm,goodefficiencyofpollutant(carbon,nitrogen, phos-phorousand pathogen)removal combinedwithahighfiltering capacityinasingle-unitprocess,easymaintenanceandoperation, noneedforsludgerecyclingandafinalclarifier(Mendoza-Espinosa andStephenson,1999;Gradyetal.,1999;Tchobanoglous etal., 2003;HidakaandTsuno,2004;SchulzandMenningmann,2008). ThecapitalcostofaddingBAFastertiary/polishingtreatmentis lowerincomparisonwithconstructionofanewadvanced treat-ment system and its construction does not interfere with the operationofexistingreactors.
0925-8574/$–seefrontmatter © 2012 Elsevier B.V. All rights reserved. http://dx.doi.org/10.1016/j.ecoleng.2012.03.006
Themaindisadvantagesaretheriskofcloggingandenergycosts associatedwithaerationandwashingsystems.Cloggingmaybe minimizedifsolidscouldbeproperly removedupstreamor by usingmediawithvoidratioover0.4(Gradyetal.,1999;Farabegoli etal.,2009).Theenergycostsmaybereducedbyoptimizing wash-ingcyclesand usinglow air flowrate orintermittentaeration. Thislast proceduremayalsobeusefultochangethe biochemi-calenvironmentinthefilterfromanaerobictoaerobicinorderto promotesimultaneouslyoralternatelynitrification/denitrification mechanisms.
The media used in BAF must have suitable specific surface area(500m2/m3 to2000m2/m3)toallowagoodbiofilm
devel-opment,andaparticlediameterrangingfrom1to4mmtoallow avoidratioadequatefora goodhydraulicflowrate( Mendoza-EspinosaandStephenson,1999;Albuquerque,2003;Schulzand Menningmann,2008).Mendoza-EspinosaandStephenson(1999)
pointoutremovalefficienciesfororganicsandnitrogenover80%in completelyaeratedBAFrunningwithhydraulicloadingrates(HLR) from1m/hto10m/h.Anaturalporousvolcanicrock(puzzolane) presentssuitablepropertiesforapplicationinbioreactorsandhas beenalready testedinsequencingbatchbiofilter(Buitrónetal., 2004)fortheremovalofazodye.Villaverdeetal.(2000)havealso testedthismaterialincompletelyaeratedBAF,butfortheremoval ofhighammoniaconcentrations(100gN/m3).Operationairflow
ratesinBAFmayrangefrom18L/Hto200L/h(Heetal.,2007;Ha etal.,2010).
In a previous paper (Albuquerque et al., 2009a) the perfor-manceofanon-aeratedlab-scalebiofilter(filledwith2–4mmof puzzolaneparticles)ontheremovaloforganicmatter(acetate), ammonia,nitriteandnitratewasanalysed.Inthisstudy,thesame reactorwasconvertedtoapartiallyaeratedBAFand long-term operatingdatawereanalysedintermsoftheremovaloflow ammo-nianitrogenconcentrations.Therefore,theaimofthisstudywasto evaluatetheeffectofaerationontheperformanceofa puzzolane-based BAF reactor to remove low concentrations of ammonia nitrogen(0.3gN/m3to30.5gN/m3),whichmayconstituteauseful
mitigationmeasure for pollution controland integrated water-shedmanagement.MostofthepreviousworkswithBAFhaveused atotalaeratedfiltertoremovehigherconcentrationsof ammo-nia(Mendoza-Espinosa andStephenson,1999; Villaverdeet al., 2000;Stephensonetal.,2003;Garzon-Zunigaetal.,2005;Leietal., 2009;Haetal.,2010),normallyfrom25gN/m3toapproximately
650gN/m3(i.e.,thereactorswereusedmainlyasasecondary
treat-mentstep).BAFsreactorstudiedinthispapercouldbeusedfor restorationofponds,lakes,andriverspollutedbycultural eutroph-ication as wellas pollution prevention by treating wastewater effluents,whichcontainlownitrogenlevels.
2. Methodology
2.1. Experimentalset-up
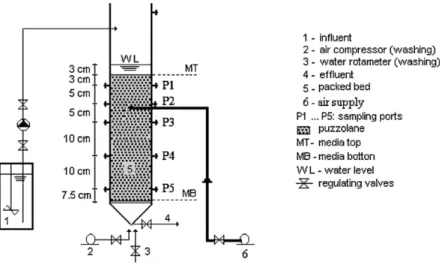
A BAF reactor with 7.0cm×40.5cm (internal diame-ter×packing height) with a downward flow configuration was set-up for this study (Fig. 1). A homogeneous puzzolane materialwithaneffectivediameterof4mm,specificsurfacearea of1740m2/m3andvoidratioof0.52wasused.Themediabedwas
submerged3cmbelowthewaterlevel.Fivesamplingports(P1–P5, 5mmindiameter)wereprovidedalongtheheightofthereactor tocollect water samples for analytical measurements. Another fiveportsinthesamelocationswereconnectedtopiezometersto evaluatevariationsinthehydrostaticpressurebetweentheports. Thereactorwasalsoequippedwithanexternalaerationdevice (TetraTecAP150pump,Italy)withaflowratecontrolsystemand
amaximumcapacityof150L/h,connectedclosetotheP2 sam-plingpoint(atapproximately8cmfromthemediatop).Theair wasinjectedintothereactorthrougha4mmtubewithafine bub-blemicro-diffuser.Theaerationdeviceintroducedairupwardin ordertokeepdissolvedoxygen(DO)concentrationsover2gO2/m3
inthesectionMT-P2(i.e.,thereactorwaspartiallyaerated).This isoneof thenovelties ofthis work,since mostoftheprevious workswithBAF(Villaverdeetal.,2000;Stephensonetal.,2003;Lei etal.,2009;Haetal.,2010)usedcompletelyaeratedfilterswiththe aerationdevicelocatedatthebottomofthereactors.A backwash-ingsystemwasincludedinordertoremovetheexcessofsludge producedduringtheBAFoperation.Thebackwashingwaterflow ratewascontrolledbyarotameter(GARDENAT120,Italy),whilst thebackwashingairflowratewascontrolledbyapressurepump (VACUUBRANDME4R,Germany).
2.2. Feedingsolutions
Thefeedingsolutionusedfortheexperimentsincludeda min-eralmedium(buffer,magnesiumsulphate,calciumchlorideand iron chloridesolutions) and sourcesof organiccarbon (sodium acetate)andammonia(ammoniachloride),aspreviouslydescribed inAlbuquerqueetal.(2009a).Theconcentrated sodiumacetate solution (113.4g C2H3O2Na·3H2O per L) had a chemical
oxy-gendemand (COD)concentration of 50kgCOD/m3 and a total
organiccarbon (TOC)concentration of 20kgC/m3. The
concen-trated ammonia chloride solution (76.41g NH4Cl per L)had a
NH4–Nconcentrationof20kgN/m3.
Duringthenormaloperatingconditions(excludingthe exper-imental assays), the BAF reactor was fed with the synthetic wastewaterwithconcentrationsofCODof100gCOD/m3
(equiv-alentto40gC/m3)andammonianitrogen(NH
4–N)of10gN/m3
(i.e.,C/Nratioof 4)asalso usedin Albuquerqueet al.(2009a). Thesyntheticwastewaterwaspreparedwithtapwaterby dilut-ingtheconcentratedsolutionsinthefollowingproportions:2mL/L ofthebuffersolution,0.2mL/Lofthemagnesiumsulphate solu-tion,0.2mL/Lofthecalciumchloridesolution,0.2mL/Loftheiron chloridesolution,0.2mL/Loftheoligoelementssolution,2mL/Lof sodiumacetatesolution,and0.5mL/Lofammoniachloride solu-tion.For theexperiments presented inthe Table1 thefeeding solutioncompositionwaschangedinordertoobtaintheinfluent C/Nratiosof2,4,10and20.Therefore,theappropriate concentra-tionsofCOD(orTOC)andNH4–Nwereobtainedbydilutingthe
concentratedsolutionsofsodiumacetateandammoniachloride, accordingtothevolumespresentedinAlbuquerque(2003).The feedingsolutionwaskeptinastoragetank(ISCOFTD220,Italy) ataconstanttemperatureofapproximately4◦Candpumpedto theBAFreactorthrougha peristalticpump(ISMATECMCPCA4, Switzerland).
2.3. OperationoftheexperimentalBAF
TheoperationoftheBAFreactorinvolvedtwophases: investi-gatingthebackwashingcycleandachievingsteady-stateconditions withaeration(Phase I, 16 days), and performing experimental assays(PhaseII,102days)fordifferentammonianitrogen load-ingrates(NLR)andC/Nratios.Thereactorwaspreviouslyoperated withoutaerationduring152days.Beforetheexperiments,the reac-torwasinoculatedwithbiomassfromanactivatedsludgesystem treating municipal wastewater. The colonizationtook approxi-mately15daysinaclosedcircuit(1L/h)anddiscontinuousfeeding. Approximately38.9mLand9.7mLofacetateandammonia solu-tions, respectively, and a proportional volume of the mineral solutionswereaddedtothereactorevery24hinordertoensure theconcentrationsof100gCOD/m3and10gNH
Fig.1. SchematicrepresentationoftheexperimentalBAF.
asdescribedinAlbuquerqueetal.(2009a).InPhaseII,fourseries of24-hexperimentswithC/Nratiosof2,4,10and20(20assays) wereperformedasdescribedinTable1.
InPhaseI,thebackwashingcyclewasdefinedundernormal operating conditions (i.e., 100g COD/m3 and 10g NH
4–N/m3),
by operating the BAF until the steady-state conditions were broken. The backwashing period was selected in order to not allowthedeteriorationofthesteady-stateconditions.Thehead losses were determined daily in five reactor sections. During steady-state conditions, the measurements of DO, pH, temper-ature, TOC, COD and NH4–N were performed every 2 days in
the influent, P2 and effluent. Backwashing was performed by injectingsimultaneouslyupwardairattheflowrateof5L/m2s
(≈68L/h,≈0.4m3air/m3mediamin)andwaterattheflowrateof
1L/m2.sec(≈14L/h,≈0.3m3water/m3mediamin),during10min.
These conditions were set based on the recommendations of
Mendoza-EspinosaandStephenson(1999),i.e.airflowratesand waterflowratesintherangeof0.4–0.5m3air/m3mediaminand
from0.33to0.35m3air/m3 mediamin,respectively,and are in
the range of flow rates observed in thestudies of Yang et al. (2010)andLiuetal.(2010),5.3L/m2sto15L/m2s(backwashing
airflowrate)and0.18L/m2sto5L/m2s(backwashingwaterflow
rate).
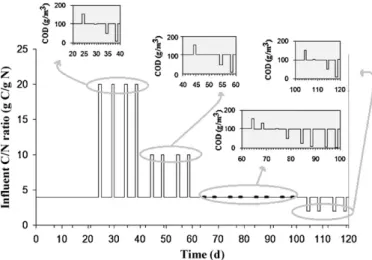
Inthesecondphase,thereactorwasoperatedcontinuously dur-ing102days toperformfour seriesof experiments(altogether 20 assays) by modifying the organic loading and C/N ratio in comparisonwiththesteady-stateconditions(Fig.2).Betweenthe experiments, for approximately 4 days (the period required to attain steady-stateconditions, asshown in Albuquerque,2003), thereactorfeedwasthesameasthatatsteadystate conditions (i.e.,100gCOD/m3and10gNH
4–N/m3).Onthe5thday,the
oper-ating conditions weremodified for each individualexperiment aspresentedinTable1.Ineachassay,measurementsofDO,pH, temperature,TOC,COD,NH4–N,nitritenitrogen(NO2–N),nitrate
nitrogen(NO3–N),totalsuspendedsolids(TSS),volatilesuspended
solids(VSS)andalkalinitywereperformedat12h,16hand20h afterchanging theoperatingconditions (influent,thefive sam-plingportsandeffluent).Indays28,48,74and108,fourgrains ofthemediawerecollectedineachofthefivesamplingportsin ordertoevaluatethebiofilmthicknessvariationsacrossthebed. TOCwasoccasionallydeterminedtocontroltheC/Nratio,whereas CODanalyseswereusedtofollowtheremovalofacetate.
Theaerationratewaskeptat20L/h.Thecontinuousor inter-mittentairflowratesbetween3.5L/hand18L/hareconsidered tobesufficient forthesimultaneousremoval oforganiccarbon andnitrogenaccordingtoSchulzandMenningmann(2008),Chang
Table1
InfluentcharacteristicsfortheexperimentalassaysinPhaseII.
Days Assay pH Temperature(◦C) COD(gCOD/m3) TOC(gC/m3) FeedDO
(gO2/m3) NH4–N(gN/m3) Alkalinity (gCaCO3/m3) C/N(gC/gN) 18–42 A6.2.1. 7.2 19.3 151.1 62.6 7.6 3.1 109.5 20.2 A6.2.3. 7.2 19.5 100.8 41.9 7.4 2.1 102.6 20.0 A6.2.4. 7.2 19.6 50.1 20.8 7.7 1.1 90.8 18.9 A6.2.6. 6.8 19.8 10.8 4.2 7.3 0.2 58.1 21.0 44–62 A7.2.1. 7.2 19.4 152.4 62.5 7.8 6.3 119.5 9.9 A7.2.3. 7.2 18.9 102.3 41.5 7.2 4.3 107.9 9.7 A7.2.4. 7.2 18.9 49.7 20.6 7.9 2.1 88.9 9.8 A7.2.6. 6.9 19.5 3.8 4.3 7.4 0.5 58.4 8.6 64–102 A8.2.1. 7.2 19.5 155.3 62.5 7.4 15.8 126.7 4.0 A8.2.2. 7.2 19.6 131.5 52.2 7.9 12.6 117.9 4.1 A8.2.3. 7.2 20.4 101.8 41.8 7.3 10.2 115.8 4.1 A8.2.4. 7.2 18.8 52.3 20.6 7.7 5.1 95.4 4.0 A8.2.5. 7.1 19.2 25.8 10.2 7.0 2.5 70.2 4.1 A8.2.6. 7.1 18.9 11.2 4.4 7.3 1.1 55.4 4.0 A8.2.7. 6.9 19.5 5.2 2.1 7.2 0.5 39.6 4.2 A8.2.8. 6.8 19.7 3.1 1.0 7.5 0.3 22.5 3.3 104–118 A9.2.1. 7.2 19.2 150.8 62.4 7.6 30.5 123.8 2.0 A9.2.3. 7.3 19.5 102.6 41.6 7.7 20.4 123.8 2.0 A9.2.4. 7.2 19.5 52.3 20.8 7.8 10.2 85.4 2.0 A9.2.6. 7.1 19.1 9.8 4.2 7.6 2.1 52.2 2.0
Fig.2.SchematicrepresentationoftheoperatingconditionsduringPhaseII.
etal.(2008)andHaetal.(2010).Forbothphases,thereactorwas operatedattheflowrateof1L/h(HLRofapproximately0.26m/h). Recentstudiesshowedgoodperformanceforammoniaremovalat HLRupto3m/handairflowratefrom18L/hto200L/h(Schulz andMenningmann,2008;Leietal.,2009;Haetal.,2010;Heetal.,
2007)inBAFcompletelyaeratedfedwithhigherammonia concen-trations(>100gNH4–N/m3).Thehydraulicretentiontime(HRT)
wasapproximately50min,whichisintherange(20minto2h) reportedbyMendoza-EspinosaandStephenson(1999)andHaetal. (2010)fordownflowBAFreactors.Thehydrostaticpressurewas recordeddailyfromeachpiezometer.ThetemperatureintheBAF reactorwaskeptconstantatapproximately20◦Cduringthe exper-imentalphases.
2.4. Analyticalmethods
The DO, pH and temperature were measured with a D201 flowthroughvesselusingprobesSenTix41andCellOx325 con-nectedtotheMulti340imeter(WTW,Germany).Concentrationsof organiccarbonweremeasuredasbothCOD,byclosedreflux diges-tionandtitrimetricmethod(APHA-AWWA-WEF,1999),andTOC usingtheTOC-5000analyzer(Shimadzu,Japan). Concentrations ofNH4–NandNO2–Nweremeasuredthrough
spectrophotome-tryaccordingtotheStandardMethods(APHA-AWWA-WEF,1999), whereas NO3–N concentrations were measured using LCK 339
cuvettetest(0.23–13.5gNO3–N/m3)andtheCadas50
spectropho-tometer (HACH-LANGE, Germany). TSS and VSS concentrations weredeterminedbythegravimetricmethodusing0.45mpore sizefilters(APHA-AWWA-WEF,1999).Alkalinitymeasurements
Table2
AmmonialoadingratesandammoniaremovalratesintheexperimentsofPhaseII.
Assays C/N NLRa(gN/m3d) r NH4N(gN/m 3d) MT-P2 P2–P4 P4-MB MT-MBa A6.2.1. 20 91.8 94.4 26.4 14.4 34.6 A6.2.3. 62.2 69.0 30.4 0.0 27.8 A6.2.4. 32.6 52.5 9.6 0.0 13.6 A6.2.6. 5.9 0 0 0 0 A7.2.1. 10 186.6 212.9 35.2 12.3 60.4 A7.2.3. 127.3 205.4 24.0 4.8 51.5 A7.2.4. 62.2 76.5 36.0 0.0 33.2 A7.2.6. 14.8 0 0 0 0 A8.2.1. 4 467.9 860.5 103.9 66.5 237.2 A8.2.2. 373.1 586.1 43.2 50.0 153.4 A8.2.3. 302.0 577.2 72.8 20.6 149.8 A8.2.4. 151.0 226.4 28.8 27.4 67.2 A8.2.5. 74.0 45.0 12.8 19.2 21.9 A8.2.6. 32.6 0 0 0 0 A8.2.7. 14.8 0 0 0 0 A8.2.8. 8.9 0 0 0 0 A9.2.1. 2 903.2 2149.7 310.2 56.2 563.8 A9.2.3. 604.1 1133.3 544.5 63.7 453.1 A9.2.4. 302.0 632.6 80.0 40.4 172.0 A9.2.6. 62.2 0 0 0 0
aCalculatedbasedonthetotaleffectivemediavolume(MT-MB):0.00081m3.
were performed by titration (APHA-AWWA-WEF, 1999). The biofilmthicknesswasevaluatedusinganelectronicmicroscope (HitachiS2700,Japan)afterdehydratationofthesample (substra-tum/biofilm)withacetone.
3. Resultsanddiscussion
3.1. PhaseI–steadystateconditions
Theconcentrationsof ammoniaobservedinboth phasesare presentedinFig.3(a).Therewasnodetectionofsignificant concen-trationsofnitrite(0.1–0.2gNO2–N/m3)inallthesamplingpoints
forPhasesIandII.Steady-stateconditionswereevaluatedthrough theNH4–Nloadremoval(Fig.3(b))thatwasattainedinsections
MT-P2,P2–P4andP4–MBafterapproximately8daysofthe con-tinuousoperation.TheBAFperformancewasanalysedforsections MT-P2(aeratedsection,aerobic),P2–P4(sectionwithresidual oxy-gen,anoxic)andP4-MB(non-aeratedsection,anaerobic).
The average COD concentrations were 100.7±0.6g/m3,
60.6±7.1g/m3,38.4±2.2g/m3 and28.8±1.3g/m3,respectively,
in theinfluent,P2, P4 and effluent(considering9samples and a 95% confidence interval), which corresponds toaverage COD removal efficiencies(RE)of 40%,35% and 25%,respectively, for sections MT-P2, P2–P4 and P4-MB and an overall RE of 71%. The average NH4–N concentrations at the same points were
10.6±0.2g/m3, 6.7±0.7g/m3, 5.8±0.7g/m3 and 5.4±0.6g/m3,
whichcorrespondstoaverageREofNH4–Nof37%,15%and6%,
respectively,forsectionsMT-P2,P2–P4andP4-MBandanoverall REof50%.
Comparing with results obtained in a previously study (Albuquerqueetal.,2009a),inthesamereactor,butwithout aer-ation,theintroductionofaerationintheupperpartofthereactor (first8cm)ledtoanincreaseintheoverallREofCOD,from18% to71%,andammonia,from28%to50%.Approximately56%ofCOD and74%ofammoniawereremovedintheaeratedsectionMT-P2, whichcontrastswiththe90%efficiencyobservedforboth com-poundsundernon-aerated conditionsforthesamesection.The introductionofaerationdidnotinfluencethetimenecessaryto attainsteady-stateconditionssinceitwasobservedthesame8days afterthestart-upand8hafterwashing.However,thebackwashing cyclewasreducedto5hofoperation.Ittook5htoreachanoverall
headlossof5cmcomparedto10hwhenthereactorwasnot aer-ated.Thisdifferencecanbeexplainedbytheturbulencecausedin sectionMT-P2duetotheintroductionofair,aswellasduetothe productionoflargeamountofbiomassthatledtoaquickclogging ofthebed.
The DO concentrations were stable with average val-ues of 7.6±0.1gO2/m3, 3.3±0.3gO2/m3, 0.5±0.1gO2/m3 and
0.3±0.03gO2/m3,respectively,intheinfluent,P2,P4andthe
efflu-ent.TheconcentrationsofTSSandVSSinP2andP4were60±5g TSS/m3 and 45±5gTSS/m3 and 38±3gVSS/m3 and 18±2g
VSS/m3,respectively,whichcorrespondstoaVSS/TSSratioof0.63
and0.40,respectively,inthesetwopoints(i.e.,morebiomasswas producedinthesectionMT-P2).
After5daysofoperationatsteady-stateconditions,thehead lossesinthesectionMT-P2increasedquickly(from5cmto9.5cm forday5andday6,respectively)duetocloggingofthebed.Asa consequence,theremovalofCODandammoniadecreasedquickly and thesteady-stateconditions became deteriorated.Therefore, backwashingwasscheduledevery5daysduringcontinuous opera-tion,whichcorrespondedtoamaximumheadlossof5cmallowed fortheBAFreactor.8hafterthebackwashing,thesteady-state con-ditionswereobservedagain,andCODandammoniaremovalwere fullyrecoveredafteranother2h.
3.2. PhaseII–longtermoperation
In Phase II, the ammonia and COD concentrations changed withvaryinginfluentconditions.Itwasfound,however,thatthe steady-stateconditionsreturnedinapproximately12haftereach assay.RegardlessoftheappliedC/Nratio,therewasno signifi-cantremovalofNH4–Nin theassayswithlowestinfluentCOD
concentrations(from3.1gCOD/m3 to11.2gCOD/m3)andlowest
influentNH4–Nconcentrations(from0.3gN/m3to2.1gN/m3),i.e.
theassaysA6.2.6.,A7.2.6.,A8.2.6.,A8.2.7.,A8.2.8.andA9.2.6.).i.e., thereisnoremovalofammoniaforNLRbelow15gN/m3d.Xia
etal.(2008)observedthatthepopulationofnitrifierswasininverse proportiontoC/Nratioincarrierbiofilmreactors.
ThepHslightlyincreasedthroughoutthereactordepth reach-inghighereffluentvaluesintheexperimentswithhigherammonia removal:7.2(influent)to7.7(effluent)inassays8.2.1.and8.2.2.; (C/N=4)7.1(influent)to7.8(effluent)inassays9.2.1.,9.2.3.and
Fig.4.TypicalDO(blueline)andpH(blackline)profilesintheexperimentsofPhaseII.(Forinterpretationofthereferencestocolorinthisfigurelegend,thereaderis referredtothewebversionofthearticle.)
9.2.4. (C/N=2). The values of alkalinity also increasedin those assays. This findingis in contradiction withammonia removal via nitrification. The reactor was aerobic in most of its depth (Fig.4),whichfavouredammoniaoxidationtonitriteandnitrate (andresultedinalkalinityconsumption).However,theremoval ofacetate(determinedasCOD)underaerobicconditionswasalso higherforC/Nratiosof2and4and,asreportedbyGradyetal. (1999), the respective pathway produced alkalinity. Therefore, theproductionofalkalinityduetoacetateoxidationwasgreater thanitsconsumptionbynitrification.TheaverageDO concentra-tionsrangedfrom3.1gO2/m3 to4.1gO2/m3 (P1),2.1gO2/m3 to
3.8gO2/m3 (P2), 0.5gO2/m3 to1.1gO2/m3 (P3), 0.4gO2/m3 to
0.8gO2/m3(P4)and0.2gO2/m3to0.8gO2/m3(P5),confirmingthe
aerobicconditionsinsectionMT-P2.
Removalratesarenormallybasedoneffectivereactorvolume (Mendoza-Espinosa and Stephenson, 1999; Grady et al., 1999; Stephensonetal.,2003;Changetal.,2008;Haetal.,2010).The removalofammoniastartedtobesignificantforNLRabove32.6g
N–NH4/m3.d (assay A6.2.4., C/N=20).The higherremoval rates
of ammonia (rNH4N) were observed in the experiments with a
lowC/Nratio(2) andforthehigherNLR,ascanbeobservedin
Table2.Theseresultsmaybeexplainedbythehigher develop-mentofnitrifiersforlowC/NratioasobservedbyXiaetal.(2008). The observed REin theassays varied in the following ranges: 37.7–44.8%(C/N=20),32.4–53.3%(C/N=10),29.6–50.7%(C/N=4) and57–75%(C/N=2).Theoverallremovalratesofammonia(13.6g N–NH4/m3dto563.8gN–NH4/m3d)areinagreementwiththe
val-ues(upto1300gN–NH4/m3d)suggestedbyMendoza-Espinosa
andStephenson(1999)fordownflowBAFwithHRTbetween0.4h and1.3h.Awiderangeofefficiencies(10–90%)havebeenreported forlab-scaleRBCstreatingammoniumrichwastewateratlowC/N ratios(Helmeretal.,1999;Pynaertetal.,2002).TheREforCOD removalrangedbetween26%(C/N=20)and79%(C/N=2).
Regardless the C/N ratio, most of ammonia removal was observedinsectionMT-P2:54–74%(C/N=20),53–79%(C/N=10), 41–76%(C/N=4)and49–75%(C/N=2).Foralltheassays,between
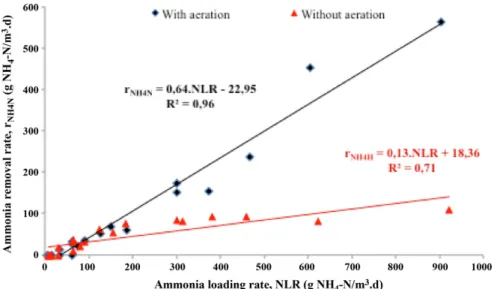
Fig.6.CorrelationbetweenammonialoadingratesandammoniaremovalratesfortheexperimentsofPhaseII(blackline)andfortheexperimentswithoutaeration(red line,analysedinAlbuquerqueetal.,2009a).(Forinterpretationofthereferencestocolorinthisfigurelegend,thereaderisreferredtothewebversionofthearticle.)
82%and 100% ofammonia removaloccurredin sectionMT-P4, whichcanberelatedtothemajoravailabilityofDOandthehigher biofilmthicknessinsectionMT-P2(between0.4and0.6mm),as showninFig.5foroneassayatC/N=4(A8.2.3.)andanotherat C/N=2(A9.2.3.).Themeasuredaveragebiofilmthicknessin P1, P2andP4,duringsteady-stateconditionswas0.47±0.05mm(P1), 0.28±0.05mm(P2)and0.02±0.01mm(P4).
Regression analysis between applied and removed loads of NH4–N showed a linear correlation between both variables
(R2=0.96,p<0.05),whichwasstrongercomparedtotheperiod
when the biofilter was operated without aeration (R2=0.71,
p<0.05,Fig.6).Therefore,regardlessofC/Nratio,theNH4–Nloads
influencedtherespectiveremovalratesfortherangeofapplied loadsinthisstudy.
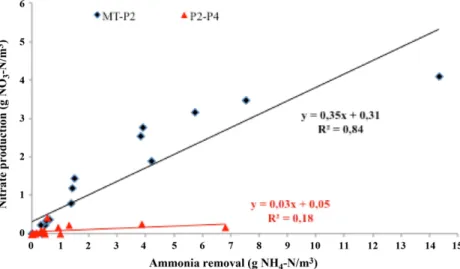
InsectionMT-P2,wheremostoftheammonianitrogenwas removed,significant nitrateproduction wasobserved. Between 85%and100%ofthenitrategeneratedinthereactorwasdetected insectionMT-P2andlessthan20%wasproducedinsectionP2–P4. Such results were expected since the DO concentrations were higher in sectionMT-P2 (between2.1gO2/m3 and 4.1gO2/m3)
thaninthesectionP2–P4(0.4gO2/m3 to1.1gO2/m3).Astrong
linear relationship (R2=0.84, p<0.05) was observed between
ammoniaremovalandnitrateproductioninsectionMT-P2(Fig.7). Thisconditionsuggeststhatpracticallyalltheoxidizedammonia inthatsectionwastransformedtonitratebynitrification.
There was no removal of nitrate until sampling point P4, which can be explained by the presence of DO concentrations over2gO2/m3,butupto30.7%ofthenitrate(maximumremoval
rate of 53gN/m3d) was removed in the lower section of the
reactor(P4-MB),wheretheDOrangedbetween0.4gO2/m3 and
0.8gO2/m3. Thatvalue is lowerthan the values (upto 5,000g
N–NO3/m3d) suggested by Mendoza-Espinosa and Stephenson
(1999)foradownflowBAFwithHRTbetween0.4hand1.3h. How-ever,between4%and18%ofammoniawasalsoremovedinsection P4-MB.
Theseobservationssuggestthatnitrificationanddenitrification occurredsimultaneouslyinthelast sectionofthereactor. Simi-larobservationwasmadebyPynaertetal.(2002)inalab-scale RBCoperatedunderoxygen-limitedconditions.AccordingtoGrady et al. (1999), denitrificationunder anoxic environments occurs preferablyatDOconcentrationsunder0.2gO2/m3(criticalvalue),
althoughinsectionP4-MBtheremovalofN–NO3 wasobserved
inthepresenceofDOconcentrationsoverthatvalue.These cir-cumstancesmaysuggestbothgoodadaptationcapacityofnitrifiers anddenitrifierstolowsubstrateconcentrations,andtheabilityof somespecies ofmicroorganismtooxidizeammoniaand reduce nitrateinthepresenceofDO(concentrationsbetween0.4gO2/m3
and0.8gO2/m3).
EvenknowingthatsubmergedBAFmayallowagood perfor-mancefornitrogenremoval,somenitrogenremovalpathwaysstill remainpoorlyunderstood(Littletonetal.,2003;Garzon-Zuniga etal.,2005).Thecombinednitrification–denitrificationprocesses havebeenconsideredtobethemostcommonmethodfornitrogen removalfromwastewateranditisassumedthateachoneofthese mechanismsisattributedtodifferentfunctionalbacterialgroups.
However,Yuetal.(2007)observedthenitrogenlossandDO paradoxinfull-scalebiofiltersfordrinkingwatertreatment.The observednitrateproductionandDOconsumptionwere substan-tiallylowercomparedtothetheoreticalstoichiometricamounts requiredfornitrificationandaerobicdeammonificationwas iden-tifiedasthemostprobablemechanismthatcouldexplainthose occurrences.SimilarconclusionshavebeendrawnbyAlbuquerque etal.(2009a) whennitrogen removalandoxygenconsumption could not be explained by well-knownmechanisms in a non-aerateddownflowbiofilter.Nitrogenloseswerenotwellexplained inanotherstudiesusingahorizontalsubsurfaceflowconstructed wetlands(Albuquerqueetal.,2009b;Bialowiecetal.,2012a,b).Ahn (2006)andParedesetal.(2007)pointedoutthatalternativenitrate removalpathwayssuchasautotrophicdenitrificationuses hydro-gen,sulphurcompounds,ammonia,nitriteandnitrateasenergy sourceandinorganiccarbonsources.Suchchemolithoautotrophic bacteriaasNitrosomonasareabletonitrifyanddenitrifyinlowDO concentrations(Mulderetal.,1995;Schmidtetal.,2003).
Inbiofilmreactors,lowDOconcentrationsusuallyleadtoa sta-ble,upto100%NO2–Naccumulation(Paredesetal.,2007).Those
authorshypothesizedthatNO2–Noxidizersaremoreexposedto
oxygenlimitingconditionsthanNH4–Noxidizers,sincethe
for-meronesarelocatedoutsidethebiofilm,whereasthelater are foundinthedeeperlayerofthebiofilm.Thisisincontradictionto ageneralopinionthatfastergrowingheterotrophstendto domi-natetheouterpartofabiofilm,whilenitrifiersoccuralongwith inertsclosertothesubstratum(Wanneret al.,2006).Khinand Annachhatre(2004)suggestedthatunderDOlimitedconditions (<0.5%airsaturation)aco-cultureofaerobicandanaerobicNH4–N
Fig.7.CorrelationbetweenammoniaremovalandnitrateproductionobservedinsectionMT-P2(blackline)andsectionP2-P4(redline).(Forinterpretationofthereferences tocolorinthisfigurelegend,thereaderisreferredtothewebversionofthearticle.)
oxidizingbacteria(ANAMMOX)canbeestablished,andthissystem is responsible for theprocess termed CANON,OLAND or aero-bicdeammonification.The interactionofaerobic and anaerobic NH4–NoxidizingbacteriaunderDOlimitedconditionsresultsin
almostcomplete conversionofNH4–NtoN2 gas,whereas only
smallamountsofNO3–Nareproduced.
Therefore,differentoperationproceduresofBAFmaybe sched-uledinordertomeetdifferentcriteriaforthefinaleffluent.Theuse ofaerationinpartofthereactormayallowforasuperiorreduction oforganiccompounds andammonia nitrogen,withno guaran-teeof highreduction of nitrate.This proceduremay, however, beusefulwhenevertheconcentrationofnitratedoesnotbecome detrimentaltoeffluentreusepurposesordoesnotproduce signifi-cantenvironmentalimpactsonreceivingenvironments.Theuseof intermittentaerationmay,therefore,beaninterestingoption. Dur-ingtheaerationphase,highcarbonandammonianitrogenremoval ratesmaybeachieved.Thenitrateproducedbynitrificationmaybe eliminatedduringthenonaerationphaseasaresultofestablishing favourableanoxicareas.
4. Conclusions
Within the applied ranges of loading rates of ammo-nia (6gN/m3.d to 903gN/m3d) and organic compounds (48g
COD/m3dto2,391gCOD/m3d),theresultsshowedthatthe
par-tially aerated BAF used in this study allowed carbon removal, nitrification and denitrification simultaneously, at significant removalrates.However,ammoniaremovalwasnotobservedfor NLRbelow15gN–NH4/m3.d.Thelong-termoperationoftheBAF
reactorwascharacterizedbystableandrelativehighremoval effi-cienciesintermsofbothCOD(<80%)andNH4–N(<75%).Between
50% and 70% of ammonia removal occurredin theupper sec-tionoftheBAF(MT-P2),wherelargerbiofilmdevelopmentwas observedandDOconcentrationsremainedover2.1gO2/m3.The
appliedNLRsignificantlyinfluencedtheremovalratesofammonia forNLRabove32.6gN–NH4/m3d.Atthereactorbottom(P4-MB),
simultaneousnitrificationanddenitrificationwasobservedatDO concentrationsbetween0.4gO2/m3 and 0.8gO2/m3.Theuseof
submergedBAFpartiallyaeratedfortheremovaloflow concentra-tionsofcarbonandnitrogenformsappearstobeanadvantageous polishingsolution,whichcanbeusedtoproduceeffluentsforreuse purposesortoreducenitrogenloadstobedischargedintostreams.
References
Ahn,Y.,2006.Sustainablenitrogeneliminationbiotechnologies:areview.Process. Biochem.41,1709–1721.
A.Albuquerque,2003.Contributiontothestudyofresidualcarbonremovalin down-flowbiologicalpackedbeds,Ph.D.Thesis,UniversityofBeiraInterior,Covilha, Portugal,pp.469(inPortuguese).
Albuquerque,A.,Makinia,J.,Pagilla,K.,2009a.Investigationofnitrogenremoval pathwaysinabiologicalpackedbedreactorusingelementarymassbalances. In:ProceedingsoftheWEF2ndSpecialtyConferenceonNutrientRemoval2009: SustainableTreatmentSolutions(CD-ROM),Washington,USA,June28–July1, WEF,Alexandria,USA,pp.117–135.
Albuquerque,A.,Oliveira,J.,Semitela,S.,Amaral,L.,2009b.Influenceofbedmedia characteristicsonammoniaandnitrateremovalinshallowhorizontal subsur-faceflowconstructedwetlands.Biores.Technol.100,6269–6277.
APHA-AWWA-WEF,1999.StandardMethodsfortheExaminationofWaterand Wastewater,20thedition.AmericanPublicHealthAssociation,Washington,DC, USA,pp.1325.
Bialowiec,A.,Davies,L.,Albuquerque,A.,Randerson,P.,2012b.Theinfluenceof plantsonnitrogenremovalfromlandfillleachateindiscontinuousbatchshallow constructedwetlandwithrecirculatingsubsurfacehorizontalflow.Ecol.Eng.40, 44–52.
Bialowiec,A.,Davies,L.,Albuquerque,A.,Randerson,P.,2012a.Nitrogenremoval fromlandfillleachateinconstructedwetlandswithreedandwillow:redox potentialintherootzone.J.Environ.Manag.97,22–27.
Buitrón,G., Quezada, M., Moreno, G., 2004. Aerobic degradation of the azo dye acid red in a sequencing batch biofilter. Biores. Technol. 92 (2), 143–149.
Chang,Y.,Henkel,J.,Meda,A.,Wagner,M.,Cornel,P.,2008.Comparisonof tech-niquesingreywatertreatment.In:Proceedings oftheIWAConferenceon SanitationOptionsintheAsia-Pacific(CD-Rom),Hanoi,Vietnam,November 18–20,IWA,London,UK.
Farabegoli,G.,Chiavola,A.,Rolle,E.,2009.Thebiologicalaeratedfilter(BAF)as alter-nativetreatmentfordomesticsewage.Optimizationofplantperformance.J. Hazard.Mater.171(1–3),1126–1132.
Garzon-Zuniga,M.,Lessard,P.,Aubry,G.,Buelna,G.,2005.Nitrogenelimination mechanismsinanorganicmediaaeratedbiofiltertreatingpigmanure.Environ. Technol.26,361–371.
GradyJr.,C.,Daigger,G.,Lim,H.,1999.Biologicalwastewatertreatment.In:Revised andExpanded,2ndedition.MarcelDekker,NewYork,USA,pp.1076. Ha,J.,Ong,S.,Surampalli,R.,2010.Impactofmediatypeandvariousoperating
parametersonnitrificationinpolishingbiologicalaeratedfilters.Environ.Eng. Res.15(2),79–84.
He,S.,Xue,G.,Kong,H.,2007.TheperformanceofBAFusingnaturalzeoliteas fil-termediaunderconditionsoflowtemperatureandammoniumshockload.J. Hazard.Mater.143,291–295.
Helmer,C.,Kunst,S.,Juretschko,S.,Schmid,M.C., Schleifer,K.H.,Wagner,M., 1999.Nitrogenlossinanitrifyingbiofilmsystem.WaterSci.Technol.39(7), 13–21.
Hidaka,T.,Tsuno,H.,2004.Developmentofabiologicalfiltrationmodelappliedfor advancedtreatmentofsewage.WaterRes.38,335–346.
Jenssen,P.,Krogstad,T.,Paruch,A.,Mæhlum,T.,Adam,K.,Arias,C.,Heistad,A., Jonsson,L.,Hellström,D.,Brix,H.,Yli-Halla,M.,Vråle,L.,Valv,M.,2010.Filterbed systemstreatingdomesticwastewaterintheNordiccountries–performance andreuseoffiltermedia.Ecol.Eng.36(12),1651–1659.
Jeong,J.,Hidaka,T.,Tsuno,H.,Oda,T.,2006.Developmentofbiologicalfilteras tertiarytreatmentforeffectivenitrogenremoval:biologicalfilterfortertiary treatment.WaterRes.40,1127–1136.
Khin,T.,Annachhatre,A.,2004.Novelmicrobialnitrogenremovalprocesses.Biotech. Adv.22,519–532.
Lei,G.,Qi,B.,Wang,Z.,Wang,J.,2009.Treatmentofmunicipalsewagebybiological aeratedfilter(BAF)usingburnedclaypelletasmedia.Int.J.Environ.Pollut.37 (2–3),186–204.
Littleton,H.,Daigger,G.,Strom,P.,Cowan,R.,2003.Simultaneousbiologicalnutrient removal:evaluationofautotrophicdenitrification,heterotrophicnitrification, andbiologicalphosphorusremovalinfull-scalesystems.WaterEnviron.Res. 75,138–150.
Liu,Y.,Yang,T.,Yuan,D.,Wu,X.,2010.Studyofmunicipalwastewater treat-mentwithoystershellasbiologicalaeratedfiltermedium.Desalination254, 149–153.
Mendoza-Espinosa,L.,Stephenson,T.,1999.Areviewofbiologicalaeratedfiltersfor wastewatertreatment.Environ.Eng.Sci.16,201–216.
Mulder,A.,vandeGraaf,A.,Robertson,L.,Kuenen,J.,1995.Anaerobicammonium oxidationdiscoveredinadenitrifyingfluidizedbedreactor.FEMMicrob.Ecol. 16(3),177–184.
Paredes,D.,Kuschk,P.,Mbwette,T.,Stange,F.,Müller,R.,Köser,H.,2007.Newaspects ofmicrobialnitrogentransformationsinthecontextofwastewatertreatment –areview.Eng.LifeSci.7(1),13–25.
Pynaert,K.,Sprengers,R.,Laenen,J.,Verstraete,W.,2002.Oxygen-limited nitrifi-cationanddenitrificationinalab-scalerotatingbiologicalcontactor.Environ. Technol.23,353–362.
Schmidt,I.,Sliekers,O.,Schmid,M.,Bock,E.,Fuerst,J.,Kuenen,J.,Jetten,M.,Strous,M., 2003.Newconceptsofmicrobialtreatmentprocessesforthenitrogenremoval inwastewater.FEMSMicrob.Rev.27,481–492.
Schulz,J.,Menningmann,G.,2008.Submergedfixed-bedreactors.In:Rehm,H.,Reed, G.(Eds.),Biotechnology:EnvironmentalProcessesI,vol.11a.,2ndedition.Wiley VCH,Weinheim,Germany.
Stephenson,T.,Pollard,S.,Cartmell,E.,2003.Feasibilityofbiologicalaeratedfilters (BAF)forleachatetreatment.In:Proc.9thInternationalWasteManagementand LandfillSymposium(CD-Rom),S.MargheritadiPula,Cagliari,Italy,Oct.6–10, CISA,Italy,pp.10.
Tchobanoglous,G.,Burton,F.L.,Stensel,H.D.,2003.WastewaterEngineering. Treat-mentandReuse,4thEdition.McGraw-Hill,NewYork,USA.
Villaverde,S.,Fdz-Polanco,F.,Garcia,2000.Nitrifyingbiofilmacclimationtofree ammoniainsubmergedbiofilters:startupinfluence.WaterRes.34(2),602–610. Wanner,O.,Eberl,H.,Morgenroth,E.,Noguera,D.,Picioreanu,C.,Rittmann,B.,van Loosdrecht,M.,2006.MathematicalModelingofBiofilms,Scientificand Tech-nicalReportNo.18.IWAPublishing,London,UK.
Yang,J.,Liu,W.,Li,B.,Yuan,H.,Tong,M.,Gao,J.,2010.Applicationofanovel backwashingprocessinupflowbiologicalaeratedfilter.J.Environ.Sci.22(3), 362–366.
Yu,X.,Qi,Z.,Zhang,X.,Yu,P.,Liu,B.,Zhang,L.,Fu,L.,2007.Nitrogenlossandoxygen paradoxinfull-scalebiofiltrationfordrinkingwatertreatment.WaterRes.41, 1455–1464.
Xia,S.,Li,J.,Wang,R.,2008.Nitrogenremovalperformanceandmicrobial com-munitystructuredynamicsresponsetocarbonnitrogenratioinacompact suspendedcarrierbiofilmreactor.Ecol.Eng.32(3),256–262.