DEGRADATION OF PERSISTENT PESTICIDES VIA ADVANCED OXIDATION AND REDUCTIVE PROCESSES
Este exemplar foi revisado e corrigido em relação à versão original, sob responsabilidade única do autor e com a anuência de seu orientador. São Paulo, ______ de ____________________ de __________
Assinatura do autor: ________________________
Assinatura do orientador: ________________________
Catalogação-na-publicação
Graça, Cátia
DEGRADATION OF PERSISTENT PESTICIDES VIA ADVANCED OXIDATION AND REDUCTIVE PROCESSES / C. Graça -- versão corr. -- São Paulo, 2017.
187 p.
Tese (Doutorado) - Escola Politécnica da Universidade de São Paulo. Departamento de Engenharia Química.
DEGRADATION OF PERSISTENT PESTICIDES VIA ADVANCED OXIDATION AND REDUCTIVE PROCESSES
Tese apresentada à Escola Politécnica da Universidade de São Paulo para obtenção do título de Doutor em Ciências
DEGRADATION OF PERSISTENT PESTICIDES VIA ADVANCED OXIDATION AND REDUCTIVE PROCESSES
Tese apresentada à Escola Politécnica da Universidade de São Paulo para obtenção do título de Doutor em Ciências
Área de Concentração: Engenharia Química
Orientador: Prof. Dr. Antonio Carlos Silva Costa Teixeira
Co-orientador: Drª. Adriana Correia de Velosa
“Para ser grande, sê inteiro: nada Teu exagera ou exclui. Sê todo em cada coisa. Põe quanto és
No mínimo que fazes. Assim em cada lago a lua toda
Brilha, porque alta vive.”
AGRADECIMENTOS
Uma tese é pouco para agradecer a todos os que me ajudaram neste caminho. Em primeiro lugar agradeço aos meus Pais que, mesmo sofrendo com a minha partida, nunca deixaram de me incentivar a seguir os meus sonhos, mesmo sendo a 8000 km de casa e “por mares nunca d’antes navegados”. Sem o vosso apoio incondicional não existiria esta tese, esta aventura, ou até mesmo nada do que conquistei até hoje. A vocês devo tudo. Ao Prof. Dr. Antonio Carlos Teixeira, pela oportunidade, orientação e compreensão ao longo dos últimos três anos.
À Dr.ª Adriana Correia de Velosa por todos os ensinamentos, incentivos e “puxões de orelha”, os quais me ajudaram a crescer na ciência e a olhá-la de um novo prisma.
Ao Ricardo, por todo o amor, paciência (muita!) e companheirismo ao longo desta aventura, que sem os quais tudo teria sido mais difícil.
Aos meus amigos e familiares de Portugal, que apesar da distância, sempre se fizeram sentir perto.
À família portuguesa que encontrei no Brasil, por terem ajudado a levar tudo de forma mais leve e a sentir menos saudades de casa.
Aos meus colegas de laboratório, especialmente Marcela Prado Silva, Arlen Costa, Danielle Matsumoto, Ana Paula, Christiane Fonseca, Flaviane Santos, Leandro Goulart, Paty Metolina, Bruno Ramos e Leonardo Diniz, pelo apoio durante a execução do trabalho e pelos momentos de descontração nas horas de maior pressão.
Aos alunos de graduação Lucas Fujita e Flávio Chiquetto, pela ajuda na execução das experiências, sem a qual não teria conseguido dar conta de concluir todos os trabalhos em tempo recorde.
diferentes metais de valência zero e partículas bimetálicas, do pesticida organoclorado CP. Além do amplamente explorado Fe0, outros metais podem ser aplicados neste processo, pelo que, neste estudo, explorou-se a potencialidade de Zn0 e Cu0 comparativamente ao primeiro. Ainda neste estudo foram investigadas duas formas de aumentar a reatividade dos metais: i) no caso do Fe0 e Zn0, revestindo com um metal mais nobre (Cu), por forma a observar o efeito catalisador do último no sistema bimetálico; ii) realizando um pré-tratamento à superfície dos metais.
effectiveness of Zn0 and Cu0 was also explored in comparison to that widely reported for ZVI. Furthermore, two different ways of enhancing metals reactivity were here explored: i) by coating ZVI or Zn0 with a more noble metal (Cu), in order to analyze the copper catalytic effect on the bimetallic system; ii) by different surface pretreatments.
Figure 1. Pesticides sales in Brazil by type of pesticide………..……….…04
Figure 2. Structural chemical formula of amicarbazone………...…06
Figure3. Chemical structure of chlorpyrifos………07
Figure 4. Structural chemical formula of persulfate………...………...…15
Figure 5. Experimental apparatus………...………....……..…23
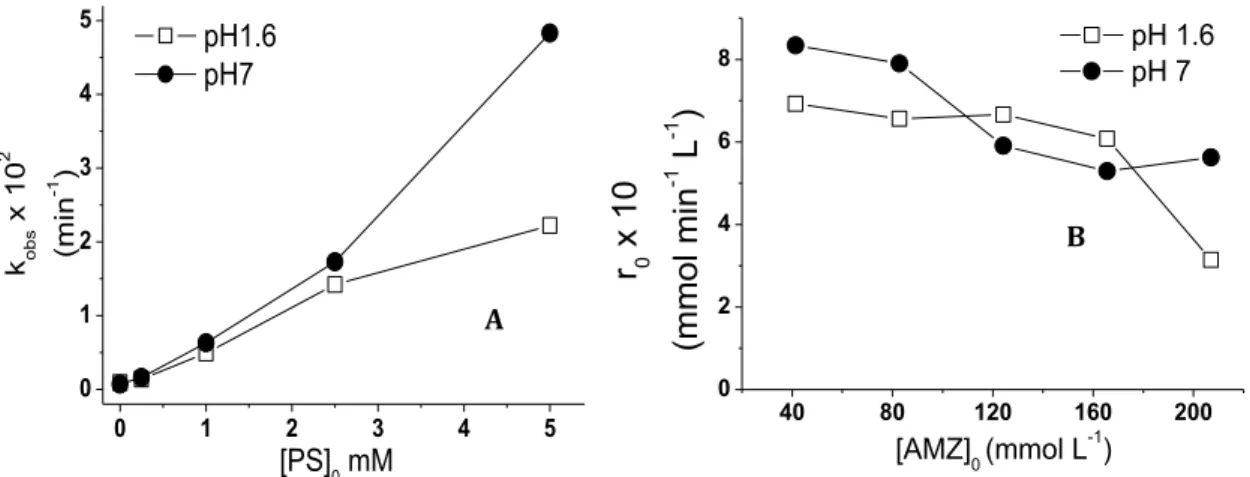
Figure 6.(A) Effect of PS on measured kobs; (B) Effect of AMZ initial concentrations on the initial AMZ degradation rate, r0. Conditions: (A) [AMZ]0= 41.4 µmol L-1, 0<[PS]0<5 mmol L-1; (B) [PS]0= 5 mmol L-1, 41.4 <[AMZ]0< 207.2 µmol L-1. Error bars are not included since they are smaller than the symbols.………..25
Figure 7. Effect of Fe(II) addition on AMZ degradation driven by PS/UVA at free pH. () Sole Fe(II), () Sole PS, (●) Fe(II)/PS, () PS/UVA, () Fe(II)/PS/UVA. Experimental conditions: [AMZ]0= (41.4±8) µmol L-1, [Fe(II)]0=0.134 mmol L-1, [PS]0= 2.5 mmol L-1. Error bars are not included since they are smaller than the symbols……..28
Figure 8.AMZ (--, left side) degradation by Fe(III)/UVA system (kobs = 0.04 ± 4.8×10 -4 min-1) and [Fe(II)] (--, right side) measurement during the reaction. Experimental conditions: [AMZ]0= (41.4±8) µmol L-1, [Fe(III)]0= 0.134 mmol L-1, free pH……...…..29
Figure 9. Effect of different Fe(III) complexes: Fe(III)-aqua complex (--); Fe(III)-oxalate (--); Fe(III)-citrate (--); Fe(III)-tartrate (--) on (A) AMZ degradation promoted by the PS/UVA system and (B) Fe(II) concentration along the reaction time. Experimental conditions: [AMZ]0 = (41.4±8) µmol L-1, [PS]0 = 2.5 mmol L-1, [Fe(III)] = 0.1 mmol L-1, Fe(III):ligand ratio: 1 Fe(III):3 oxalato, 1 Fe(III):2 citrate, and 1 Fe(III):1 tartrate, free pH. Error bars are not included since they are smaller than the symbols…..32
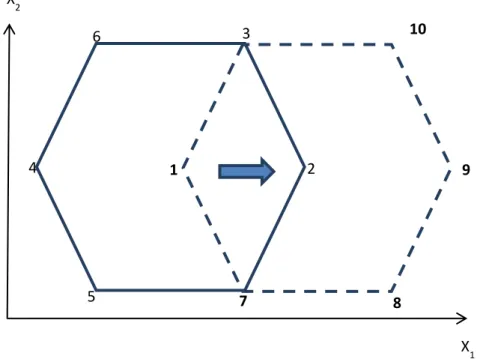
Figure 10. Displacement of the original two-factor Doehlert design for the FeIII-oxalate system……….…38
Figure 11. (A) Response surface including the experimental points (pink dots) and (B) contour plot for kobs, varying the Fe(III):oxalate ratio from 0 to 1:11 and pH from 3.5 to 8.5……….. 40
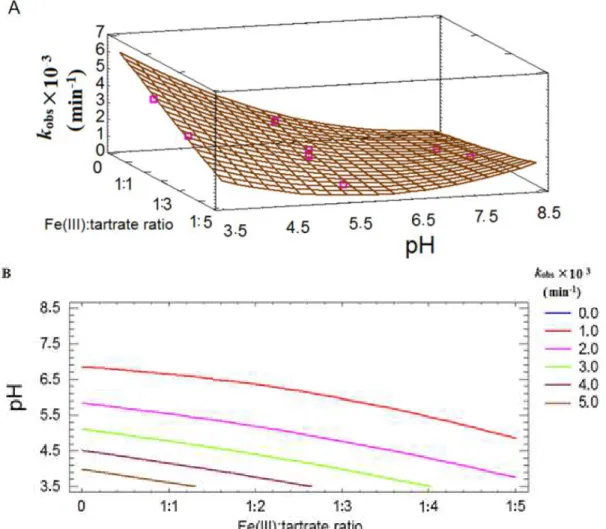
Figure 12. (A) Response surface including the experimental points (pink dots) and (B) contour plot for kobs, varying the Fe(III):citrate ratio from 0 to 1:5 and pH from 3.5 to 8.5………..…….43
Figure 13. Effect of Fe(III):tartrate ratio concentration on AMZ degradation profile. () – Fe(III)-aquacomplex, () Fe(III):tartrate= 1:1, (●) Fe(III):tartrate = 1:2; () Fe(III):tartrate = 1:4, () Fe(III):tartrate = 1:10. [AMZ]0 = (41.4±8) µmol L-1 and [Fe(III)]0= 0.1 mmol L-1, pH=3.5………..…46
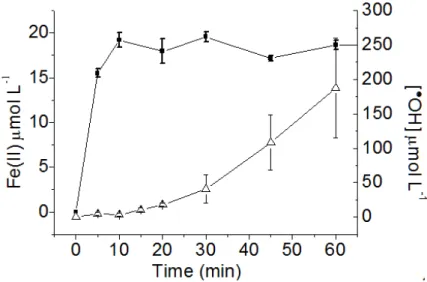
Figure 15. Formation of Fe(II) ( , left scale, during AMZ degradation) and •OH (
right scale, in the presence of bezene) from irradiated Fe(III)-aquacomplex at pH 3.5. [AMZ]0 = 41.4 µmol L-1 and [Fe(III)]0= 0.1 mmol………...48
Figure 16. (A) H2O2, (B) Fe(II) photo-production and (C) AMZ degradation (white dots, left scale) vs. •OH photo-production (black dots, right scale) induced by irradiated Fe(III)-oxalate (0.1: 1 mmol L-1) (square symbol), Fe(III)-citrate (0.1: 0.4 mmol L-1) (triangle symbol) and Fe(III)-tartrate (0.1:0.1 mmol L-1) (circle symbol) . [AMZ]0= (41.4 ± 8) µmol L-1; pH = 3. 5………..………..49
Figure 17. Comparison between AMZ degradation promoted by A1) Fe(III)-oxatale (1:10), B1) Fe(III)-citrate (1:4) and C1) Fe(III)-tartrate (1:1) photolysis in deionized water and real water, for 1:10 (Fe(III):oxalate), 1:4 (Fe(III):citrate), and 1:1 (Fe(III):tartrate). A2), B2) and C2) correspond to the same experiments in real water, but varying pH. D) Fe(III)-aquacomplex photolysis in deionized water and real water at pH 3.5. In all the experiments, [AMZ]0= (41.4 ± 8) µmol L-1; [Fe]0= 0.1 mmol L-1…….…..54
Figure 18. Microtox equipment and suplies (adapted from Microtox® test protocol)…..61
Figure 19. Picture of the Protoxkit F and its contents………...62
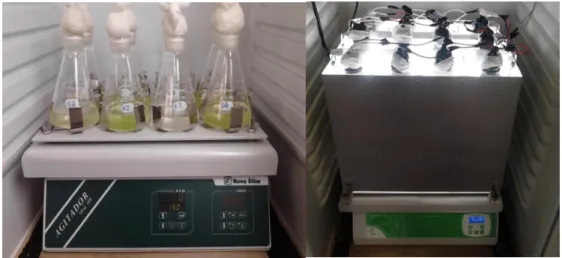
Figure 20. C. vulgaris culture growth system………...63
Figure 21. Emission spectrum of the lamps used in the microalgae growth system…….63
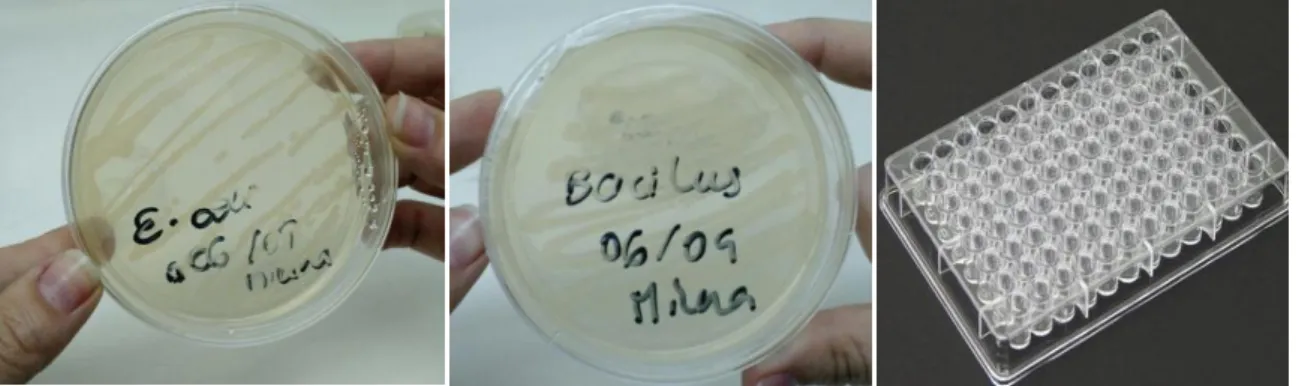
Figure 22. Pictures of E. coli and B.subtillis culures and microtiter plate where the toxicity tests regarding these bacteria were performed……….….64
Figure 23. Acute toxicity evaluation of an AMZ solution before (navy bar, time 0 min) and after (green bar, time 60 min; stripped bar, time 120 min) different AOPs, towards V.
fischeri. Fe(III)-OX: Fe(III)-oxalate complex; Fe(III)-CIT: Fe(III)-citrate complex;
Fe(III)-TART: Fe(III)-tartrate complex……….67
Figure 24. Chronic toxicity evaluation of an AMZ solution before (navy bar, time 0 min) and after (green bar, time 60 min; stripped bar, time 120 min) different AOPs, to C. vulgaris microalgae. Algae death is observed when growth inhibition>100%, while trophic effect is observed when growth inhibition < 0%. Fe(III)-OX: Fe(III)-oxalate complex; Fe(III)-CIT: Fe(III)-citrate complex; Fe(III)-TART: Fe(III)-tartrate
termophila. Fe(III)-OX: Fe(III)-oxalate complex; Fe(III)-CIT: Fe(III)-citrate complex; Fe(III)-TART: Fe(III)-tartrate complex………70
Figure 26. Antimicrobial activity evaluation of an AMZ solution before (navy bar, time 0 min) and after (green bar, time 60 min; stripped bar, time 120 min) different AOPs, towards B. subtilis. Fe(III)-OX: Fe(III)-oxalate complex; Fe(III)-CIT: Fe(III)-citrate complex; Fe(III)-TART: Fe(III)-tartrate complex………72
Figure 27. (A) Influence of ZVI source and size on AMZ degradation by the PS/ZVI system (1:1);(B) Fe(II) released from PS/ZVI (1:1) experiments with micro ZVI, Nanofer 25 and nano ZVI, respectively . [AMZ]0= (41.4 ± 8) µmol L-1; [ZVI]0 = 1 mmol L-1; [PS]0= 1 mmol L-1; free pH; pH0≈3………..77
Figure 28. Effect of [ZVI]0 on (A) pH profile over reaction (B) Fe2+ release during reaction; (C) AMZ degradation by the PS/ZVI system. [AMZ]0 = (41.4 ± 8) µmol L-1; [PS]0 = 1 mmol L- 1; 1<[ZVI]0<20 mmol L-1; free pH, pH0≈3………78
Figure 29. Effect of [PS]0 on (A) AMZ degradation and (B) Fe2+ concentrations at the end of 120 minutes of reaction. [AMZ]0 = (41.4 ± 8) µmol L-1; [ZVI]0 = 5 mmol L- 1; 0.5<[PS]0<2.5 mmol L-1; free pH. pH0≈3………79
Figure30. Effect of solution pH on AMZ degradation by the PS/ZVI system, for PS/ZVI ratios of (A) 1:1 and (B) 2.5:5. [AMZ]0 = (41.4 ± 8) µmol L-1..………80
Figure 31. (A1) Influence of dissolved oxygen on AMZ degradation by the PS/ZVI system (1:1 mmol L-1) in the dark or (B1) in the presence of UVA radiation; (A2) Influence of dissolved oxygen on released Fe(II) during AMZ degradation in the dark;[AMZ]0 = (41.4 ± 8) µmol L-1, free pH, pH0≈3………...82
Figure 32. Influence of different water matrices on AMZ degradation by the PS/ZVI system, for PS/ZVI ratios of (A) 1:1 and (B) 2.5/5. [AMZ]0 = (41.4 ± 8) µmol L-1, free
pH, pH0≈3……….83
Figure 33. Proposed pathways for the reductive dehalogenation in anoxic Fe0-H2O
systems………...90
Figure 34. Schematic permeable reactive barrier (PBR) for in situ treatment with ZVI of groundwater containing halocarbons (adapted from Pereira and Ferreira 2005)……….91
Figure35.(A)SEM-FEG image [× 50,000] of nZVI …..………..99
Figure 35 (cont.). (B) SEM-FEG image [× 4,000] of Zn/Cu; (C) SEM-FEG image[× 1,500] of micro Fe/Cu; (D) SEM-EDS image [× 420] of Cu0 (E) SEM-EDS image [× 9300] of Zn0; (F) SEM-EDS image [× 990] of micro ZVI; (G) SEM-FEG image [× 50,000] of nZVI/Cu0………100
Figure36. (A) EDS of nZVI; (B) EDS of Zn/Cu; (C) EDS micro ZVI/Cu …………...102
Figure37. (A) micro ZVI diffractogram; (B) Zn0 diffractogram...104
Figure37(cont.). (C) micro ZVI/Cu diffractogram; (D) Zn/Cu diffractogram...105
Figure37(cont.).(E) Cu0diffractogram………...106
Figure38. Effect of different (A) nZVI and (B) nZVI/Cu concentrations on chlorpyrifos degradation. Conditions: [CP]0= (100±10) mg L-1; free pH………108
Figure 39. Chloride release as a result of chlorpyrifos dechlorination promoted by nZVI and nZVI/Cu. Conditions: [CP]0= (100±10) mg L-1; [nZVI]0 = [nZVI/Cu]0 = 0.5% (w/V), free pH………..…108
Figure 40. Comparison between the effect of different (A) monometallic and (B) bimetallic particles on chlorpyrifos degradation. Conditions: [CP]0= (100±10) mg L-1; metals initial concentration = 0.5 % (w/V); free pH………111
Figure 41. Chloride release as a result of chlorpyrifos dechlorination promoted by monometallic and bimetallic microparticles. Conditions: [CP]0= (100±10) mg L-1; metals initial concentration = 0.5% (w/V), free pH………111
Figure 42. First-order kinetics adjustments for chlorpyrifos degradation. Conditions: [CP]0= 100 mg L-1; metals initial concentration = 0.5% (w/V), free pH……….112
Figure43. Influence of copper particles pre-exposure to reaction medium on chlorpyrifos degradation. Conditions: [CP]0= (100±10) mg L-1; metals initial concentration = 0.5 % (w/V); free pH………..115
Figure 44. Influence of previous acid washing in (A) micro ZVI particles and (B) Zn particles on chlorpyrifos degradation. [CP]0= (100±10) mg L-1; metals initial concentration = 0.5 % (w/V); free pH………..116
Figure A1. UVA lamp spectrum obtained through a spectoradiometer……….……….145
Figure A2. Standard curve for ferrioxalate actinometry………...………..…146
Figure A3. Photo generated Fe(II) ………...……….147
Figure B1. AMZ calibration curve………..149
Figure B2. Chlorpyrifos calibration curve (λ=290 nm)………....…..150
Figure C1.AMZ degradation profile for (A1) pH 7, [AMZ]0 = 41.4 µmol L-1, 0.25 <[PS] 0< 5 mmol L-1; (A2) pH 1.6, [AMZ]0 = (41.4±8) µmol L-1, 0.25 <[PS] 0< 5 mmol L-1.; (B1) pH 7, 41.4< [AMZ]0 < 207 µmol L-1, [PS]0 = 5 mmol L-1; (B2) pH 1.6, 41.4< [AMZ]0 < 207.2 µmol L-1, [PS] 0 = 5 mmol L-1……….152
Figure D3. AMZ normalized absorption spectrum in the presence of (A) Fe(II), (B) Fe(III), (C) Fe(III)-oxalate complex, (D) Fe(III)-citrate complex, (E) Fe(III)-tartrate complex. [Fe]0 = 0.1 mmol, excess of ligand was used to ensure the complex formation
and detection………...….154
Figure D4. Comparison between Fe(III)-carboxylates absorption spectrum and UVA lamps emission spectrum. [Fe]0 = 0.1 mmol, excess of ligand was used to ensure the complex formation and detection………...155
Figure E1. Scheme of the automated pH control system .………..……156
Figure F1. Pareto Chart for Fe(III)-oxalate system before displacement…………..…157
Figure F2. Pareto Chart for Fe(III)-oxalate system after displacement………..………157
Figure. F3. Fe(III)-oxalate complex speciation……….………158
Figure F4. Pareto Chart for FeIII-citrate system………..158
Figure F5. Fe(III)-citrate complex speciation……….159
Figure F6. Pareto Chart for Fe(III)-tartrate system………..………...159
Figure F7. Fe(III)-tartrate complex speciation……….……….……..160
LIST OF TABLES
Table 1. Classes of Pesticides (Adapted from EPA, 2015c)………03
Table 2. Physical and Chemical properties of AMZ………...…..………06
Table 3. Chlorpyrifos concentration levels above European safety standards, detected in
natural waterbodies………...………07
Table 4. Summary of recent researches where persulfate was applied to degrade pesticides in water……………….………14
Table 5. Chemical and Physical properties of sodium persulfate (adapted from Block,
2006)……….…15
Table 6. Values of kobs for the UVA/PS system for different H2O2 initial
concentrations……….27
Table 7.Doehlert design for two variables with c = 3……….37
Table 8. Doehlert design matrix for two factors and experimental values of kobs for the Fe(III)-oxalate system in the presence of [AMZ]0 = 41.4 µmol L-1 and [Fe(III)]0= 0.1 mmol L-1………....39 Table 9. Additional experiments for the Fe(III):oxalate system………..39
Table 10. Doehlert design matrix for two factors and experimental values of kobs for the Fe(III)-citrate system in the presence of [AMZ]0 = 41.4 µmol L-1 and [Fe(III)]0= 0.1
mmol L-1……….42
Table 11. Doehlert design matrix for two factors and experimental values of kobs for the Fe(III)-tartrate system in the presence of [AMZ]0 = 41.4 µmol L-1 and [Fe(III)]0= 0.1
mmol L-1……….45
Table 12. Quantum yield of production of Fe(II) (ɸ (+Fe(II)) and rate of reaction in Eq.20 for each Fe(III):carboxylate complex studied……….50
Table 13. AMZ percent removals after the •OH- driven and SO4•--driven AOPs……...65
Table 14. Effect of 2-propanol and TBA on AMZ degradation by the PS/ZVI system, for PS/ZVI ratios of 1:1 and 2.5:5 (mmol L-1), in the absence and presence of UVA
radiation………..84
Table 15. Zero-valent metals used in chlorpyrifos degradation……….94
Table 16. Particles size based on SEM images and surface area obtained from BET
IT-TOF of chlorpyrifos degradation products………...………….117
Table 18 (cont.). Mass measurements (m/z) determined by LC/ESI(+)-IT-TOF and LC/ESI(-) -IT-TOF of chlorpyrifos degradation products………...118
Table19. Identified products for each metal tested……….………118
Table A1. Absorbance of standard solutions for Fe(II) determination via ferrioxalate
actinometry……….…………..146
Table A2. Actinometry results………..…..…………147
Table B1. Measurements for AMZ calibration curve on HPLC…………..………….149
Table B2. AMZ concentrations used for LOD and LOQ calculations……….………..149
Table B3. Measurements for chlorpyrifos calibration curve on HPLC……….…..150
Table B4. Chlorpyrifos concentrations used for LOD and LOQ calculations………....151
Table F1. Analysis of variance for kobs – Fe(III):oxalate system before displacement...157
TableF2. Analysis of variance for kobs – Fe(III):oxalate system after displacement….158
Table F3. Analysis of variance for kobs – Fe(III):citrate system……….159
Table F4. Analysis of variance for kobs – Fe(III):tartrate system……….160
Table F5. Relative reactivity Fe(III)-carboxylate/Fe(III)-aquacomplex……….160
ABREVIATIONS
A.U. Arbitrary Unit AMZ Amicarbazone
AAS Atomic Absorption Spectrometry
ABNT Associação Brasileira de Normas Técnicas ANOVA Analysis of Variance
AOPs Advanced Oxidation Processes ATCC American Type Culture Collection BET Brunauer Emmett Teller
CBZ Carbamazepine
CDL Curved Line Dissolvation CFU Colony Forming Unit
CID Collision-Induced Dissociation CMC Carboxymethyl Cellulose
CONAMA Brazilian National Environmental Council CP Chlorpyrifos
CPQBA Centro Pluridisciplinar de Pesquisas Químicas, Biológicas e Agrícolas d.H2O Deionized Water
DBE Double Bond Equivalent DCA Dichloroaniline
DDT Dichlorodiphenyltrichloroethane DETP Diethylthiophosphate
DOC Dissolved Organic Carbon
DPD N,N-Diethyl-P-Phenylenediamine EDS Energy-Dispersive X-Ray Spectroscopy EDTA Ethylenediamine Tetraacetic Acid EPA U.S Environment Protection Agency ESI Electrospray Ionization
HPLC High-Performance Liquid Chromatography IBF Ibuprofen
IBGE Brazilian Institute of Geography and Statistics IC Inorganic Carbon
ICDD International Center for Diffraction Data ICP Inductively Coupled Plasma
ISCO In Situ Chemical Oxidation
IT Ion Trap
LCMS Liquid Chromatography Mass Spectrometry LMCT Ligand to Metal Charge Transfer
LNLS Brazilian Synchrotron Light Laboratory LOD Limit of Detection
LOQ Limit of Quantification
MAPA Brazilian Ministry of Agriculture, Livestock and Food Supply MeOH Methanol
MS Mass Spectrometry NOM Natural Organic Matter nZVI Nano Zero Valent Iron OD Optic Density
OES Optical Emission Spectrometry OM Organic Matter
PRB Permeable Reactive Barrier PCE Perchloroethylene
POD Horseradish Peroxidase PPs Persistent Pesticides
SHE Standard Hydrogen Electrode STP Sweage Treatment Plant TBA Tert-Butyl Alcohol TCE Trichloroethylene
TCP 3,5,6-Trichloro-2-Pyridinol TOC Total Organic Carbon
TOF Time-Of-Flight Mass Analyzer UV Ultraviolet Radiation
UVA Ultraviolet Radiation Type A UVC Ultraviolet Radiation Type C VOCs Volatile Organic Compounds WFD Water Framework Directive XAFS1 X-Ray Absortion Fine Structure I XAS X-Ray Absorption Spectroscopy XRD X-Ray Diffraction
∆H0 Standard entalphy of reaction Kj mol-1
pKa Acid dissociation constant –
kobs Observed first-order rate constant min-1 or day-1
kSA Surface area normalized rate constant L day-1 m-2
k'30 min Observed first-order rate constant for the first 30 minutes of reaction
min-1 or day-1
E0 Standard electrode potential V
λ Wavelength nm
ɸ Quantum yield -
I Growth inhibition %
A0 Control sample absorbance –
A Absorbance –
ρm Mass concentration g L-1
as Specific surface area m2 g-1
ΔOD Difference between the Optical Density at t0 and t24 -
1.Pesticides as Persistent Pollutants (PPs) ... 2 1.1.Amicarbazone ... 5 1.2. Chlorpyrifos ... 6
CHAPTER I
DEGRADATION OF PERSISTENT PESTICIDES VIA ADVANCED OXIDATION PROCESSES
7.3. Partial Conclusions ... 84 8. GENERAL CONCLUSIONS OF CHAPTER I ... 87
CHAPTER II
1. Pesticides as Persistent Pollutants (PPs)
Pesticides are one of the main water contaminants in Brazil. Most of these chemicals are toxic and persistent in the environment and they can also be transported by wind and water to far distances from their original source of application, representing a threat to living species around the world. To address this global concern, the United States joined forces with ninety other countries (Brazil inclusive) and European Community to sign a groundbreaking United Nations treaty, known as Stockholm Convention, in order to reduce or eliminate the production, use and/or release of Persistent Pollutants (PPs). At European level, the Water Framework Directive (WFD) has been in place as the main European legislation for the protection of water resources and water environment, since 2000. This management includes monitoring a list of priority substances that pose a particular risk to plants, animals and humans and, due to their characteristics, may accumulate in the environment over many years. Among the 33 substances set in WFD by 2008 (Annex II of Directive 2008/105/EC), twelve are pesticides (FUERHACKER, 2009).
Table 1. Classes of Pesticides (Adapted from EPA, 2015c).
Pesticide classification Pesticide action
Algicides Control algae in lakes, canals and other sites Antifouling agents underwater surfaces, such as boat bottoms Kill or repel organisms that attach to
Antimicrobials Kill microorganisms (such as bacteria and viruses) Attractants Attract pests (for example, to lure an insect to a trap)
Biopesticides
Pesticides derived from natural materials such as animals, plants, bacteria, and certain
minerals
Biocides Kill microorganisms
Disinfectants and sanitizers microorganisms on inanimate objects Kill or inactivate disease-producing
Fungicides Kill fungi
Fumigants Produce gas or vapor intended to destroy pests in buildings or soil Herbicides Kill undesired weeds and other plants Insecticides Kill insects and other arthropods
Miticides Kill mites that feed on plants and animals
Microbial pesticides Microorganisms that can control different kinds of pests, including other microorganisms
Molluscicides Kill snails and slugs
Nematicides Kill nematodes (microscopic, worm-like organisms that feed on plant roots) Ovicides Kill eggs of insects and mites Pheromones Biochemicals used to disrupt the mating behavior of insects
Repellents Repel pests
Rodenticides Control mice and other rodents
(IBGE, 2011). In the 1940s, growers started to use the herbicide 2,4-D to control broadleaf weeds in this kind of cultivation. The use of simazine, atrazine and diuron began when grassy weeds became more troublesome. Among the most consumed herbicides in Brazil, four chemicals – ametryn, tebuthioron, and a mixture of hexazinone and diuron – stand out, as they are vastly applied in sugarcane cultivations (LEBARON et al., 2008). All of these mentioned herbicides have persistent character, which means that they do not breakdown quickly in the environment and remain for more than one growing season.
Insecticides 12%
Fungicides 14%
Herbicides 45%
Others 29%
Figure 1. Pesticides sales in Brazil by type of pesticide (CARNEIRO et al., 2015)
Due to their capacity to bioaccumulate, their toxicity effect multiplies as they move up the food chain. Even when these compounds are degraded, their by-products can still pose high risk to the environment or human health. For example, diuron, an herbicide widely used against weeds in grain cultures, has a very slow rate of natural hydrolysis in a neutral solution at 25 °C. However, when hydrolysis occurs, the abiotic degradation in water solution is an irreversible reaction giving 3,4-dichloroaniline (3,4-DCA) as the only product. Therefore, this byproduct is considerably more toxic than diuron itself and has higher water solubility, so it can be easily leached out from soil to ground and surface water (RATHORE et al., 2012).
and water after application. Secondly, due to their persistent character, they still present in the environment nowadays even if they were applied a long time ago. For example, in Canada, large amounts of persistent pesticides, such as dieldrin, chlordane, DDT and toxaphene, were used during the 1960s and 1970s. Even though these chemicals are now banned in the country, quantities of these pesticides remain in the water column of all five Great Lakes (EPA, 2015b; UWEX, 2015)
1.1. Amicarbazone
Brazil is one of the world’s largest consumers of pesticides, particularly atrazine, an herbicide widely used in corn and sugarcane cultivations. According to the Regulation of the Brazilian National Environmental Council (CONAMA), which was approved in 2005, non-salty water bodies should be classified, regarding its noblest use, among five classes: special, 1, 2, 3 and 4. In the case the Basin Committee has not classified a certain water body, it should meet the requirements of class 2, which does not allow atrazine concentrations higher than 2 µg L-1. However, concentrations above the maximum allowable value for this herbicide are still detected. For example, a case study developed in Tianguá (Northeast Brazil) showed that the groundwater of the area studied was contaminated with atrazine at concentrations above 10 µg L-1 (ARRAES; MAUR, 2008).
Due to the environmental and health risks associated with atrazine, such as groundwater contamination and hormonal disrupting (to vertebrate organisms), it was banished from many countries (SASS; COLANGELO, 2006). Reducing offsite movement of atrazine and/or using other products to control weeds are suitable procedures to solve problems related with atrazine contamination.
An alternative is amicarbazone (AMZ), a triazolinone herbicide introduced into the Brazilian market in 2004, by Arysta LifeScience ( ME et al., 2012). Chemically referred as 4-amino-N-tert-butyl-4,5-dihydro-3-isopropyl-5-oxo-1H-1,2,4-triazole-1-carboxamide or C10H19N5O2, amicarbazone is also known by the commercial names Amicarbazone DF, Xonerate, and Dinamic 70 WDG. Its structural formula is shown in Figure 2.
Córrego Rico, SP (Brazil), indicated the presence of several herbicides in groundwater, including AMZ, which was detected under quantifiable levels (SANTOS; CORREIA, 2015).
CH3 CH3
C H3
CH3 C
H3
NH2
N
N N
N
OH O
Figure 2. Structural chemical formula of amicarbazone.
Table 2. Physical and chemical properties of AMZ (Adapted from EPA, 2015a).
Molar mass (g mol-1) 241.3
Density (g cm-3) 1.12
Aspect White crystals
Melting point (oC) 137.5
Vapor pressure (Pa) 1.3 × 10⁻⁶ (20 ºC)
3.0 × 10⁻⁶ (25 ºC)
Water solubility at 20 °C (mg L-1) 4600
Owing to its characteristics and extensive use, AMZ may represent a risk to animals as well as to the environment, turning emergent the need of developing remediation techniques capable to treat AMZ-contaminated water and wastewater.
1.2. Chlorpyrifos
solubility (2 mg L-1), after field application the pesticide can be leached, reaching surface and groundwater bodies (RACKE; LASKOWSKI; SCHULTZ, 1990).
CH3
O P
S O
O N Cl
Cl
Cl
CH3
Figure3. Chemical structure of chlorpyrifos.
Table 3 lists some studies reporting alarming CP concentrations detected in waterbodies. In fact, EPA proposed to ban this insecticide since the concentrations found in drinking water may not meet safety standards (< 0.1 µg L-1) (EPA, 2016).
Table 3. Chlorpyrifos concentration levels above European safety standards, detected in natural waterbodies.
Detected
concentration Waterbody Country Reference
10.8 µg L-1 Surface
water Argentina (MARINO; RONCO, 2005)
0.44 µg L-1
0.25 µg L-1
Surface and ground water
India (LARI et al., 2014)
9.31 µg L-1 Surface
water Bangladesh (HOSSAIN et al., 2014)
The presence of CP was also detected in cold drinks, bottled drinking water and blood of farmers in Punjab, India (CENTRE of SCIENCE and ENVIRONMENT, 2005). Thus, more attention should be paid to the degradation of CP and their residues in the soil, water, and waste sites contaminated by this insecticide. Conventionally, bioremediation is a good option for the degradation of CP, but it has several operational constraints, such as incomplete and slow rate of degradation, which could result in more harmful degradation products (KRALJ; FRANKO; TREBS, 2007).
CHAPTER I
DEGRADATION OF PERSISTENT
2. Water remediation via Advanced Oxidation Processes
Water is known as an infinitely renewable resource, despite being a finite one. The hydrological cycle ensures a constant water replacement on Earth, but actually its consumption rate is much higher than its natural recycling, leading to the reality of water scarcity in a growing number of countries. This scenario tends to get worse due to the rapid population growth, because not only the human water consumption has increased, but also the water demand to produce goods and services. At a global level, according to statistical studies developed by the Food and Agriculture Organization of the United Nations (AQUASTAT, 2014), the water withdrawal is 69% agricultural (including irrigation, livestock and aquaculture), 12% industrial and 19% municipal. These demands are associated with the inherent problem of water pollution, because either agricultural practice or industrial waste and household sewage release huge amounts of pollutants. An investigation undertaken by the Brazilian Institute of Geography and Statistics (IBGE) concluded that pesticides are the 2nd main source of water contamination in Brazil, preceded by domestic sewage (IBGE, 2012). In fact, the extensive use of pesticides that contributes to this pollution problem is already affecting population’s life and health, consisting then in a “wake-up call” to the necessity of changing the way pesticides are applied. A compromise between prevention and remediation should be achieved, but since there are already so many polluted water bodies, water remediation techniques have been receiving greater focus.
There are two types of water remediation according to where it takes place: in situ and off site. The first involves cleaning up the water supply where it is situated, rather than transporting the water to a treating unit at another location. In many cases, this option makes the remediation process less expensive. The second alternative consists in collecting wastewater which is transported to a location where the contaminants can be safely removed. This procedure has the advantage of transporting the contaminants along with the water, avoiding the further destruction of the ecological balance at the site (TATUM et al., 2015)
compounds, even those with recalcitrant character. These processes rely mainly on the formation of reactive, short-lived oxygen-containing intermediates (e.g. •OH and SO4•-) with the ability to mineralize organic compounds into carbon dioxide, water, and inorganic ions or, at least, into harmless products (ANDREOZZI, 1999; OPPENLÄNDER, 2003). The most used and promising AOPs for practical applications are:
(a) Fenton and Photo-Fenton (H2O2/Fe2+ and H2O2/Fe2+/UV and/or H2O2/Fe3+/UV):
The Fenton reactant is an attractive oxidative system for wastewater treatment due to the fact that iron is a very abundant and considered a non-harmful element (15 mg L-1 of total dissolved iron is the maximum concentration allowed in waters prior to entering sewage treatment plants in the State of São Paulo, Brazil, according to the Brazilian Directive 8468) and hydrogen peroxide is relatively easy to handle and environmentally safe. However, the Fenton process requires strict pH control and sludge is formed, with related disposal problems. For example, an investigation undertaken by Samet et al. (2012) showed that Fenton and solar photo-Fenton are promising processes for the degradation of the pesticide chlorpyrifos, having achieved an organic matter decay of 90 %.
(b) H2O2 photolysis (H2O2/UV): Hydrogen peroxide (H2O2) under ultraviolet radiation in the wavelength range 200-300 nm is a source of •OH radicals. Therefore, this feature has been extensively used in the treatment of pesticide-containing wastewater. Vogna et al. (2004) studied the UV/H2O2-induced degradation of carbamazepine, an antiepileptic drug recently found as a contaminant in many municipal sewage treatment plants (STP). The oxidation treatment caused a complete abatement of the drug after 4-min treatment, with 35% of the total organic carbon (TOC) removed. However, a drawback of this AOP is the small molar extinction coefficient of H2O2 at 254 nm (ε254 nm = 19.6 L -1 mol−1 cm−1) (GLAZE; KANG; CHAPIN, 1987), which means that large amounts of this oxidant are needed to achieve good results.
formed in the valence band, which can react with organic molecules (RX), H2O or OH- adsorbed on the catalyst surface, leading to the formation of cationic organic (R•+) and •OH radicals, respectively (Eqs. 1-3):
(1)
(2)
(3)
Despite the high concentration of H2O and OH− adsorbed on the catalyst surface, a significant part of electron-hole pairs recombine, thus reducing the quantum yield of this process (ANDREOZZI et al., 1999). Another disadvantage of this process is related to the separation steps required to remove the TiO2 suspension from the treated water (LAZAR; VARGHESE; NAIR, 2012). However, this disadvantage can be surpassed by immobilizing the TiO2 particles in supporting materials to facilitate its post-treatment separation, like vermiculite (JIN; DAI, 2012), glass spheres (MIRANDA-GARCIA et al., 2010), among others.
All these AOPs make use of expensive reactants and have high operating costs, but several researches are being developed in order to achieve more effective and economical ones. For example, coupling AOPs with other treatments has proved to decrease operation costs (OLLER; MALATO; SÁNCHEZ-PÉREZ, 2011).
So far, little is known about the degradation of the herbicide amicarbazone (AMZ) via AOPs, which consists in one of the main motivations behind the studies developed in this first chapter. Peixoto et al. (2014) have reported the use of UV radiation (mainly 254 nm) to degrade AMZ with 100 % removal after 20 hours of irradiation. Also, Silva et al. (2015) studied the photochemical fate of AMZ in aqueous media and simulated its sunlight-driven degradation in water bodies of different characteristics. The authors found that the direct AMZ photolysis by sunlight is very unlikely, with herbicide half-lives varying from about less than 1 day to more than 2 months. In this way, the use of oxidants to accelerate AMZ degradation by means of AOPs appears as an attractive way of treating AMZ-contaminated water and wastewaters.
2.1 Persulfate Activation: a novel AOP to degrade pesticides
Usually, traditional Advanced Oxidation Processes are referent to hydroxyl radical-driven oxidation (•OH–AOPs). All AOPs mentioned in section 2.1 are •OH–AOPs and have been frequently studied to degrade and/or mineralize emerging organic pollutants in water, since hydroxyl radicals are highly reactive and almost unselective species (GAO et al., 2012).
In recent years, persulfate-induced AOPs (PS-AOPs) have become a popular remediation technology (PETRI et al., 2011). Upon activation, cleavage of the O–O bond in the S2O82- structure results in the generation of sulfate radicals (SO4-•) directly and/or
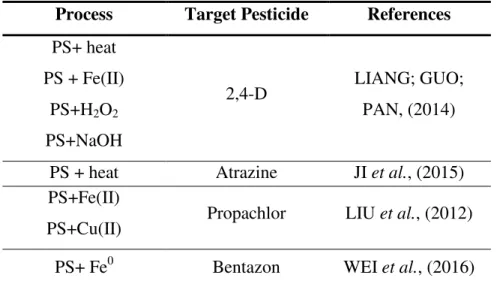
Table 4. Summary of recent studies in which persulfate was applied to degrade pesticides in water.
Process Target Pesticide References
PS+ heat PS + Fe(II)
PS+H2O2 PS+NaOH
2,4-D LIANG; GUO;
PAN, (2014)
PS + heat Atrazine JI et al., (2015) PS+Fe(II)
PS+Cu(II) Propachlor LIU et al., (2012) PS+ Fe0 Bentazon WEI et al., (2016)
Additionally, sulfate radicals can be considered an environmental friendly species due to the transformation of sulfate radicals into non-toxic sulfate anions after reaction, thus not requiring special disposal or caution. In fact, according to CONAMA regulation for class I waters, a high concentration of sulfates (250 mg L-1 SO42-) is accepted.
However, given the relatively short period of time that persulfate has been used for in situ chemical oxidation (ISCO) and the fact that persulfate is a less common oxidant in industrial processes and water treatment in comparison with hydrogen peroxide, permanganate, or ozone, there is less information available for persulfate. As a result, many questions remain regarding persulfate reaction chemistry, activation methods and contaminant treatability (PETRI et al., 2011). The following paragraphs summarize what has been reported up to date about persulfate chemistry and activation reactions used to treat contaminated waters.
2.1.1 – Persulfate Chemistry
Persulfate reaction chemistry can be complex, including radical chain reactions, radical scavenging, oxidation of organic compounds and competing reactions, so it is important to understand what is behind the use of this oxidant.
Table 5. Chemical and Physical properties of sodium persulfate (adapted from Block, 2004).
Property Value
Physical form Withe cristalline solid
Molar mass (g mol-1) 238.1
Solubility limit 0 ₀C 37 wt.%
25 ₀C 42 wt.%
50 ₀C 46 wt.%
Solution density
(g mL-1) 10 wt.% 1067
20 wt.% 1146
30 wt.% 1237
40 wt.% 1340
O
-O O
O -O
O
O O
S
S
Figure 4. Structural chemical formula of persulfate. 2.1.2 – Persulfate Activation
Persulfate can directly react with the target contaminant or first be decomposed into highly reactive radicals, to further react with target molecules. This decomposition into free radicals can be activated through different mechanisms, as discussed below. The activation method should be chosen accordingly to the target, as well as to the reaction medium. For example, there can be a variety of interactions between persulfate and aquifer materials that may impact its effectiveness (PETRI et al., 2011). Different persulfate activation methods already tested for pesticide degradation are briefly discussed in the following paragraphs.
i) Heat Activation
Persulfate can be decomposed by heat into two sulfate radicals according to the reaction given by Eq. 4. Generally, when temperature increases, the rate of oxidant decomposition also increases, thus increasing the contaminant degradation.
(4)
enhanced as the temperature increased, achieving total herbicide degradation after 80 minutes of reaction at 60 °C. This is expected, since the specific reaction rate (k) is directly dependent on temperature, according to the Arrhenius law.
ii) Alkaline Activation
Alkaline activation of persulfate involves the addition of a concentrated base solution, either sodium hydroxide (NaOH) or potassium hydroxide (KOH), to a persulfate solution in order to raise the pH to a high value (pH 11-12). According to the investigation performed by Furman et al. (2010), the alkaline activation of persulfate involves the base-catalyzed hydrolysis of persulfate to hydroperoxide anion and sulfate, followed by the reduction of another persulfate molecule by hydroperoxide (Eqs. 6-8):
(6)
(7)
(8)
The rates of reaction of this process at high pH vary widely for different organic compounds. However, these rates generally increase with increasing pH, as well as with temperature. Alkaline activation was shown by Block et al. (2004) to be very effective on halomethanes and chloroethanes (VOCs) degradation. The authors pointed out that persulfate reactivity increases with increasing the KOH content.
iii) Activation with transition metals
Activation of persulfate by transition metals offers the advantage of accelerating persulfate chemical reactions at room temperature and, through the use of metal-chelate complexes, at near-neutral pH values as well. Metal ions that have been explicitly noted to activate persulfate include Fe(II), Fe(III), silver [Ag(I)], and copper [Cu(II)] (PETRI et al., 2011). However, iron-driven persulfate activation is by far the most studied, which is similar to the Fenton reaction, being also viewed as a Fenton-like process. The mechanism involves electron transfer from Fe2+ to S2O82- , originating sulfate radicals, Fe3+ and SO42- (Eq. 9).
Rao et al. (2014) studied the degradation of carbamazepine (CBZ) with Fe(II)-activated persulfate and found that, by increasing Fe(II) dosage, CBZ degradation increased up to a certain limit, and above that, the CBZ decay rate slowed down. However, for different contaminants it is necessary to optimize different iron dosages and different [Fe2+]/[PS] ratios in order to obtain the best degradation performance.
Several studies have proved that iron-chelate complexes improve the treatment effectiveness over equivalent non-chelated iron systems (BLOCK et al., 2004). In this case Fe(II) is consumed (turns into Fe(III)) throughout persulfate activation, reducing its activity as oxidant. Therefore, to maintain activation of the persulfate system with iron over extended periods of time, iron must be present in solution. This may be accomplished by either acidification of the solution to around pH 3, where Fe(III) becomes soluble, or by the use of organic-iron ligand complexes (or chelates) to maintain iron in solution at neutral pH (PETRI et al., 2011). Crimi & Taylor (2007) investigated chelating agent-to-iron ratios, and found that a 1:5 ratio worked well for high iron concentration, while a higher dose of the chelating agent was needed if the iron concentration was low. Also, the photolysis of some Fe(III)-organic ligand complexes, namely Fe(III)-carboxylate complexes, is known as a self-depuration process of natural waters. Further in this work, the contribution of such process in the degradation of AMZ-contaminated waters was investigated.
As an alternative activator, zero valent iron (ZVI), a solid source of iron, has been employed with promising results. The corrosion of this material will consist in a source of Fe2+ for PS activation, through three possible ways: (i) Direct release of Fe2+ by persulfate; (ii) Indirect release of Fe2+ in water with dissolved oxygen; and (iii) Indirect release of Fe2+ in water in the absence of oxygen (AL-SHAMSI; THOMSON, 2013).
(10)
(11)
(12)
Following its release from ZVI, Fe2+ can activate persulfate to generate sulfate free radicals according to Eq. 9. Also, Fe2+ can be recycled by reaction between Fe3+ and the ZVI surface as follows (LIANG et al., 2008):
Liang et al. (2008) reported trichloroethylene (TCE) degradation by ZVI-activated persulfate and concluded that persulfate promotes Fe2+ release from Fe0 more significantly than Fe0 alone. Therefore, these authors proved that the Fe0/PS system was an effective method for destroying TCE. However, due to the passivation of the ZVI surface along the process, the reaction rate might be halted after a while, which consists in a drawback of this process.
iv) Activation by hydrogen peroxide
During the PS activation with hydrogen peroxide, the H2O2 molecule decomposes exothermically once in contact with water (Eq. 14) and, therefore, indirectly induces heat PS activation. Also, when pH is increased to above the pKa of hydrogen peroxide, the deprotonated species, HO2- (Eq. 15), may interact with S2O82- in accordance with (Eq. 8). However, hydrogen peroxide directly reacts with PS, resulting in simultaneous decompositions of both H2O2 and PS (Eq. 16) (LIANG; GUO; PAN, 2014):
(14)
(15)
(16)
Cronk and Cartwright (2006) reported that hydrogen peroxide could support persulfate activation by raising subsurface temperatures. Using controlled H2O2 dosage to the subsurface, the authors observed the increase in subsurface temperatures to 60-80 °C, achieving persulfate activation via Eq. 4.
v) Activation with UV radiation
of the oxidant must be used. Notwithstanding, even with similar absorptivity ( values at 254 nm, an investigation developed by Raharinirina et al. (2009) revealed a better performance of UV/S2O82- comparing to UV/H2O2, based on the energy necessary to break the oxidant O−O bond. Since this bond in persulfate is weaker than in hydrogen peroxide, less energy is needed and consequently sulfate radicals might be formed more readily than hydroxyl radicals. The study of ibuprofen (IBF) removal by UV/H2O2 and UV/S2O82- also revealed a better performance of the latter (KWON et al., 2015). Also, despite the low molar absorptivity of both oxidants above 280 nm, sodium persulfate reveals higher values of at longer wavelengths (BUCK; SINGHADEJA; ROGERS, 1954), enabling the application of UVA rays, the main type of UV radiation reaching the Earth’s surface (300-400 nm), for persulfate activation.
All of these activation methods for persulfate initiate powerful oxidation processes capable of degrading a wide range of organic contaminants. However, not all mechanisms are well understood, remaining gaps in the knowledge related to persulfate ISCO. This fact consisted in one of the main motivations behind the present work.
3. OBJECTIVES
The aim of this first chapter is to explore different oxidation processes, driven mainly by SO4•- or •OH, in terms of amicarbazone degradation effectiveness. For that, four investigations were performed, each one having its own objectives:
1) To study AMZ degradation kinetics promoted by UVA-activated persulfate in the presence of H2O2, Fe(II) or Fe(III)-carboxylate complexes;
2) To understand the interaction between pH and Fe(III):carboxylate ratio on AMZ degradation under UVA radiation, through a surface response model, in order to explore the contribution of these complexes to the self-depuration of natural waters;
3) To monitor AMZ sample toxicity resulting from some of the processes explored in the two previous studies, towards five microorganisms representative of different taxonomic levels; and
4) To study AMZ degradation promoted by ZVI-activated persulfate and how ZVI source and size, PS and ZVI dosage, UVA radiation, dissolved oxygen
4. AMICARBAZONE DEGRADATION BY UVA-ACTIVATED PERSULFATE
IN THE PRESENCE OF HYDROGEN PEROXYDE OR Fe2+
In recent years, persulfate (PS)-driven oxidation has been extensively studied as an efficient remediation technique for in situ chemical oxidation of contaminated sites. Among other ways, PS can be activated by UV radiation, but most UV sources applied in PS activation studies are in the UVC range (ex ∼ 254 nm), whilst the use of UVA, which is the UV radiation most incident on Earth’s surface (300-400 nm), has received less attention. Successful applications of UVC-activated PS have been widely reported for the degradation of a large variety of persistent contaminants, such as drugs (GAO et al., 2012; KWON et al., 2015; TAN et al., 2013; ZHANG et al., 2014), dyes (SAIEN; SOLEYMANI; SUN, 2011; YANG et al., 2010), endocrine disruptors (OLMEZ-HANCI; ARSLAN-ALATON; GENC, 2014), pesticides (LUTZE et al., 2015), etc., while the use of UVA radiation for the same purpose is usually included in the use of solar irradiation for PS activation, which is reported in the literature to a lower extent. Notwithstanding, the latter has been receiving growing attention, having as an example of its successful application a research where the decontamination of domestic wastewater containing carbamazepine was accomplished via solar PS activation (AHMED; CHIRON, 2014); other examples of solar-driven PS activation are mentioned in the literature (SAHOO; MARBANIANG; SHARAN, 2016; SHUKLA et al., 2010). To the best of our knowledge, the literature regarding the combination of solely UVA radiation and PS is still scarce (AVETTA et al., 2015; SAHOO; MARBANIANG; SHARAN, 2016). With the aim of contributing to the knowledge in this field, in this study the degradation of amicarbazone (AMZ), driven by the UVA-activated PS in the absence or in the presence of other PS activators, such as H2O2, Fe(II), Fe(III) and Fe(III)-complexes, was explored. Up to date, this is the first time that UVA-activated persulfate and the combination of this process with other PS activation processes is carried out for AMZ degradation. Even though solar radiation would lead to more realistic results in terms of environmental applicability of the studied processes, UVA lamps are cheaper and lead to similar results without requiring complex apparatus.
4.1 Materials and Methods 4.1.1 Chemicals
Technical (>95.4% w/w) and analytical grade (99.9%, w/w) samples of amicarbazone were obtained from Arysta LifeScience Corp. and used with no further purification. All the aqueous solutions were prepared in deionized water (18.2 MΩ cm) obtained from a Milli-Q Direct-Q system (Millipore). Dilute solutions of sodium hydroxide or sulfuric acid were used for pH adjustment. Fe(III)-carboxylates complexes were prepared by mixing the solutions of Fe2(SO4)3.5H2O with the corresponding carboxylate, in the dark and before adding any other compound to the solution. All the other chemicals were of analytical grade. Hydrogen peroxide, persulfate, iron and chelated iron were added just before the UVA irradiation was turned on.
4.1.2 Photochemical experiments
Figure 5. Experimental apparatus. 4.1.3 Analytical methods
Whenever appropriate, persulfate anion, H2O2 and Fe(II) concentrations were measured, according to the following spectrophotometric methods:
(i) The persulfate anion concentration was determined according to the method proposed by Liang et al. (2008): 0.1 mL of sample was added to a 40-mL solution containing 4 g of KI and 0.2 g of NaHCO3. The yellow solution resulting from the reaction of persulfate and iodide in the presence of sodium bicarbonate was monitored at 400 nm;
(ii) The hydrogen peroxide concentration was determined by the metavanadate method described in Nogueira et al. (2005): 1-mL sample was added to a 9-mL solution containing 0.062 mol L-1 of of metavanadate and 0.58 mol L-1 of H2SO4, in a 10-mL volumetric flask and mixed. The change of color of the metavanadate ion (VO3−), from yellow to red-orange, in the presence of H2O2, allowing its detection at 450 nm. This method has a detection limit of 143 µmol L-1 of H2O2. (iii) The Fe(II) concentration was determined according to the o-phenantroline
standard procedure (MORTATTI et al., 1982): 2 mL of the sample was added to 2 mL of 1,10-phenanthroline 0.1% (w/V) in a 15-mL falcon tube and mixed, followed by the addition of 1 mL of sodium acetate solution 10% (w/V). The absorbance was measured at the maximum absorption of the iron(II)-phenantroline complex (λmax=510 nm).
spectrophotometer using a 1-cm path-length Suprasil® quartz cuvette, in the range 190-820 nm and 1 nm intervals.
AMZ concentration during the degradation experiments was determined by HPLC-UV (Shimadzu, Series 20A) using a C18 column (ACE, 250 4.6 mm). The isocratic elution consisted of 50% methanol and 50% of aqueous solution containing 1% acetic acid, with a flow rate of 1.0 mL min-1. The injection volume was 50 µL and the detection wavelength was 230 nm. The limits of detection (LOD) and quantification (LOQ) were 1.03 µmol L-1 and 3.09 μmol L−1, respectively (determined as described in
APENDIX B).
All the experiments were performed at least in duplicate and the average of the experimental responses is reported hereinafter.
4.2 Results and Discussion
4.2.1. Effect of initial persulfate and AMZ concentrations
In order to evaluate the effect of initial PS concentration on AMZ degradation, several PS concentrations were tested using a buffered 41.4 μmol L-1 (10 mg L-1) AMZ solution, at two different pH values (1.6 and 7). It is worth investigating an acidic condition because when PS is added to the reaction medium, the pH drops to near 2.6 (AMZ pKa = 2.581), so AMZ protonated groups can influence the degradation kinetics. AMZ degradation by persulfate-driven oxidation follows a pseudo first-order kinetics (R2 > 0.96) and kobs (observed pseudo first-order degradation rate constant) versus PS initial concentration is shown in Figure 6A, while the initial AMZ degradation rate (r0) as a function of initial AMZ concentration is shown in Figure 6B. AMZ degradation profiles for these experiments can be found in APENDIX C.
0 1 2 3 4 5 0 1 2 3 4 5 k obs x 10 2 (min -1 )
[PS]0 mM pH1.6
pH7
40 80 120 160 200 0 2 4 6 8 r 0 x 1 0 (m m o l m in
-1 L -1 )
[AMZ]0 (mmol L-1)
pH 1.6 pH 7
Figure 6. (A) Effect of PS on measured kobs ;(B) Effect of AMZ initial concentrations on the initial AMZ degradation rate, r0. Conditions: (A) [AMZ]0= 41.4 µmol L-1, 0<[PS]0<5 mmol L-1; (B) [PS]0= 5 mmol L-1, 41.4 <[AMZ]0< 207.2 µmol L-1. Error bars are not included since they are smaller than the symbols.
Experimental results show that the initial persulfate concentration influenced AMZ degradation at both pH values tested, as expected. AMZ degradation increased for increasing PS dosage, since more reactive species are generated.
As aforementioned, the triazolinone group of AMZ molecules is protonated below pH 2.58, hampering radical attack, since sulfate radicals act mainly by electron transfer (LUTZE, 2013). For PS concentrations below 2.5 mmol L-1, the rate of AMZ degradation is limited by the low amount of sulfate radicals generated, independently whether the target molecule is protonated or not. In that case, the values of kobs obtained at both pH values do not show significant differences. Conversely, for PS concentrations above 2.5 mmol L-1, sulfate radicals are not the limiting reactant and pH clearly affects the degradation kinetics, with higher kobs values for pH 7, at which the neutral form of the AMZ molecule dominates.
Figure 6B shows that the initial AMZ degradation rate (r0) values remain almost constant up to 165.5 mmol L-1 for pH 1.6, decreasing above that [AMZ]0 value. This behavior can be explained by the fact that up to 165.5 mmol L-1 the amount of radicals might me enough to degrade an increasing amount of target-molecules at the same rate, becoming insufficient above that [AMZ]0. On the other hand, at pH 7, r0 values decrease by increasing the AMZ dosage, which is expected since sulfate radical generation is constant, depending on the UVA radiation intensity, and the quantity of target molecules is increased. This same behavior is not observed for both pH values since at pH 1.6 AMZ molecules are more difficult to degrade due to their protonated form, which explains the almost constant r0 values until a certain amount of molecules. Several studies reported successful pollutant abatement with UVC-activated persulfate systems (KWON et al.,
A
2015; ZHANG et al., 2014), but very little is known about UVA-activated persulfate for the same purpose. Our results showed that even PS presenting a low molar absorptivity at this wavelength range (around 0.25 mol-1 cm-1 at 351 nm (LIN; LIANG; CHEN, 2011), UVA-activated persulfate degraded AMZ efficiently within a short irradiation period (less than 90 minutes for PS dosages above 5 mmol L-1).
4.2.2 Effect of H2O2 addition to the PS/UVA system
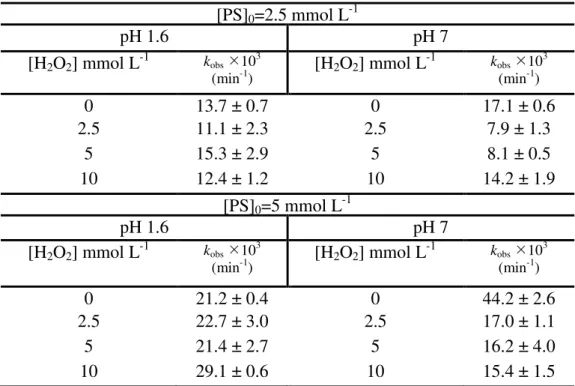
It is well known that H2O2 activates PS decomposition (LIANG; GUO; PAN, 2014), although the mechanism is still not well understood. Hence, the effect of H2O2 addition to the UVA/PS system was studied at fixed initial AMZ and PS concentrations. [AMZ]0 was 41.4 μmol L-1, [PS]0 was 2.5 or 5 mmol L-1, and [H2O2]0 was raised from 0 to 10 mmol L-1 (Table 6). Control experiments showed no notable consumption of H2O2 along the experiment (reaction time: 120 minutes).
The comparison of the PS/UVA systems at pH 7 with and without H2O2 clearly shows that the presence of the second oxidant decelerates the reaction, thus suggesting that H2O2 is somehow scavenging SO4•- (according to Eq. 17), generating a much weaker oxidant, the hydroperoxyl radical (HO2•) (E0 = 1.42 V SHE (OPPENLÄNDER, 2003), superoxide radical at pH 7) (CHU; LAU; FUNG, 2006).
(17) Under acidic pH (pH 1.6), the addition of H2O2 does not promote significant changes in PS/UVA kobs values for both PS concentrations tested. The reaction given by Eq. 17 is unlikely to occur under extremely acidic conditions since hydrogen peroxide is protonated as the oxonium ion (H3O2+) (KWON et al., 1999), which is known to be very stable. This feature was also observed by other researchers when the Fenton reaction was performed at pH below 2 (KWON et al., 1999). In addition, the wavelength of the UV radiation used in these experiments (around 350 nm) does not allow a significant conversion of this oxidant due to its low molar absorption coefficient (
ɛ
350 nm <0.1 L mol -1 cm-1). Hence, due to its unavailability under acidic pH, the addition of H2O2 does not significantly influence the PS/UVA system at pH 1.6. On the other hand, owing to the low probability to produce •OH radicals under UVA radiation, H2O2 molecules are able to hamper AMZ degradation at pH 7.photolysis at both pH values studied, but only 10.3 and 4.8% removals after 120 minutes were observed at pH 1.6 and 7, respectively. This was expected since AMZ does not absorb in the UVA range (see Figure D1 in APPENDIX D). To verify AMZ hydrolysis, the herbicide was kept in aqueous solution for 24 h and only 4 % degradation was observed after that period, ensuring that this process was not responsible for AMZ removal in our experiments.
Also, control experiments were performed to check the effect of H2O2 under UVA radiation without PS and a variation of 1.6 and 2.8 times on kobs for AMZ degradation at pH 1.6 and 7, respectively, in comparison to that observed on UVA-photolysis, was observed.
Table 6. Values of kobs for the PS/ UVA system for different H2O2 initial concentrations.
[PS]0=2.5 mmol L-1
pH 1.6 pH 7
[H2O2] mmol L-1 kobs103
(min-1) [H2O2] mmol L
-1 k
obs103 (min-1)
0 13.7 ± 0.7 0 17.1 ± 0.6
2.5 11.1 ± 2.3 2.5 7.9 ± 1.3
5 15.3 ± 2.9 5 8.1 ± 0.5
10 12.4 ± 1.2 10 14.2 ± 1.9
[PS]0=5 mmol L-1
pH 1.6 pH 7
[H2O2] mmol L-1 kobs103
(min-1) [H2O2] mmol L
-1 k
obs103 (min-1)
0 21.2 ± 0.4 0 44.2 ± 2.6
2.5 22.7 ± 3.0 2.5 17.0 ± 1.1
5 21.4 ± 2.7 5 16.2 ± 4.0
10 29.1 ± 0.6 10 15.4 ± 1.5
4.2.3 Effect of Fe2+ addition on the PS/UVA system
of light, during the reaction period (120 min). However, when these two components are mixed together, they promote two-stage degradation kinetics, characterized by fast initial decay followed by a slower stage. This happens because of the high production of sulfate radicals at the moment of Fe(II) and persulfate mixture, leading to an instantaneous AMZ abatement (RAO et al., 2014). After complete ferrous ion consumption, only ferric iron (which is not able to catalyze persulfate break) remains in the solution and then the degradation is slower.
Conversely, when the reaction occurs in the presence of UVA radiation, this activation effect seems to remain and much faster AMZ degradation is observed. An attempt to relate this result to a Fe (II) – Fe(III) cycling, promoted by UVA radiation was made by measuring ferrous iron along the reaction time and the results point to a constant concentration of 20 µmol L-1 along time. This indicates that, if ferrous ion is generated, it is continuously consumed by persulfate activation. It is worth noting that the Fe(II)/PS/UVA system can be considered a photo-Fenton like process, since it combines persulfate (PS) as an oxidant, ferrous iron (Fe(II)) as a catalyst and a light source, as already mentioned by other authors (AHMED; CHIRON, 2014).
0 30 60 90 120
0.0 0.2 0.4 0.6 0.8 1.0
[A
M
Z
]/
[A
M
Z
] 0
Time (min)
Figure 7. Effect of Fe(II) addition on AMZ degradation driven by PS/UVA at free pH. () Sole Fe(II), () Sole PS, () Fe(II)/PS, () PS/UVA, () Fe(II)/PS/UVA. Experimental conditions: [AMZ]0= (41.4±8.0) µmol L-1, [Fe(II)]0=0.134 mmol L-1, [PS]0= 2.5 mmol L-1. Error bars are not included since they are smaller than the symbols.
A previous work, in which a solid source of Fe(II) (magnetite) was irradiated with UVA, also revealed the effective persulfate activation due to FeIII-FeII cycling (AVETTA et al., 2015).
photolysis (KWON et al., 2015).
0 20 40 60 80 100 120 0.0 0.2 0.4 0.6 0.8 1.0 [A M Z ]/ [A M Z ] 0 Time (min) 0.015 0.020 0.025 0.030 0.035 [ F e ( II )] mM
Figure 8. AMZ (--, left side) degradation by Fe(III)/UVA system (kobs = 0.04 ± 4.8×10⁻⁴ min-1) and [Fe(II)] (--, right side) measurementduring the reaction. Experimental conditions: [AMZ]0= (41.4±8.0) µmol L-1, [Fe(III)]0= 0.134 mmol L-1, free pH.
An attempt to perform the reaction under controlled pH with phosphate buffer showed the inhibition of AMZ degradation (data not shown), probably caused by the complexation of Fe(III) by phosphate, leading to a photo-inactive complex, as reported elsewhere (WELCH; DAVIS; AUST, 2002).
In our experimental conditions, the initial pH is around 5 and drops to 3 when persulfate and Fe(II) are added. In the absence of any other ligand, Fe(III) species form a complex with water and/ or hydroxide anions giving aqua complexes such as [FeIIIOH(H2O)5]2+, which is the predominant species at pH~3. This complex undergoes a LMCT (ligand to metal charge transfer) under sunlight irradiation, which is followed by the inner-sphere photoinductive electron transfer, producing the Fe(II) aqua complex and one •OH radical (Eq. 18) (CIEŚLA et al., 2004). Although our irradiation experiments used UVA lamps instead of sunlight, the Fe(III) photoactive hydroxo complex reveals great absorption within the UVA lamps emission band (see Figure D2 in APPENDIX D), meaning that these are also capable of promoting the same LMCT effect.
(18)
This is a well-known mechanism that occurs in natural waterbodies which contributes to its auto depuration (CIEŚLA et al., 2004).
![Table 8. Doehlert design matrix for two factors and experimental values of k obs for the Fe(III)-oxalate system in the presence of [AMZ] 0 = 41.4 µmol L -1 and [Fe(III)] 0 = 0.1 mmol L - 1 .](https://thumb-eu.123doks.com/thumbv2/123dok_br/16491194.733160/65.892.245.675.160.551/table-doehlert-design-matrix-factors-experimental-oxalate-presence.webp)
![Table 10. Doehlert design matrix for two factors and experimental values of k obs for the Fe(III)-citrate system in the presence of [AMZ] 0 = 41.4 µmol L -1 and [Fe(III)] 0 = 0.1 mmol L -1](https://thumb-eu.123doks.com/thumbv2/123dok_br/16491194.733160/68.892.226.645.157.573/table-doehlert-design-matrix-factors-experimental-citrate-presence.webp)