https://doi.org/10.1590/0004-282X20180142
ARTICLE
Genes related to maintenance of autophagy
and successful aging
Genes relacionados à manutenção da autofagia e envelhecimento bem-sucedido
Carolina Fioroto Chaves
1, Diego Robles Mazzotti
1, Maysa Seabra Cendoroglo
2, Luiz Roberto Ramos
3, Sergio
Tufik
1, Vanessa Cavalcante da Silva
1, Vânia D’Almeida
1Aging is a biological process in which there is a
progres-sive decline in the physiological capacity to respond to
envi-ronmental stress, and an increase in susceptibility and
vul-nerability to diseases
1. Two processes play an important role
in homeostasis control and cell survival:
ubiquitin-protea-some in redox signaling and the autophagy-lysoubiquitin-protea-some
path-way in damaged protein degradation
2.
The ubiquitin-proteasome is a multicatalytic
ATP-dependent degradation system found in both cytoplasm and
cell nucleus
3,4,5. This system is related to the degradation of
normal or abnormal proteins, and some studies have shown
decreased proteasomic activity during aging in different
human tissues such as muscle and epidermis
6,7,8.
A study developed by Lee et al.
9showed a reversion in
decreased proteasome gene expression in the skeletal
mus-cle of mice submitted to caloric restriction, indicating that
this intervention may contribute to the prevention of aging
by increasing degradation of damaged proteins. Recently, the
20S proteasome was found in human blood and showed a
proteolytic activity
10,11,12. Although the origin of these
circulat-ing proteasomes is still unknown, some studies have reported
their increased concentrations in pathological conditions
1 Universidade Federal de São Paulo, Departamento de Psicobiologia, São Paulo SP, Brasil; 2 Universidade Federal de São Paulo, Departamento de Medicina, São Paulo SP, Brasil;
3 Universidade Federal de São Paulo, Departamento de Medicina Preventiva, São Paulo SP, Brasil.
Correspondence: Vânia D’Almeida; R. Napoleão de Barros, 925 / 3º andar; 04024-002 São Paulo SP, Brasil; E-mail: [email protected]
Conflict of interest: There is no conflict of interest to declare.
Support: CNPq, CAPES, AFIP and FAPESP. CFC was a recipient of a CNPq scholarship. VCS is a recipient of a CAPES scholarship. VD’A is a recipient of a CNPq fellowship.
Received 02 July 2018; Received in final form 13 August 2018; Accepted 25 September 2018.
ABSTRACT
Considering aging as a phenomenon in which there is a decline in essential processes for cell survival, we investigated the autophagic and
proteasome pathways in three different groups: young, older and oldest old male adults. The expression profile of autophagic
pathway-related genes was carried out in peripheral blood, and the proteasome quantification was performed in plasma. No significant changes were
found in plasma proteasome concentrations or in correlations between proteasome concentrations and ages. However, some autophagy-
and/or apoptosis-related genes were differentially expressed. In addition, the network and enrichment analysis showed an interaction
between four of the five differentially expressed genes and an association of these genes with the transcriptional process. Considering that
the oldest old individuals maintained both the expression of genes linked to the autophagic machinery, and the proteasome levels, when
compared with the older group, we concluded that these factors could be considered crucial for successful aging.
Keywords
:
Autophagy; longevity, gene expression; gene networks; proteasome endopeptidase complex.
RESUMO
Considerando o envelhecimento como um fenômeno em que há um declínio nos processos essenciais a sobrevivência celular, investigamos
as vias autofágica e proteassômica em três grupos: jovens, idosos e longevos. O perfil de expressão dos genes relacionados à via autofágica
foi analisado em sangue periférico, e a quantificação do proteassoma realizada em plasma. Não foram encontradas alterações significativas
nas concentrações plasmáticas de proteassoma ou na correlação entre as concentrações de proteassoma e as idades. No entanto, alguns
genes relacionados a autofagia e / ou apoptose foram expressos diferencialmente. Além disso, as análises de rede e de enriquecimento
mostraram uma interação entre quatro dos cinco genes diferencialmente expressos e a associação desses ao processo transcricional.
Considerando que os indivíduos longevos mantiveram tanto a expressão de genes ligados à maquinaria autofágica, quanto os níveis de
proteassoma quando comparados aos idosos, concluímos que esses fatores poderiam ser considerados cruciais para o envelhecimento
bem-sucedido.
such as cancer
13,14, and suggested a correlation between
pro-teasome concentrations and health status
10,15,16.
Several diseases related to aging show accumulation of
oxi-dized proteins and the failure of autophagic pathways is
sug-gested as a possible cause
17. The autophagy-lysosome pathway is
a cytoplasmic-restricted degradation system, related to the
deg-radation of organelles, proteins and protein aggregates
18. Under
adequate levels of nutrients, growth factors and reactive oxygen
species, autophagy is at basal levels (constitutive) with normal
protein biosynthesis. However, autophagy can be induced by a
stressor and the production of proteins interrupted
19.
As the molecular characterization of the autophagic
machinery may allow the development of tools for a better
physiological and molecular evaluation of successful aging,
our objective was to quantify the expression of genes involved
in autophagic machinery regulation in young, older and
old-est old adult male individuals.
METHODS
Volunteers
The individuals selected for this study were previously
recruited by the Department of Preventive Medicine and
Discipline of Geriatrics and Gerontology of the Universidade
Federal de São Paulo for a different study but the samples were
not fully used. All volunteers signed a free and informed consent
form. For the current study, they signed an authorization for
sample use, following norms determined by the Research Ethics
Committee of the Universidade Federal de São Paulo, which
approved the study (# 451631/2013). The sample consisted
of male volunteers, distributed into three groups: individuals
aged between 20 and 30 years (young group, n = 15),
individu-als aged between 60 and 70 years (older group, n = 13) and
indi-viduals between 85 and 105 years old (oldest old group, n = 10).
Individuals with neoplasias or severe unmanaged diseases, such
as heart diseases, gastrointestinal diseases, type 2 diabetes, or
with neurological and psychiatric antecedents were excluded.
Samples previously collected
Peripheral blood was collected in EDTA tubes,
cen-trifuged at 3,000 rpm for 10 minutes and the separated
plasma stored at -20°C. In addition, 5 mL of blood was
col-lected in specific tubes (PaxGene RNA collection tubes –
PreAnalytiX, Switzerland) for total RNA extraction using the
PaxGene kit (PaxGene blood RNA isolation kit – PreAnalytiX,
Switzerland). After verification of integrity and purity, total
RNA was stored at -80°C.
Proteasome
To perform proteasome quantification in plasma, we
used enzyme-linked immunosorbent assay – Proteasome
ELISA Kit (Enzo Life Sciences, BML-PW0575, EUA), which
employs specific antibodies for the 20S proteasome subunit.
The product absorbance was detected using the SpectraMax
M2 apparatus (Molecular Devices, USA).
Gene expression
Total RNA was quantified using the NanoDrop 8000
(Thermo Scientific, USA). For complementary DNA
synthe-sis, we used the RT2 First Strand Kit (QIAGEN, Germany)
plus 625 ng of RNA. Cycling parameters comprised a
hold-ing stage at 42ºC for 15 minutes, followed by inactivation at
95°C for 15 minutes. The expression profile of 84
autopha-gic pathway-related genes was analyzed in peripheral blood
RNA samples using the Superarray-RT2 Profiler™ PCR Array
System (QIAGEN, Germany – PAHS-084ZD-24) in the 7500
PCR Real-Time System (Applied Biosystems, USA). In
addi-tion,
ACTB
,
B2M
,
GAPDH
,
HPRT1
and
RPLP0
genes were
eval-uated as an endogenous control. Thermal cycling conditions
comprised an initial denaturation at 95°C for 15 seconds and
annealing and extension at 60°C for one minute (Table 1).
Gene expression quantification was obtained using
Δ
CT
calculation, and the endogenous control CT was obtained
from the arithmetic mean of two endogenous controls that
showed a lower variation between groups (standard
devia-tion > 0.1). Then, the relative gene expression was calculated
by CT comparative method (
ΔΔ
CT) using the following
for-mula: FC = 2-
ΔΔ
CT = 2-(
Δ
CT interest group -
Δ
CT reference
group). For better visualization of variation, data were
pre-sented by fold regulation (FR) (if FC was greater than 1, FR =
FC, if the HR was less than 1, the FR = -(1/FC)), which
repre-sents the number of times a gene is expressed in one group
in relation to the other. Both the older and oldest old groups
were compared with the young group (reference group).
Network and enrichment analysis
To investigate interactions and pathways shared by
differ-entially expressed genes, two online software applications were
used: GeneMANIA
20(www.genemania.org]) and Enrichr
21(http://amp.pharm.mssm.edu/Enrichr). GeneMANIA allows
genes with shared or functionally similar properties to be
iden-tified. These analyses may be performed with genes of
inter-est or with 20, 50 or 100 other genes in the interaction. In the
present study, we used 20 genes. Enrichr enables enrichment
analysis, where genes of interest are searched and compared
in databases to verify possible pathways and over-represented
cellular processes in which they may participate.
Statistical analysis
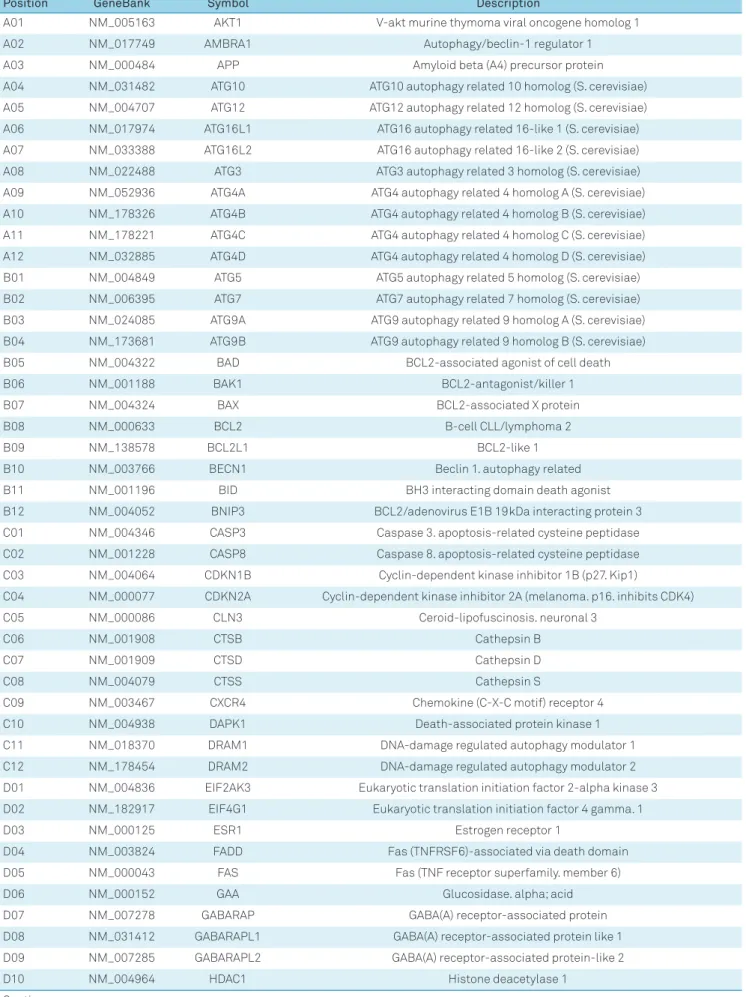
Table 1:
Genes from autophagic machinery investigated by the Superarray - RT2 Profiler ™ PCR Array System (PAHS-084Z).
Position
GeneBank
Symbol
Description
A01
NM_005163
AKT1
V-akt murine thymoma viral oncogene homolog 1
A02
NM_017749
AMBRA1
Autophagy/beclin-1 regulator 1
A03
NM_000484
APP
Amyloid beta (A4) precursor protein
A04
NM_031482
ATG10
ATG10 autophagy related 10 homolog (S. cerevisiae)
A05
NM_004707
ATG12
ATG12 autophagy related 12 homolog (S. cerevisiae)
A06
NM_017974
ATG16L1
ATG16 autophagy related 16-like 1 (S. cerevisiae)
A07
NM_033388
ATG16L2
ATG16 autophagy related 16-like 2 (S. cerevisiae)
A08
NM_022488
ATG3
ATG3 autophagy related 3 homolog (S. cerevisiae)
A09
NM_052936
ATG4A
ATG4 autophagy related 4 homolog A (S. cerevisiae)
A10
NM_178326
ATG4B
ATG4 autophagy related 4 homolog B (S. cerevisiae)
A11
NM_178221
ATG4C
ATG4 autophagy related 4 homolog C (S. cerevisiae)
A12
NM_032885
ATG4D
ATG4 autophagy related 4 homolog D (S. cerevisiae)
B01
NM_004849
ATG5
ATG5 autophagy related 5 homolog (S. cerevisiae)
B02
NM_006395
ATG7
ATG7 autophagy related 7 homolog (S. cerevisiae)
B03
NM_024085
ATG9A
ATG9 autophagy related 9 homolog A (S. cerevisiae)
B04
NM_173681
ATG9B
ATG9 autophagy related 9 homolog B (S. cerevisiae)
B05
NM_004322
BAD
BCL2-associated agonist of cell death
B06
NM_001188
BAK1
BCL2-antagonist/killer 1
B07
NM_004324
BAX
BCL2-associated X protein
B08
NM_000633
BCL2
B-cell CLL/lymphoma 2
B09
NM_138578
BCL2L1
BCL2-like 1
B10
NM_003766
BECN1
Beclin 1. autophagy related
B11
NM_001196
BID
BH3 interacting domain death agonist
B12
NM_004052
BNIP3
BCL2/adenovirus E1B 19kDa interacting protein 3
C01
NM_004346
CASP3
Caspase 3. apoptosis-related cysteine peptidase
C02
NM_001228
CASP8
Caspase 8. apoptosis-related cysteine peptidase
C03
NM_004064
CDKN1B
Cyclin-dependent kinase inhibitor 1B (p27. Kip1)
C04
NM_000077
CDKN2A
Cyclin-dependent kinase inhibitor 2A (melanoma. p16. inhibits CDK4)
C05
NM_000086
CLN3
Ceroid-lipofuscinosis. neuronal 3
C06
NM_001908
CTSB
Cathepsin B
C07
NM_001909
CTSD
Cathepsin D
C08
NM_004079
CTSS
Cathepsin S
C09
NM_003467
CXCR4
Chemokine (C-X-C motif) receptor 4
C10
NM_004938
DAPK1
Death-associated protein kinase 1
C11
NM_018370
DRAM1
DNA-damage regulated autophagy modulator 1
C12
NM_178454
DRAM2
DNA-damage regulated autophagy modulator 2
D01
NM_004836
EIF2AK3
Eukaryotic translation initiation factor 2-alpha kinase 3
D02
NM_182917
EIF4G1
Eukaryotic translation initiation factor 4 gamma. 1
D03
NM_000125
ESR1
Estrogen receptor 1
D04
NM_003824
FADD
Fas (TNFRSF6)-associated via death domain
D05
NM_000043
FAS
Fas (TNF receptor superfamily. member 6)
D06
NM_000152
GAA
Glucosidase. alpha; acid
D07
NM_007278
GABARAP
GABA(A) receptor-associated protein
D08
NM_031412
GABARAPL1
GABA(A) receptor-associated protein like 1
D09
NM_007285
GABARAPL2
GABA(A) receptor-associated protein-like 2
D10
NM_004964
HDAC1
Histone deacetylase 1
Continuation
D11
NM_006044
HDAC6
Histone deacetylase 6
D12
NM_004712
HGS
Hepatocyte growth factor-regulated tyrosine kinase substrate
E01
NM_001017963
HSP90AA1
Heat shock protein 90kDa alpha (cytosolic). class A member 1
E02
NM_006597
HSPA8
Heat shock 70kDa protein 8
E03
NM_002111
HTT
Huntingtin
E04
NM_000619
IFNG
Interferon. gamma
E05
NM_000618
IGF1
Insulin-like growth factor 1 (somatomedin C)
E06
NM_000207
INS
Insulin
E07
NM_001145805
IRGM
Immunity-related GTPase family. M
E08
NM_005561
LAMP1
Lysosomal-associated membrane protein 1
E09
NM_181509
MAP1LC3A
Microtubule-associated protein 1 light chain 3 alpha
E10
NM_022818
MAP1LC3B
Microtubule-associated protein 1 light chain 3 beta
E11
NM_001315
MAPK14
Mitogen-activated protein kinase 14
E12
NM_002750
MAPK8
Mitogen-activated protein kinase 8
F01
NM_004958
MTOR
Mechanistic target of rapamycin (serine/threonine kinase)
F02
NM_003998
NFKB1
Nuclear factor of kappa light polypeptide gene enhancer in B-cells 1
F03
NM_000271
NPC1
Niemann-Pick disease. type C1
F04
NM_002647
PIK3C3
Phosphoinositide-3-kinase. class 3
F05
NM_002649
PIK3CG
Phosphoinositide-3-kinase. catalytic. gamma polypeptide
F06
NM_014602
PIK3R4
Phosphoinositide-3-kinase. regulatory subunit 4
F07
NM_006251
PRKAA1
Protein kinase. AMP-activated. alpha 1 catalytic subunit
F08
NM_000314
PTEN
Phosphatase and tensin homolog
F09
NM_130781
RAB24
RAB24. member RAS oncogene family
F10
NM_000321
RB1
Retinoblastoma 1
F11
NM_005873
RGS19
Regulator of G-protein signaling 19
F12
NM_003161
RPS6KB1
Ribosomal protein S6 kinase. 70kDa. polypeptide 1
G01
NM_000345
SNCA
Synuclein. alpha (non A4 component of amyloid precursor)
G02
NM_003900
SQSTM1
Sequestosome 1
G03
NM_000660
TGFB1
Transforming growth factor. beta 1
G04
NM_004613
TGM2
Transglutaminase 2 (C polypeptide. protein-glutamine-gamma-glutamyltransferase)
G05
NM_153015
TMEM74
Transmembrane protein 74
G06
NM_000594
TNF
Tumor necrosis factor
G07
NM_003810
TNFSF10
Tumor necrosis factor (ligand) superfamily. member 10
G08
NM_000546
TP53
Tumor protein p53
G09
NM_003565
ULK1
Unc-51-like kinase 1 (C. elegans)
G10
NM_014683
ULK2
Unc-51-like kinase 2 (C. elegans)
G11
NM_003369
UVRAG
UV radiation resistance associated gene
G12
NM_017983
WIPI1
WD repeat domain. phosphoinositide interacting 1
H01
NM_001101
ACTB
Actin. beta
H02
NM_004048
B2M
Beta-2-microglobulin
H03
NM_002046
GAPDH
Glyceraldehyde-3-phosphate dehydrogenase
H04
NM_000194
HPRT1
Hypoxanthine phosphoribosyltransferase 1
H05
NM_001002
RPLP0
Ribosomal protein. large. P0
H06
SA_00105
HGDC
Human Genomic DNA Contamination
H07
SA_00104
RTC
Reverse Transcription Control
H08
SA_00104
RTC
Reverse Transcription Control
H09
SA_00104
RTC
Reverse Transcription Control
H10
SA_00103
PPC
Positive PCR Control
H11
SA_00103
PPC
Positive PCR Control
method (pBH) for gene expression analyses. Fold regulation
(FR) values greater than 1.50 (genes with increased expression)
or less than -1.50 (genes with decreased expression) were used
to select differentially expressed genes, and to exclude those
potentially subject to methodological noise. Thus, the
differen-tially expressed genes were those included in one of the
follow-ing conditions: 1) pBH ≤ 0.05, independent of the FR value or 2)
p ≤ 0.05 and FR ≥ 1.50 or FR ≤ -1.50.
RESULTS
Autophagic pathway gene expression and proteasome
levels were evaluated in the individuals from three different
age groups (mean ± standard deviation): young, 24.3 ± 2.2
years: older, 65.5 ± 3.0 years; and oldest old, 91.9 ± 6.1 years (F
(2,35)
= 999.95; p < 0.001). The mean and standard deviations of
body mass index were 24.04 ± 2.74 in the young group, 25.87
± 3.56 in the older group, and 24.94 ± 3.55 in oldest old group
(F
(2,35)= 1.10; p = 0.333). No difference was observed in
pro-teasome levels between the three age groups (ANOVA; F
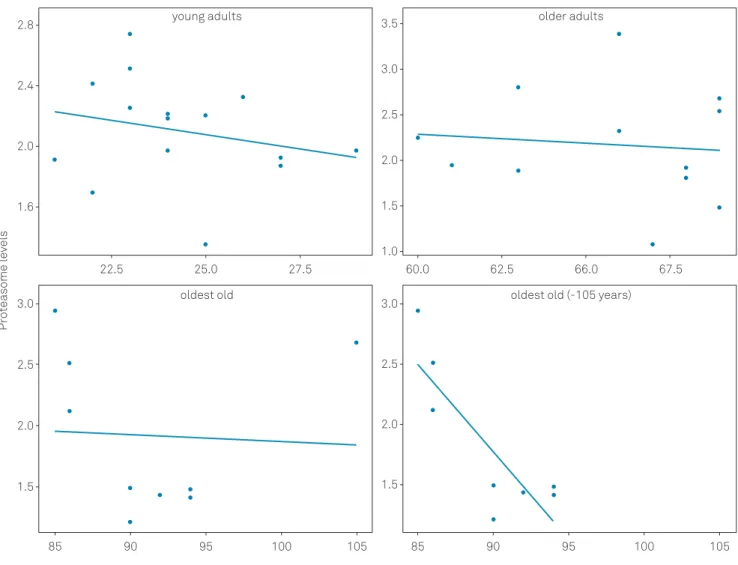
(2,34)= 0.619 and p = 0.545; Figure 1). Additionally, plasma
protea-some levels were not related to the individuals’ ages in each
group (Figure 2). However, when the oldest individual (105
years) was excluded from the oldest old group analysis, a
sta-tistically significant correlation was observed (Figure 2D).
Proteasome (µg/mL)
Young Older
Oldest ol d
Young (N=15)
Older (N=12)
Oldest old (N=9)
0
1
2
3
ANOVA. F (2,34) = 0.619 and p = 0.545. Data are presented as the mean ±
standard error.
Figure 1.
Proteasome levels in young, older and oldest old groups.
Proteasome levels
older adults
3.0
2.5
2.0
1.5
1.0
3.5
66.0
62.5
60.0
67.5
2.5
2.0
1.5
3.0
95
90
85
100
oldest old (-105 years)
105
young adults
2.4
2.0
1.6
2.8
25.0
22.5
27.5
2.5
2.0
1.5
3.0
95
90
85
100
oldest old
105
Young: n = 15, r = -0.240, p = 0.389; Older: n = 12, r = -0.097, p = 0.765; Oldest old: n = 9, r = -0.052, p = 0.894.
Regarding gene expression, from the 84 genes linked to
autophagic machinery, only five were differentially expressed
according to the adopted criteria:
ATG4C
,
BCL2L1
,
EIF2AK3
,
EIF4G1
and
TP53
(Table 2). The
ATG4C
gene was significantly
less expressed in the oldest old group when compared with the
young group (1.91-fold decrease); in addition, there was also a
difference in the older group when compared with the oldest
old (1.47-fold increase; p = 0.031). The
BCL2L1
gene was
sig-nificantly more expressed in the oldest old when compared
with the young group (increase of 1.91 times). The
EIF2AK3
gene was significantly less expressed in the older group
(1.46-fold decrease), as well as in oldest old individuals when
com-pared with the young group (1.44-fold decrease). The
EIF4G1
gene was significantly less expressed in the older and oldest
old when compared with the young group (decrease of 1.47
and 1.32 times, respectively). The
TP53
gene was significantly
less expressed in the older and oldest old when compared with
the young group (decrease of 1.57 and 1.66-fold, respectively).
In the network analysis, we observed that from the five
differentially expressed genes, only two showed evidence
of some interaction —
TP53
and
BCL2L1
(Figure 3). When
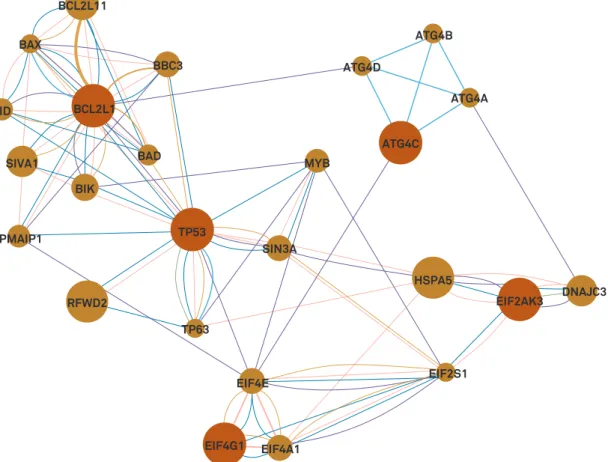
the other 20 genes were added, we observed that four of the
five genes showed some type of interaction, the exception
being
ATG4C
(Figure 4). The enrichment analysis was divided
EIF2AK3
ATG4C
EIF4G1
BCL2L1
TP53
Blue line: interaction by pathways; pink line: physical interaction; orange line: prediction of protein-protein interaction.
Figure 3.
Interactions between the five differentially expressed
genes among the young, older and oldest old groups.
EIF4E
EIF4G1
EIF4A1
EIF2AK3
EIF2S1
DNAJC3
HSPA5
RFWD2
TP63
PMAIP1
BIK
TP53
SIVA1
BAD
BID
SIN3A
MYB
ATG4C
ATG4D
ATG4A
ATG4B
BCL2L1
BCL2L11
BAX
BBC3
Light blue line: interaction by pathways; pink line: physical interaction; purple line: co-expression; green line: genetic interaction; dark blue line: co-localization; brown line: shared protein domains; orange line: protein-protein interaction prediction.
Figure 4.
Interaction of five differentially expressed genes in the young, older and oldest old groups after inclusion of 20 genes in
the network analysis.
Table 2.
Differentially expressed genes in older and oldest old
in relation the young group.
Genes
pBH
p
Older
(N=13)
oldest old
(N=10)
FR
pa
FR
pb
ATG4C
0.008
<0.001
-1.30
0.136
-1.91
<0.001
BCL2L1
0.277
0.030
1.11
1.000
1.91
0.033
EIF2AK3
0.026
0.001
-1.46
0.003
-1.44
0.009
EIF4G1
0.011
<0.001
-1.47
<0.001
-1.32
0.021
TP53
0.002
<0.001
-1.57
<0.001
-1.66
<0.001
pBH: p value corrected by Benjamini-Hochberg method; FR: fold regulation in relation to the young group; p: referent ANOVA values from 2-ΔCT; pa: t test
results from 2-ΔCT values between the older and young groups; pb: t test
into two stages: the first was done with the five
differen-tially expressed genes, and the second with the differendifferen-tially
expressed genes plus the genes that showed the most
fre-quent pathways in the network analysis (
HSPA5
,
SIN3A
and
EIF2S1
). In the first step, the following databases were used:
TRANSFAC and JASPAR PWMs, ENCODE TF ChIP-seq 2015,
ESCAPE, ENCODE TF ChIP-seq and GO Biological Process
2013. The databases used in the second stage were: ChEA,
TRANSFAC and JASPAR PWMs, ENCODE TF ChIP-seq 2015,
transcription factor PPIs, ESCAPE, ENCODE TF ChIP-seq. All
databases used in the first and second stages showed direct
or indirect linkage of the genes analyzed with the
transcrip-tion process.
DISCUSSION
The accumulation of macromolecules and damaged
organelles is one of the most predominant alterations found
in aged cells, and the main cause is related to a deficient
autophagic process
22. Studies in
C.
elegans
and
D.
melanogas-ter
have shown that the loss of function of autophagy genes
is related to an accumulation of damaged organelles and
proteins, accelerated aging and shortened life span
23,24,25. To
evaluate the contribution of the autophagic machinery in
successful aging, we quantified the expression of 84 genes
related to the autophagic pathway in young, older and
old-est old individuals; five presented with differential expression
between the studied groups:
ATG4C
,
BCL2L1
,
TP53
,
EIF2AK3
and
EIF4G1
.
The
ATG4C
encodes a protein with protease activity involved
in autophagic vacuole formation. However, studies suggest that
this protein is not essential to generate the basal level of
autoph-agy required, since knockout mice for the
ATG4C
gene exhibit
normal development
24. In contrast, knockouts for this gene are
more likely to develop fibrosarcoma when exposed to
carcino-genic chemicals compared with wild-type animals
26. The lower
expression of
ATG4C
observed in the oldest old people group
does not suggest lower autophagic activity per se, but may
con-tribute to a higher risk of these individuals developing tumors, a
condition that could be related to aging. On the other hand, the
increased expression of
BCL2L1
observed in the older and
old-est old groups indicates that autophagy levels decrease during
aging
27. The
BCL2L1
is a co-regulator of autophagy and
apopto-sis and proteins from the BCL-2 family may also interact with
p53 in the induction of autophagy. P53 exhibits tumor
suppres-sor activity and the ability to control autophagic processes and
cellular senescence
28,29. In the current study, there was decreased
TP53
expression in both the oldest old and older groups in
rela-tion to the young group, suggesting that the autophagic process
decreases with increased age. In addition, decreased expression
of
EIF2AK3
and
EIF4G1
in both the oldest old and older
indi-viduals reflects the body’s declining ability to maintain
reticu-lum homeostasis and cellular processes with increasing age
19,30.
The
EIF2AK3
and
EIF4G1
proteins, respectively, are associated
with endoplasmic reticulum homeostasis and the initiation
of translation of mRNAs related to mitochondrial activity and
cellular bioenergetics
19,30.
Studies have suggested that proteasome activity declines
during cellular senescence and aging in both animal models
and humans
31. However, a study performed by Chondrogianni
and colleagues showed similar functional proteasomes in
human fibroblasts cultures from centenarian and young
donors
8. In the current study, we evaluated, for the first time,
the plasmatic proteasome levels in the young, older and
old-est old groups and we did not observe a significant difference
between them. Although there is no evidence that plasmatic
proteasome concentrations reflect the intracellular
protea-some activity, we hypothesized that the similarity of plasma
proteasome concentrations between the groups found in our
samples could be one of the factors contributing to the
lon-gevity in the oldest old group. In fact, we previously observed
that these same oldest old individuals had a more favorable
lipid profile compared with the other groups
32. An increase in
SIRT2
expression in the oldest old people was also observed
when compared with the young group (unpublished data).
The increase in
SIRT2
seems to contribute to the promotion
of longevity by increasing levels of autophagy
33. More recently,
several studies have shown the impact of caloric restriction on
sirtuin levels, which in turn act on autophagic pathways and
contribute to increased life expectancy
34. In the network
analy-sis of differentially expressed genes, we identified interactions
between the
TP53
and
BCL2L1
genes, which was expected,
as several studies have shown the promotion of autophagy
by the interaction of TP53 with the Bcl-2 family proteins
35-37.
However, when we added 20 other genes to this network,
four of the five differentially expressed genes had some type
of interaction, with
ATG4C
being the exception (Figure 4). The
interaction between the four genes is related to the regulation
of transcription, an extremely important process for cell
func-tioning
38. During the aging process, some genes have increased
expression, such as those related to cell adhesion and immune
response
39, while others have decreased expression, such as
genes that participate in lipid metabolism
39and those involved
in the electron transport chain
40,41.
References
1. Troen BR. The biology of aging. Mt Sinai J Med. 2003 Jan;70(1):3-22. 2. Korolchuk VI, Menzies FM, Rubinsztein DC. Mechanisms of
cross-talk between the ubiquitin-proteasome and autophagy-lysosome systems. FEBS Lett. 2010 Apr;584(7):1393-8. https://doi.org/10.1016/j.febslet.2009.12.047
3. Brooks P, Fuertes G, Murray RZ, Bose S, Knecht E, Rechsteiner MC et al. Subcellular localization of proteasomes and their regulatory complexes in mammalian cells. Biochem J. 2000 Feb;346(Pt 1):155-61. https://doi.org/10.1042/bj3460155
4. Groll M, Bochtler M, Brandstetter H, Clausen T, Huber R. Molecular machines for protein degradation. ChemBioChem. 2005 Feb;6(2):222-56. https://doi.org/10.1002/cbic.200400313 5. Nickell S, Beck F, Scheres SH, Korinek A, Förster F, Lasker K et al. Insights into the molecular architecture of the 26S proteasome. Proc Natl Acad Sci USA. 2009 Jul;106(29):11943-7. https://doi.org/10.1073/pnas.0905081106
6. Ferrington DA, Husom AD, Thompson LV. Altered proteasome structure, function, and oxidation in aged muscle. FASEB J. 2005 Apr;19(6):644-6. https://doi.org/10.1096/fj.04-2578fje
7. Petropoulos I, Conconi M, Wang X, Hoenel B, Brégégère F, Milner Y et al. Increase of oxidatively modified protein is associated with a decrease of proteasome activity and content in aging epidermal cells. J Gerontol A Biol Sci Med Sci. 2000 May;55(5):B220-7. https://doi.org/10.1093/gerona/55.5.B220
8. Chondrogianni N, Petropoulos I, Franceschi C, Friguet B, Gonos ES. Fibroblast cultures from healthy centenarians have an active proteasome. Exp Gerontol. 2000 Sep;35(6-7):721-8. https://doi.org/10.1016/S0531-5565(00)00137-6 9. Lee CK, Klopp RG, Weindruch R, Prolla TA. Gene
expression profile of aging and its retardation by caloric restriction. Science. 1999 Aug;285(5432):1390-3. https://doi.org/10.1126/science.285.5432.1390
10. Wada M, Kosaka M, Saito S, Sano T, Tanaka K, Ichihara A. Serum concentration and localization in tumor cells of proteasomes in patients with hematologic malignancy and their pathophysiologic significance. J Lab Clin Med. 1993 Feb;121(2):215-23.
11. Sixt SU, Dahlmann B. Extracellular, circulating proteasomes and ubiquitin - incidence and relevance. Biochim Biophys Acta. 2008 Dec;1782(12):817-23. https://doi.org/10.1016/j.bbadis.2008.06.005 12. Zoeger A, Blau M, Egerer K, Feist E, Dahlmann B. Circulating
proteasomes are functional and have a subtype pattern distinct from 20S proteasomes in major blood cells. Clin Chem. 2006 Nov;52(11):2079-86. https://doi.org/10.1373/clinchem.2006.072496 13. Jakob C, Egerer K, Liebisch P, Türkmen S, Zavrski I, Kuckelkorn U et al.
Circulating proteasome levels are an independent prognostic factor for survival in multiple myeloma. Blood. 2007 Mar;109(5):2100-5. https://doi.org/10.1182/blood-2006-04-016360
14. Stoebner PE, Lavabre-Bertrand T, Henry L, Guiraud I, Carillo S, Dandurand M et al. High plasma proteasome levels are detected in patients with metastatic malignant melanoma. Br J Dermatol. 2005 May;152(5):948-53. https://doi.org/10.1111/j.1365-2133.2005.06487.x 15. Lavabre-Bertrand T, Henry L, Carillo S, Guiraud I, Ouali A,
Dutaud D et al. Plasma proteasome level is a potential marker in patients with solid tumors and hemopoietic malignancies. Cancer. 2001 Nov;92(10):2493-500. https://doi.org/10.1002/1097-0142(20011115)92:10<2493::AID-CNCR1599>3.0.CO;2-F 16. Roth GA, Moser B, Krenn C, Roth-Walter F, Hetz H, Richter
S et al. Heightened levels of circulating 20S proteasome in critically ill patients. Eur J Clin Invest. 2005 Jun;35(6):399-403. https://doi.org/10.1111/j.1365-2362.2005.01508.x
17. Huang J, Klionsky DJ. Autophagy and human disease. Cell Cycle. 2007 Aug;6(15):1837-49. https://doi.org/10.4161/cc.6.15.4511
18. Klionsky DJ. Autophagy: from phenomenology to molecular understanding in less than a decade. Nat Rev Mol Cell Biol. 2007 Nov;8(11):931-7. https://doi.org/10.1038/nrm2245
19. Ramírez-Valle F, Braunstein S, Zavadil J, Formenti SC, Schneider RJ. eIF4GI links nutrient sensing by mTOR to cell proliferation and inhibition of autophagy. J Cell Biol. 2008 Apr;181(2):293-307. https://doi.org/10.1083/jcb.200710215.
20. Warde-Farley D, Donaldson SL, Comes O, Zuberi K, Badrawi R et al. The GeneMANIA prediction server: biological network integration for gene prioritization and predicting gene function. Nucleic Acids Res. 2010 Jul 1;38 Suppl:W214-20. https://doi.org/10.1093/nar/gkq537. 21. Chen EY, Tan CM, Kou Y, Duan Q, Wang Z, Meirelles GV et al.
Enrichr: interactive and collaborative HTML5 gene list enrichment analysis tool. BMC Bioinformatics. 2013 Apr;14(1):128.
https://doi.org/10.1186/1471-2105-14-128
22. Terman A, Brunk UT. Myocyte aging and mitochondrial turnover. Exp Gerontol. 2004 May;39(5):701-5. https://doi.org/10.1016/j.exger.2004.01.005
23. Juhász G, Erdi B, Sass M, Neufeld TP. Atg7-dependent autophagy promotes neuronal health, stress tolerance, and longevity but is dispensable for metamorphosis in Drosophila. Genes Dev. 2007 Dec;21(23):3061-6. https://doi.org/10.1101/gad.1600707 24. Kuma A, Hatano M, Matsui M, Yamamoto A, Nakaya H,
Yoshimori T et al. The role of autophagy during the early neonatal starvation period. Nature. 2004 Dec;432(7020):1032-6. https://doi.org/10.1038/nature03029
25. Meléndez A, Tallóczy Z, Seaman M, Eskelinen EL, Hall DH, Levine B. Autophagy genes are essential for dauer development and life-span extension in C. elegans. Science. 2003 Sep;301(5638):1387-91. https://doi.org/10.1126/science.1087782
26. Mariño G, Fernández AF, Cabrera S, Lundberg YW, Cabanillas R, Rodríguez F et al. Autophagy is essential for mouse sense of balance. J Clin Invest. 2010 Jul;120(7):2331-44. https://doi.org/10.1172/JCI42601
27. Christensen KE, Wu Q, Wang X, Deng L, Caudill MA, Rozen R. Steatosis in mice is associated with gender, folate intake, and expression of genes of one-carbon metabolism. J Nutr. 2010 Oct;140(10):1736-41. https://doi.org/10.3945/jn.110.124917 28. Demidenko ZN, Zubova SG, Bukreeva EI, Pospelov VA, Pospelova TV,
Blagosklonny MV. Rapamycin decelerates cellular senescence. Cell Cycle. 2009 Jun;8(12):1888-95. https://doi.org/10.4161/cc.8.12.8606 29. Demidenko ZN, Korotchkina LG, Gudkov AV, Blagosklonny
MV. Paradoxical suppression of cellular senescence by p53. Proc Natl Acad Sci USA. 2010 May;107(21):9660-4. https://doi.org/10.1073/pnas.1002298107
30. Ali IK, McKendrick L, Morley SJ, Jackson RJ. Truncated initiation factor eIF4G lacking an eIF4E binding site can support capped mRNA translation. EMBO J. 2001 Aug;20(15):4233-42. https://doi.org/10.1093/emboj/20.15.4233
31. Saez I, Vilchez D. The mechanistic links between proteasome activity, aging and age-related diseases. Curr Genomics. 2014 Feb;15(1):38-51. https://doi.org/10.2174/138920291501140306113344 32. Mazzotti DR, Guindalini C, Moraes WA, Andersen ML, Cendoroglo
MS, Ramos LR et al. Human longevity is associated with regular sleep patterns, maintenance of slow wave sleep, and favorable lipid profile. Front Aging Neurosci. 2014 Jun;6:134. https://doi.org/10.3389/fnagi.2014.00134
33. Wang F, Nguyen M, Qin FX, Tong Q. SIRT2 deacetylates FOXO3a in response to oxidative stress and caloric restriction. Aging Cell. 2007 Aug;6(4):505-14. https://doi.org/10.1111/j.1474-9726.2007.00304.x 34. Tucci P. Caloric restriction: is mammalian life extension
35. Mihara M, Erster S, Zaika A, Petrenko O, Chittenden T, Pancoska P et al. p53 has a direct apoptogenic role at the mitochondria. Mol Cell. 2003 Mar;11(3):577-90. https://doi.org/10.1016/S1097-2765(03)00050-9 36. Deng X, Gao F, Flagg T, Anderson J, May WS. Bcl2’s flexible loop
domain regulates p53 binding and survival. Mol Cell Biol. 2006 Jun;26(12):4421-34. https://doi.org/10.1128/MCB.01647-05 37. Tomita Y, Marchenko N, Erster S, Nemajerova A, Dehner A, Klein C et al.
WT p53, but not tumor-derived mutants, bind to Bcl2 via the DNA binding domain and induce mitochondrial permeabilization. J Biol Chem. 2006 Mar;281(13):8600-6. https://doi.org/10.1074/jbc.M507611200 38. Alberts B, J.A., Lewis J, Raff M, Roberts K, Walter P, Biologia
molecular da célula. 5a ed. Porto Alegre: Artmed; 2010.
39. Hong SE, Heo HS, Kim DH, Kim MS, Kim CH, Lee J et al. Revealing system-level correlations between aging and calorie restriction using a mouse transcriptome. Age (Dordr). 2010 Mar;32(1):15-30. https://doi.org/10.1007/s11357-009-9106-3
40. Zahn JM, Sonu R, Vogel H, Crane E, Mazan-Mamczarz K, Rabkin R et al. Transcriptional profiling of aging in human muscle reveals a common aging signature. PLoS Genet. 2006 Jul;2(7):e115. https://doi.org/10.1371/journal.pgen.0020115