Different sources of sulfur in diets of adult cats on the
urinary parameters and acid-base balance
Efeitos da adição de diferentes fontes de enxofre na dieta de gatos adultos em parâmetros urinários e equilíbrio ácido-básico
Dóris Pereira Halfen1 Alexandre de Mello Kessler2 Luciano Trevizan2 Juliana Toloi Jeremias3
Thiago Henrique Annibale Vendramini4 João Paulo Fernandes Santos4 Patricia Massae Oba4
Fabio Alves Teixeira1 Marcio Antonio Brunetto4* Aulus Cavalieri Carciofi3
ISSNe 1678-4596
INTRODUCTION
The macroelement composition of diets
has a strong influence on the acid-base status and
urinary pH of animals (KIENZLE et al., 1991; ALLEN & KRUGER, 2000; WAGNER et al., 2006).
Treatment for urolithiasis in dogs and cats has been
advent of new studies in the past century and as uroliths management is evolving, nutrition remains
a subject of much clinical interest and debate in
the management of these animals (LULICH et al.,
2016) since the urine pH has strong influence on 1Departamento de Clínica Veterinária, Universidade de São Paulo (USP), São Paulo, SP, Brasil.
2Departamento de Zootecnia, Universidade Federal do Rio Grande do Sul (UFRGS), Porto Alegre, RS, Brasil. 3Departamento de Clínica e Cirurgia Veterinária, Universidade Estadual Paulista (UNESP), Jaboticabal, SP, Brasil.
4Departamento de Nutrição e Produção Animal, Universidade de São Paulo (USP), Av. Prof. Dr. Orlando Marques de Paiva, 87, Cidade
Universitária, 05508-270, São Paulo, SP, Brasil. E-mail: mabrunetto@usp.br. *Corresponding author.
ABSTRACT: Urolithiasis is a common disorder in the veterinary clinic and is considered as one of the most frequently cause of morbidity. This disorder is closely associated with urinary pH and nutrition plays a key role in the control of this disease, because through dietary manipulation it is possible to modify the urinary pH. Sulfur is considered macroelement with a strong influence on the acid-base status and may be crucial to control urinary pH in cats. The purpose of this study was to evaluate the effects of addition of different sources of sulfur (S) in the diet of cats on the urinary parametersand acid-base balance. Forty-two healthy adult cats were divided into 3 groups, and each group of 14 cats received 7 diets in a complete randomized block design. Calcium sulfate (CaSO4), DL-methionine (DLM) and methionine hydroxy analog
(MHA) were added to a control diet in two levels (1.28g S/kg and 2.56g S/kg) to formulate 6 other experimental diets. The acid-base balance was evaluated by hemogasometry in samples of venous blood. The DLM at the highest level and MHA differed of the control diet in relation to urinary pH (P<0.05). Calcium sulfate; although, not differentiated from the control diet, has been shown to alter urinary pH despite its zero electrolyte balance. Apparently, the alkalizing effect of calcium was not sufficient to avoid sulfate acidification of the urine. Treatments showed
no alteration of the acid-base balance of the animals and no affect the consumption of the diets.
Key words: calcium sulfate, felines, methionine, methionine hydroxy analogue, urolithiasis.
RESUMO: A urolitíase é uma desordem comum na clínica veterinária, considerada como uma das maiores causas de morbidade. Esta desordem está intimamente associada ao pH urinário sendo que a nutrição desempenha papel fundamental no controle dessa doença, pois através da manipulação dietética é possível modificar o pH urinário. O enxofre é considerado um macroelemento com forte influência no equilíbrio ácido-básico e pode ser crucial para controlar o pH urinário em gatos. O objetivo deste estudo foi avaliar os efeitos da adição de diferentes fontes de enxofre (S) na dieta de gatos nos parâmetros urinários e no equilíbrio ácido-básico destes animais. 42 gatos adultos saudáveis foram divididos em 3 grupos e cada grupo de 14 gatos recebeu 7 dietas em um delineamento de blocos ao acaso. O sulfato de cálcio (CaSO4), a DL-metionina (DLM) e a metionina hidróxi-análoga (MHA) foram adicionados a uma dieta controle em dois níveis (1,28g
S/kg e 2,56g S/kg) para formular outras 6 dietas experimentais. O equilíbrio ácido-básico foi avaliado por hemogasometria em amostras de
sangue venoso. O DLM no teor mais alto e MHA diferiram da dieta controle em relação ao pH urinário (P<0,05). O sulfato de cálcio, embora não tenha diferido da dieta controle, demonstrou alterar o pH urinário apesar do seu equilíbrio eletrolítico nulo. Aparentemente, o efeito
alcalinizante do cálcio não foi suficiente para anular a acidificação da urina pelo sulfato. Os tratamentos não apresentaram alteração do equilíbrio ácido-básico dos animais e não afetaram o consumo das dietas experimentais.
Palavras-chave: felinos, metionina, metionina hidróxi-análoga, sulfato de cálcio, urolitíase.
certain types of urolith formation (BARTGES & CALLENS, 2015; BARTGES, 2016).
Struvite uroliths are associated with alkaline pH (close to or greater than 7.0) (LANGSTON et al.,
2008). Reduction of urinary pH has been shown to be effective in decreasing the incidence of formation
of these crystals (MARKWELL et al., 1998), and supplements are recommended to maintain urine at
a pH between 6.2 and 6.4 for the prevention of these uroliths and between pH 5.9 and 6.1 for dissolution
(ALLEN & KRUGER, 2000).
Addition of sulfur to cat diets may occur through sulfur-containing amino acids, like methionine, cysteine and taurine, and the supplementation of some microelements such as iron and copper sulfates. The DL-methionine (DLM) can
be used to correct the dietary amino acid balance and also as a urinary acidifier (FUNABA et al., 2000). Methionine hydroxy analog (MHA) has been recently
introduced into the formulation of diets for farm animals in order to replace DLM. No studies with cats were reported with this molecule. Theoretically, it would have higher acidifying capacity compared to methionine. Due to the lack of nitrogen, MHA receives a nitrogen atom in the liver and transforms it into L-methionine, a process that could reduce the urinary excretion of nitrogen (ammonia), thus
lowering the urine buffering capacity
(MARTÍN-VENEGAS et al., 2006). In other species, as in pigs,
the pH of the urine could be acidified by the inclusion of calcium sulfate (CaSO4) in different doses, being a higher dose responsible for greater acidification
(CANH et al. 1998).
During food formulation, several
approaches and ingredients can be used to balance
macroelements in order to achieve a properly
balanced diet. However, nutritionists need to have adequate information about the buffering potential
of each mineral source to make the correct decision during food formulation. Therefore, the present study evaluated the effects of the addition of three sulfur sources [calcium sulfate (CaSO4), DLM and MHA] in the diet on different urinary parameters and
acid-base equilibrium of adult cats.
MATERIALS AND METHODS
Animals and experimental design
The experiment was conducted at the
Laboratory for Research on Nutrition and Nutritional
Diseases of Dogs and Cats - Universidade Estadual Paulista, Jaboticabal, Brazil. All experimental
procedures were approved by the Animal Ethics
and Welfare Commission of FCAV/UNESP,
protocol number 017648/11. Cats belonged to the same laboratory colony. Cats’ health was assessed prior to the beginning of the survey by clinical and hematologic examination, as well as by urine analysis.
Forty-two healthy, adult, mixed-breed cats aged 4 ± 1.3 years and 4.1 ± 0.84kg of body
weight and seven experimental dry diets for cats were used. The experiment was conducted with 3 groups and each group of 14 cats received 7 diets
in a randomized complete block design (2 cats/diet
in each group), resulting in 6 cats/diet. Each block had a duration of 13 days with an interval of 2 days. Three sulfur sources, calcium sulfate, DLM, and MHA were added at two levels, 1.28 and 2.56g S/
kg of diet, into a basal extruded dry cat food with base excess (BE) around 100mEq/kg, previously
ground in a cutting mill equipped with a 1mm screen. In the control diet, no sulfur sources were added. After mixing all the ingredients, diets were
pelleted. Pelletization is a low shear and temperature
processing, so changes on added ingredients is not expected. Nutritional level was similar in all diets
(Table 1) and all were within recommendations for
adult cat maintenance (AAFCO, 2008).
The base excess (mEq/kg) was calculated by the formula: EB = (49.9 x Ca) + (82.3 x Mg) + (43.5 x Na) + (25.6 x K) - (64.6 x P) - (62.4 x S) -
(28.2 x Cl), the concentration of the elements being in g/kg DM.
Cats were kept in individual stainless
steel metabolic cages (90 x 80 x 90cm) equipped
with a system to separate feces and urine. Cats were fed once daily (08:00h) and the metabolizable energy of diets was calculated from their chemical composition, through the equation estimation
methodology described by the Nutrition
Requirements of Dogs and Cats (NRC, 2006). The amount of food supplied was calculated as 130 kcal ME per kg0.4 (NRC, 2006). Food was offered placed ad libitum until the next meal. Food intake was daily measured by weighting offered food and refusals.
Water was provided ad libitum.
Urine analysis
The first 7 days were used for diet
adaptation and the last 6 days for total urine collection,
in two periods. In the first period (days 8-10), urine
T2-N3), and pH with a pH meter (model DM20,
DIGIMED São Paulo, Brazil). The urine collected in 24h was maintained frozen. The urine produced in
72h was mixed and evaluated for sodium (mmol/L) and potassium (mmol/L) using an ion-selective method (AVL unit - OMNI4 – Roche, Brandford,
USA), and chloride (mmol/L) was determined by the Labtest - mercuric thiocyanate methodology (Ref. 49 Chlorides - Labtest) followed by spectrophotometry.
In the second period (days 11-13), urine was collected twice a day in plastic containers with HCl 6N (2mL per 100mL of urine) and kept refrigerated (4°C).
This measure has been reported as sufficient to reduce the urinary pH to about 1-2, preventing the
formation of crystals (GRIYTH & DUNN, 1978).
The urine collected in 24h was frozen. Calcium
(mg/dL), phosphorus (mg/dL), magnesium (mg/dL)
and sulfur (g/L) were measured in urine produced
in 72h. Calcium quantification was analyzed using
colorimetric method (CPC - cresolphthalein, calcium
Liquiform Ref 90, Labtest, Minas Gerais, Brazil).
Quantitative analysis of urinary phosphorus was
made by a modified endpoint reaction UV method
of Daly and Ertingshausen (Ref. 42 Liquiform UV
Phosphorus, Labtest, Minas Gerais, Brazil), and magnesium by the colorimetric method (Magon sulfonate, magnesium Ref. 90, Labtest, Minas Gerais, Brazil). Sulfur was measure using the turbidimetric method as described by AOAC (2006).
Blood gas analysis
Blood gas analysis of venous blood
was evaluated after 13d of diet consumption.
At 08:00am (before feeding) and 02:00pm (six
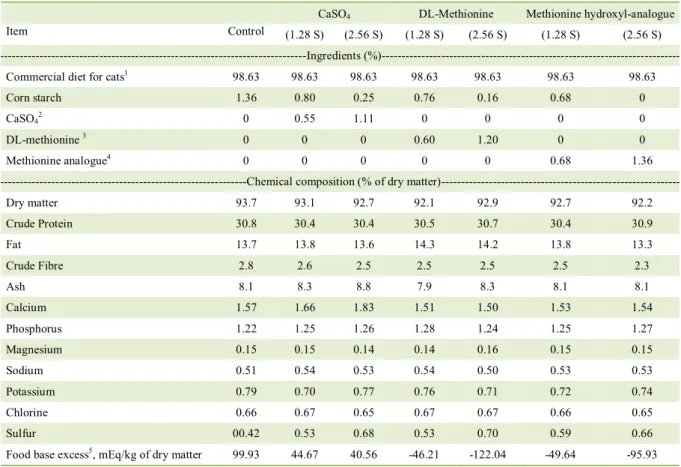
Table 1 - Ingredient and chemical composition of the experimental diets.
CaSO4 DL-Methionine Methionine hydroxyl-analogue
Item Control (1.28 S) (2.56 S) (1.28 S) (2.56 S) (1.28 S) (2.56 S)
---Ingredients
(%)---Commercial diet for cats1 98.63 98.63 98.63 98.63 98.63 98.63 98.63
Corn starch 1.36 0.80 0.25 0.76 0.16 0.68 0
CaSO42 0 0.55 1.11 0 0 0 0
DL-methionine 3 0 0 0 0.60 1.20 0 0
Methionine analogue4 0 0 0 0 0 0.68 1.36
---Chemical composition (% of dry
matter)---Dry matter 93.7 93.1 92.7 92.1 92.9 92.7 92.2
Crude Protein 30.8 30.4 30.4 30.5 30.7 30.4 30.9
Fat 13.7 13.8 13.6 14.3 14.2 13.8 13.3
Crude Fibre 2.8 2.6 2.5 2.5 2.5 2.5 2.3
Ash 8.1 8.3 8.8 7.9 8.3 8.1 8.1
Calcium 1.57 1.66 1.83 1.51 1.50 1.53 1.54
Phosphorus 1.22 1.25 1.26 1.28 1.24 1.25 1.27
Magnesium 0.15 0.15 0.14 0.14 0.16 0.15 0.15
Sodium 0.51 0.54 0.53 0.54 0.50 0.53 0.53
Potassium 0.79 0.70 0.77 0.76 0.71 0.72 0.74
Chlorine 0.66 0.67 0.65 0.67 0.67 0.66 0.65
Sulfur 00.42 0.53 0.68 0.53 0.70 0.59 0.66
Food base excess5, mEq/kg of dry matter 99.93 44.67 40.56 -46.21 -122.04 -49.64 -95.93
1Ingredient composition: maize, maize gluten meal, meat meal, wheat bran, soybean meal, fish meal, poultry by-products meal, poultry fat,
beet pulp, sodium chloride, flavour, calcium propionate, potassium sorbate, potassium chloride, vitamin and mineral premix. 2Labsynth
produtos para laboratório Ltda, Diadema, Brazil, 98% purity.3Evonik Degussa Corporation, Guarulhos, Brazil, 99% purity.4Alimet,Novus
International Inc., Indaiatuba, Brazil, 88% purity.5Food base excess (mEq/kg) = 49.9*Ca + 82.3*Mg + 43.5*Na + 25.6*K – 64.6*P – 62,4*S –
hours after feeding), 0.5mL of venous blood
was collected from the medial saphenous vein
without compression. Before blood was collected,
the syringe was washed out with a heparin
solution, leaving the dead-space filled. Blood
was immediately analyzed for pH, sodium (Na), potassium (K), ionized calcium (Cai), the partial
pressure of carbon dioxide (PCO2), bicarbonate
(HCO3), base excess (BE) and osmolality (Osm)
using Omini C Blood Gas Analyzer (Roche
Diagnostics, Indianapolis, USA).
Chemical analysis
Food samples were ground in a cutting
mill equipped with 1mm screen and analyzed for dry matter (DM) by submitting samples to oven drying; ash by muffle furnace incineration; and crude protein (CP) using the Kjeldahl method (AOAC, 2006). Samples were also analyzed for acid-hydrolyzed fat (AHF) using Soxhlet apparatus, and crude fiber (CF)
using the Weende method (AOAC, 2006).
Nitrogen-free extract (NFE) was calculated by subtracting ash, AHF, CP and CF components from DM (NFE = DM-ash-AHF-CP-CF). Minerals were analyzed after
nitric-perchloric digestion. Phosphorus was measured with the spectrophotometer using the
vanadate-molybdate method. Calcium, potassium, magnesium,
chloride, and sodium were measured by flame atomic absorption spectrophotometry.
Statistical analysis
Data were analyzed using the statistical software SAS (version 9.2, SAS Institute Inc., Cary, USA); analyzed in a randomised block design by ANOVA, seven treatments composed of diets in three blocks, and the averages of treatments were compared by the SNK test. The blocking factor was time, design adopted as the laboratory cannot evaluate 42 cats simultaneously.
For the urinary pH response, multiple regression analysis of the S levels was performed, comparing the different sources using the “Comparison of Regression Lines” module of Statgraphics plus 4.1.
Values of P<0.05 were considered significant.
RESULTS
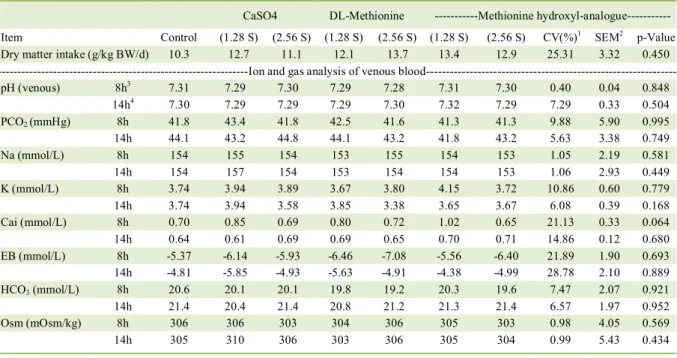
Cats showed no clinical changes throughout the experiment. The average daily food intake was 12.3 ± 3.6g/kg of DM BW/d (46.9 ± 13.7kcal/kg of BW/d). Only the ionic calcium (Cai) was below normal hemogasometric parameters for adult cats in
all experimental diets, before and after the food supply. Food consumption and blood gas values did not differ between groups (Table 2). The daily urine volume and
Table 2 - Dry matter intake and ion and gas analysis of venous blood of cats.
CaSO4 DL-Methionine ---Methionine hydroxyl-analogue---
Item Control (1.28 S) (2.56 S) (1.28 S) (2.56 S) (1.28 S) (2.56 S) CV(%)1 SEM2 p-Value
Dry matter intake (g/kg BW/d) 10.3 12.7 11.1 12.1 13.7 13.4 12.9 25.31 3.32 0.450
---Ion and gas analysis of venous blood---
pH (venous) 8h3 7.31 7.29 7.30 7.29 7.28 7.31 7.30 0.40 0.04 0.848
14h4 7.30 7.29 7.29 7.29 7.30 7.32 7.29 7.29 0.33 0.504
PCO2 (mmHg) 8h 41.8 43.4 41.8 42.5 41.6 41.3 41.3 9.88 5.90 0.995
14h 44.1 43.2 44.8 44.1 43.2 41.8 43.2 5.63 3.38 0.749
Na (mmol/L) 8h 154 155 154 153 155 154 153 1.05 2.19 0.581
14h 154 157 154 153 154 154 153 1.06 2.93 0.449
K (mmol/L) 8h 3.74 3.94 3.89 3.67 3.80 4.15 3.72 10.86 0.60 0.779
14h 3.74 3.94 3.58 3.85 3.38 3.65 3.67 6.08 0.39 0.168
Cai (mmol/L) 8h 0.70 0.85 0.69 0.80 0.72 1.02 0.65 21.13 0.33 0.064
14h 0.64 0.61 0.69 0.69 0.65 0.70 0.71 14.86 0.12 0.680
EB (mmol/L) 8h -5.37 -6.14 -5.93 -6.46 -7.08 -5.56 -6.40 21.89 1.90 0.693
14h -4.81 -5.85 -4.93 -5.63 -4.91 -4.38 -4.99 28.78 2.10 0.889
HCO3 (mmol/L) 8h 20.6 20.1 20.1 19.8 19.2 20.3 19.6 7.47 2.07 0.921
14h 21.4 20.4 21.4 20.8 21.2 21.3 21.4 6.57 1.97 0.952
Osm (mOsm/kg) 8h 306 306 303 304 306 305 303 0.98 4.05 0.569
14h 305 310 306 303 306 305 304 0.99 5.43 0.434
1
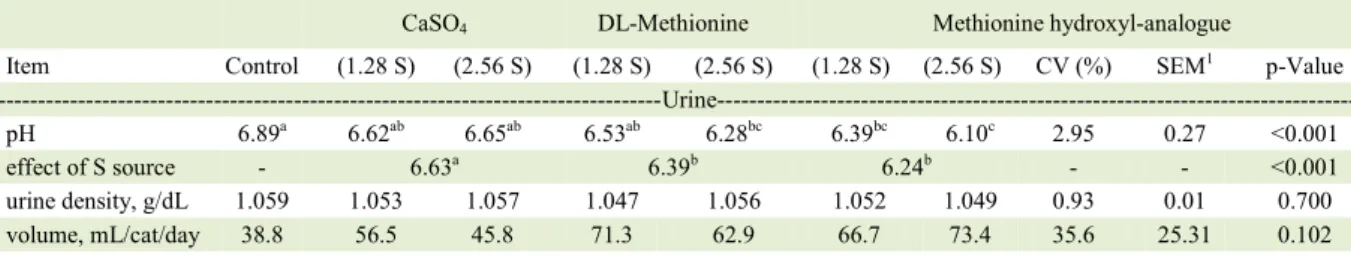
urine density showed no significant differences among treatments. Urine pH was affected by treatments, being
significantly different between control diet experimental
diets, with DLM 2.56g S/kg and MHA at both doses of sulfur (P<0.001, Table 3).When the effect of sulfur source was verified, calcium sulfate showed lower efficiency in urine acidification when compared to the other sources (P<0.001). There were significant
differences in the excretion of electrolytes. Cats fed with MHA diet (1.28 S) had increased renal excretion of
Ca2+, Na+, K+, and Cl- when compared to the control diet.
Phosphorus excretion was higher in cats fed with DLM diet (2.56 S) and MHA. Only cats fed with MHA diet
(2.56 S) showed significantly higher excretion of sulfur compared to control diet (P<0.05; Table 3).
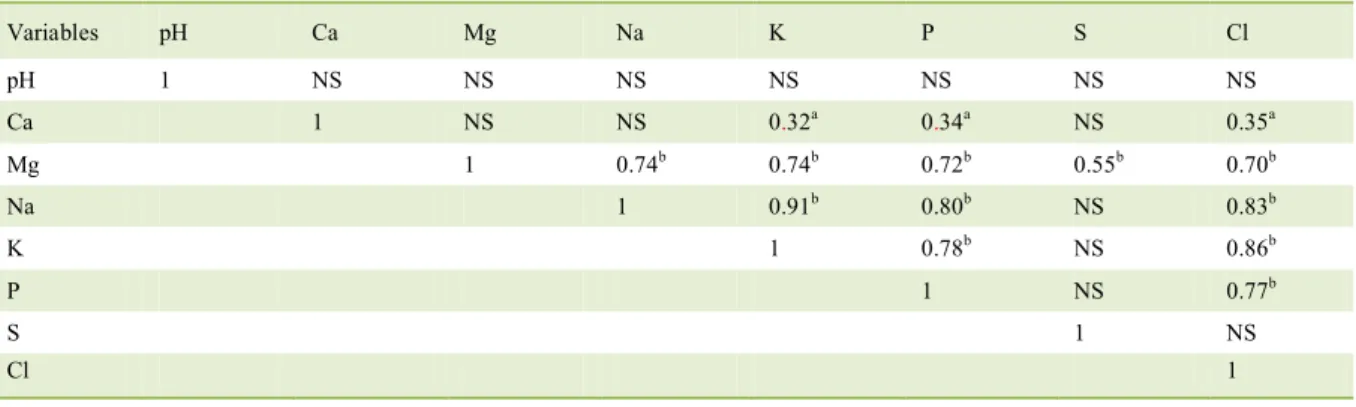
There was no correlation between urinary
pH and electrolyte excretion. Sulfur excretion was correlated only with Mg2+ excretion (R2=0.55, P<0.001), and this demonstrated the high correlation with Na+ (R2=0.74, P<0.001), K+ (R2=0.74, P<0001), phosphorus (R2=0.72,
P<0.001) and Cl- excretion (R2=0.70, P<0.001) (Table 4).
DISCUSSION
The hypocalcemia reported in this study (reference values of Cai: 1.15 to 1.3, DIBARTOLA,
2006) may possibly be explained by the use of
heparin in the syringe. Heparin tends to dilute
ionized calcium, decreasing its value in the sample (SCHENCK & CHEW, 2008) (Table 2).
The results showed that calcium sulfate showed lower efficiency in urine acidification compared to other sources (P<0.001). Electrolyte
balance of calcium sulfate is zero because the
positive divalent calcium charge counteracts the negative divalent anion sulfate (SO42-)
charge. For this reason, calcium sulfate should
not influence the acid-base balance and would
not change urinary pH. The addition of calcium
sulfate resulted in slight, but not significant, urinary acidification. This result may be related
to the alkalizing effect of calcium, which was not
strong enough to withdraw the acidifying effects of sulfur. Conversely, the BE of the diet with calcium sulfate was around 42mEq/kq, which is less than control diet (99.93mEq/kq) and causes a decrease in urinary pH, showing that other factors
not only electrolyte balance can affect urinary pH.
CANH et al. (1998) investigated the effects of calcium sulfate (CaSO4), calcium chloride
(CaCl2), calcium carbonate (CaCO3) and calcium
benzoate (C14H10CaO4) in diets for finishing pigs. The authors added these sources based on the
amount of calcium (7 and 10g Ca/kg) in the diet with high EB (320mEq/kg DM) and low EB (100mEq/kg
DM). The authors observed that calcium sulfate at both doses acidified urine, and the highest dose led to the greatest acidification. The result was similar to urine acidification caused by the ingestion of diets
containing calcium chloride. The authors explained
that Cl- and SO42- anions have higher absorption rate in the intestine than Ca2+. Furthermore, Ca2+ is maintained in the body, especially in bones
(KEMME-KROONSBERG, 1993), and has low
urinary excretion and blood circulation (GUYTON
& HALL, 2011). Conversely, in the present study, the fact that calcium sulfate was the sulfur source
less efficient in acidifying urine suggests that Ca2+ positively influenced urine pH, because all sources
initially contained the same amount of sulfur.
Another fact that may have influenced this parameter may be the different digestibility of the sources used, altering the effect of these and unbalancing the equal
amounts of S in the diets, unfortunately in this study this was not evaluated.
DLM and MHA did not result in differences in urinary pH each other, but they differed in the control group. The acidifying effects of DLM
supplementation were also confirmed by FUNABA
et al. (2000), who showed that the addition of 3%
DLM acidified feline urine pH compared to the
group without addition of DLM. When added at 1%,
DLM did not show efficacy. In the present study,
supplementation of 1.2% DLM was not effective in
reducing urinary pH, but 2.56% was, in comparison to the control group (Table 3).
Studies about MHA as urinary acidifier
have not received much attention and there are no
published data regarding its effectiveness in cats.
MIDDELBOS et al. (2006) evaluated the effect of DLM and MHA supplementation (0.1% and 0.2%) on canine urinary pH, and supplements were not
effective in acidifying urine pH, perhaps because the
doses used were very low. However, in the study of MIDDELBOS et al. (2006) cats fed with a diet with 0.1% MHA had a lower concentration of postprandial urinary calcium (mmol/L) than cats fed with diets with 0.1% DLM (P<0.10), unlike results reported in our study, which MHA diets increased urine calcium excretion compared with calcium sulfate.
According to MARTÍN-VENEGAS et al.
(2006), MHA is converted into L-Met through two
pathways: alpha carbon oxidation and transamination.
Ciência Rural, v.48, n.10, 2018.
Table 3 - Urine characteristics and macroelements intake and excretion by urine of cats.
CaSO4 DL-Methionine Methionine hydroxyl-analogue
Item Control (1.28 S) (2.56 S) (1.28 S) (2.56 S) (1.28 S) (2.56 S) CV (%) SEM1 p-Value
---Urine---pH 6.89a 6.62ab 6.65ab 6.53ab 6.28bc 6.39bc 6.10c 2.95 0.27 <0.001
effect of S source - 6.63a 6.39b 6.24b - - <0.001
urine density, g/dL 1.059 1.053 1.057 1.047 1.056 1.052 1.049 0.93 0.01 0.700 volume, mL/cat/day 38.8 56.5 45.8 71.3 62.9 66.7 73.4 35.6 25.31 0.102 ---Macroelements (mmol/kg BW/d, unless indicated otherwise)--- ---Ca---
-intake 4.74 5.13 5.25 4.43 5.22 5.43 5.27 22.43 1.36 0.886 urinary excretion 0.01 0.01 0.01 0.01 0.02 0.02 0.02 43.22 0.01 0.061
effect of S source - 0.01a 0.01ab 0.02b - - 0.030
% of intake
excreted by urine 0.3 0.3 0.3 0.2 0.4 0.4 0.4 32.16 0.19 0.211
---Mg---intake 0.77 0.76 0.69 0.68 0.89 0.90 0.91 22.42 0.20 0.206 urinary excretion 0.10 0.11 0.09 0.10 0.12 0.13 0.12 24.70 0.03 0.520
effect of S source - 0.10 0.11 0.12 - - 0.396
% of intake
excreted by urine 13.9 15.4 16.2 15.9 13.4 15.4 13.1 18.37 4.40 0.784
---Na---intake 2.14 3.14 2.48 3.06 3.28 3.41 3.41 24.54 0.77 0.089 urinary excretion 1.26b 1.89ab 1.41b 2.06ab 1.89ab 2.31a 1.77ab 24.55 0.50 0.031
effect of S source - 1.65a 1.97ab 2.04b - - 0.045
% of intake
excreted by urine 60.3 61.7 50.8 76.3 58.8 69.4 51.0 15.36 16.52 0.202
---K---intake 1.96 2.49 2.10 2.52 2.48 2.73 2.80 24.47 0.64 0.333 urinary excretion 1.42b 2.23ab 1.67ab 2.32ab 2.39ab 2.57a 2.26ab 25.28 0.58 0.039
effect of S source - 1.95a 2.35b 2.41b - - 0.041
% of intake
excreted by urine 73.9 91.7 84.9 108.2 98.9 98.9 80.9 18.63 27.89 0.464
---P---intake 4.74 5 4.71 4.86 5.40 5.71 5.83 22.46 1.34 0.664 urinary excretion 0.87a 0.75ab 0.49b 0.78ab 0.88a 1.11a 0.91a 19.09 0.21 0.002
effect of S source - 0.62a 0.83a 1.01b - - 0.002
% of intake
excreted by urine 18.3a 15.4ab 11.2b 17.1a 16.3a 19.3a 15.4ab 12.64 3.07 0.003
---S---intake 1.61d 2.10bcd 2.47abcd 1.91cd 2.94ab 2.64abc 3.18a 21.41 0.59 <0.001 urinary excretion 0.39b 0.86ab 0.72ab 0.55ab 0.76ab 0.66ab 1.02a 31.95 0.29 0.024
effect of S source - 0.79 0.65 0.84 - - 0.085
% of intake
excreted by urine 25.9 40.3 33.2 29.3 25.7 26.7 33.1 33.64 10.92 0.249
---Cl---intake 2.16 2.63 2.14 2.74 2.84 2.92 2.88 23.02 0.64 0.336 urinary excretion 1.94c 2.56abc 2.06bc 2.83abc 3.47ab 3.77a 3.44ab 25.05 0.87 0.006
effect of S source - 2.31a 3.15b 3.60b - - 0.015
% of intake
excreted by urine 94.5 99.4 98.8 100.8 107.0 100.0 107.4 107.2 27.62 0.237
to DLM, suggesting that MHA is preferably shifted through the transsulfuration route and subsequent
formation of sulfate ions. A further explanation of the acidifying effect of MHA is that MHA does not have nitrogen in its molecule, and must receive an N in the liver to turn into L-methionine (L-Met). The result is lower nitrogen excretion, with lower ammonia
excretion and lower acid buffering in the urine.
LEMANN & RELMAN (1959) evaluated
the effects of the DLM sulfur metabolism in humans. They observed that the urine pH seemed to be related to the acid-base balance, but was independent of the
amount of sulfate excreted. Associated with urinary
acidification, the authors observed an increase in “net
acid”, mainly in the form of ammonium. They also
observed high potassium, calcium and phosphate excretion, probably originated from titratable acids (buffers). Approximately 70% of sulfur supplied by
DLM was excreted as inorganic sulfate. Reactions that lead to the formation of this compound are the sole source of endogenous acid derivatives from
sulfur metabolism. The authors suggested that for each mole of oxidized sulfur, there is the production of two equivalents of hydrogen ions, being the hydrogen source part of the methionine metabolism, generated by oxidation of cysteine into cysteine
sulphinic acid and deamination or transamination of cysteine sulphinate into ß-sulphinyl pyruvate. The
final oxidation of sulfite to sulfate does not yield
additional acid.
In relation to the urinary excretion of electrolytes in cats, few studies have evaluated such
information and all are different from those verified in
this study. In an earlier study, PALMORE et al. (1978)
evaluated the dietary effects of feline urine. More
recently, WAGNER et al. (2006) verified the influence of feeding of excess bases on urine parameters in cats;
and PASSLACK & ZENTEK (2013) investigated the impact of calcium (Ca) and phosphorus (P) on the feline urine composition. Table 3 shows the results of the urinary excretion of electrolytesreported in this
study. Calcium excretion was influenced by sulfur
source. Urinary calcium excretion was quite low (less than 0.5% of calcium intake) and an increase
in urinary calcium was observed in MHA treatments, even though it biological importance is possible negligible. LULICH et al. (2004) reported urinary calcium excretion of 0.018 ± 0.015mmol/kg of body
weight (BW) per 24h in cats fed with a diet containing 0.84% calcium, which is similar to values reported in this study. In relation to Mg2+, the mean value found
by LULICH et al. (2004) was 0.033 ± 0.016mmol/kg
BW per 24h in cats fed with a diet containing 0.07%
Mg2+, less than values reported in this study because
diets contained practically twice as much; however,
urinary pH influences the Mg excretion, and the diets
of the studies and the sources used are different,
which makes the comparison between studies
difficult. They reported urinary Na+ concentration of
1.149 ± 0.524 and K+ of 1.684 ± 0.479mmol/kg BW per 24h in cats fed with diet containing 0.28% Na+ and 0.72% K+, values similar to those found in this experiment. K+ excretion is mostly urinary (90-95%) and in situations of acidosis, increased extracellular
potassium occurs because the high availability of
H+ ions decreases the activity of the Na+/K+ pump, reducing the uptake of K+ by cells, which increases the extracellular concentration and increases urinary
Table 4 - Correlation between the electrolytes excreted in the urine of cats.
Variables pH Ca Mg Na K P S Cl
pH 1 NS NS NS NS NS NS NS
Ca 1 NS NS 0.32a 0.34a NS 0.35a
Mg 1 0.74b 0.74b 0.72b 0.55b 0.70b
Na 1 0.91b 0.80b NS 0.83b
K 1 0.78b NS 0.86b
P 1 NS 0.77b
S 1 NS
Cl 1
a
excretion. Similar results regarding increased K+
excretion were found by LEMANN & RELMAN
(1959). No differences were reported in Na+ excretion
when assessing the relationship between sulfur metabolism and excretion of electrolytes in humans.
LULICH et al. (2004) found 0.530 ± 0.271mmol/kg BW of phosphate per 24h in cats fed with a diet containing 0.68% P. The amounts of phosphate excretion were close to those reported in this study. However, phosphate excretion was
significantly lower in cats fed with a diet containing
calcium sulfate (2.56 S) compared to a diet containing
MHA (1.28 S). This may be due to the higher Ca2+
intake, which reduces the urinary excretion of
phosphorus and magnesium. This can be explained by the formation of an insoluble
calcium-magnesium-phosphate complex in the lumen of the intestine,
which lowers the concentration of soluble phosphorus
and magnesium (PASTOOR et al., 1994).
LULICH et al. (2004) found mean chloride concentration of 1.716 ± 0.842mmol/kg BW per 24h in cats fed with a diet containing 0.6% chlorine. The
Cl- values reported in this experiment were higher. One
possible explanation may be acidosis due to increased
concentration of H+ ions, which combine with
ammonia generating ammonium ion, being excreted
as ammonium chloride (ALLEN & KRUGER, 2000).
CONCLUSION
The DLM at the 2.56g S/kg level and the
MHA at the levels, 1.28 and 2.56 g S/kg acidified
the urinary pH. Calcium sulfate; although, not
differentiated from the control diet, has been shown to alter pH despite its zero electrolyte balance.
Apparently, the alkalizing effect of calcium was not
sufficient to void sulfate acidification of the urine. Treatments showed no alteration of the acid-base balance of the animals or affect the consumption of
the diets.
ACKNOWLEDGEMENTS
To Mogiana Alimentos Ltda (Guabi), for the financial, technical support. To Coordenação de Aperfeiçoamento de Pessoal de Nível Superior (CAPES) foundation for the author supported.
BIOETHICS AND BIOSSECURITY COMMITTEE APPROVAL
All experimental procedures were approved by the
Ethics Research Committee for Animal Welfare of the College of Agrarian and Veterinary Sciences, Universidade Estadual Paulista
(protocol number 017648/11).
AUTHORS’ CONTRIBUTIONS
All authors contributed equally for the conception
and writing of the manuscript. All authors critically revised the
manuscript and approved of the final version.
REFERENCES
ASSOCIATION OF AMERICAN FEED CONTROL OFFICIALS (AAFCO). Methods for substantiating nutritional adequacy of dog and cat foods. Oxford: Association of American Feed
Control Officials, 2008. Available from: <http://www.aafco.org>.
Accessed: May 20, 2017.
ALLEN, T.A., KRUGER, J.M. Small Animal Clinical Nutrition. In: Feline lower urinary tract disease. Topeka: Mark Morris Associates, 2000. p.689-723.
ASSOCIATION OF OFFICIAL ANALYTICAL CHEMISTS (AOAC). Official Methods of Analysis. Gaithersburgs:
Association of Official Analytical Chemists, 2006, p. 1141.
BARTGES, J.W. Feline Calcium Oxalate Urolithiasis: Risk factors and rational treatment approaches. Journal of Feline medicine and Surgery, v.18, p.712-22, 2016. Available from:
<http://journals.sagepub.com/doi/abs/10.1177/1098612X1666 0442?url_ver=Z39.88-2003&rfr_id=ori%3Arid%3Acrossref. org&rfr_dat=cr_pub%3Dpubmed&>. Accessed: Jun. 02, 2017. doi: 10.1177/1098612X16660442.
BARTGES, J.W.; CALLENS, A.J. Urolithiasis. Veterinary Clinics: Small Animal Practice, v.45, p.747–768, 2015. Available
from:
<http://www.vetsmall.theclinics.com/article/S0195-5616(15)00046-7/fulltext>. Accessed: Jun. 07, 2017. doi: 10.1016/j.cvsm.2015.03.001.
CANH, T.T. et al. Influence of electrolyte balance and acidifying calcium salts in the diet of growing-finishing pigs on urinary pH, slurry pH and ammonia volatilization from slurry. Livestock Production Science, v.56, p.1-13, 1998. Available from: <http://
www.sciencedirect.com/science/article/pii/S0301622698001481>.
Accessed: Jun. 07, 2017. doi: 10.1016/S0301-6226(98)00148-1.
DIBARTOLA, S.P. Fluid therapy in small animal practice. Philadelphia: Pennsylvania, 2006. 611p.
FUNABA, M,T. et al. Effect of supplementation of dry cat food with DL-Methionine and ammonium chloride on struvite activity product and sediment in urine. Journal of Veterinary medical Science, v.36, p.337-339, 2000. Available from: <https://www.
jstage.jst.go.jp/article/jvms/63/3/63_3_337/_article>. Accessed: Apr. 28, 2017. doi: 10.1292/jvms.63.337.
GRIYTH, D.P.; DUNN, D. Collection and preservation of urine
for biochemical analyses. Investigative Urology, v. 15, p.
459-461, 1978. Available from: <https://www.ncbi.nlm.nih.gov/ pubmed/649294>. Accessed: Apr. 27, 2017.
GUYTON, A.C.; HALL, J.E. Tratado de fisiologia médica. Rio
de Janeiro: Guanabara Koogan, 2011. 1176p.
KIENZLE, E. et al. Influence of food composition on the urine
pH in cats. Journal of Nutrition, v.121, p.87-88, 1991. Available
from: <http://jn.nutrition.org/content/121/11_Suppl/S87.long>.
Accessed: Apr. 28, 2017.
LANGSTON, C. et al. Diagnosis of urolithiasis. Compendium on Continuing Education for the Practising Veterinarian, v.30,
p.447–455, 2008. Available from: <https://pdfs.semanticscholar. org/7f36/7a099b84146169dacdcd71e669630d773753.pdf>.
Accessed: Apr. 28, 2017.
LEMANN, J.; RELMAN, A.S. The relationship of sulphur
metabolism to acid-base balance and electrolyte excretion: The
effects of DL-Methionine in normal man. Journal of Clinical Investigation, v.38, p.2215-2223, 1959. Available from:
<https://www.ncbi.nlm.nih.gov/pmc/articles/PMC293313/>.
Accessed: May 19, 2017.
LULICH, J.P. et al. Effects of diet on urine composition of cats with calcium oxalate urolithiasis. Journal of the American Animal Hospital Association, v.40, p.185-191, 2004. Available
from: <http://jaaha.org/doi/10.5326/0400185?url_ver=Z39.88-2003&rfr_id=ori:rid:crossref.org&rfr_dat=cr_pub%3dpubmed>.
Accessed: May 09, 2017. doi: 10.5326/0400185.
LULICH, J.P. et al. ACVIM small animal consensus recommendations on the treatment and prevention of uroliths in dogs and cats. Journal of Veterinary Internal Medicine, v.30,
p.1564–1574, 2016. Available from: <https://dx.doi.org/10.1111/ jvim.14559>. Accessed: May 11, 2017. doi: 10.1111/jvim.14559.
MARKWELL, P.J. et al. The effect of diet on lower urinary tract diseases in cats. The Journal of Nutrition, v.128, p. 2753–
2757, 1998. Available from: <https://www.ncbi.nlm.nih.gov/ pubmed/9868257>. Accessed: May 9, 2018.
MARTÍN-VENEGAS, R. et al. Conversion of the methionine hydroxy analogue DL-2- hydroxy-(4-methylthio) butanoic acid
to sulphur-containing amino acids in the chicken small intestine.
Poultry Science, v.85, p.1932-1938, 2006. Available from:
<https://www.ncbi.nlm.nih.gov/pubmed/17032826>. Accessed:
Apr. 28, 2017. doi: 10.1093/ps/85.11.1932.
MIDDELBOS, I.S. et al. Effects of dietary supplementation
of DL-methionine or 2-hydroxy-4-(methylthio)-butanoic acid on food intake, nutrient digestibility, nitrogen balance, urinary and blood metabolites in healthy, growing dogs. Archives of Animal Nutrition, v.60, p.301-316, 2006. Available from: <http://
www.tandfonline.com/doi/full/10.1080/17450390600785483>.
Accessed: Apr. 28, 2017. doi: 10.1080/17450390600785483.
NATIONAL RESEARCH COUNCIL (NRC). Nutrient requirements of dogs and cats. Washington : The National Academies Press, 2006. 424p.
PALMORE, W.P. et al. Effects of diet on feline urine. Laboratory Animal Science, v.28, p.551-555, 1978. Available from: <https://
www.ncbi.nlm.nih.gov/pubmed/723217>. Accessed: May 09, 2018.
PASSLACK, N.; ZENTEK, J. Urinary calcium and oxalate
excretion in healthy adult cats are not affected by increasing dietary levels of bone meal in a canned diet. PLoS One, v.5,
p.e70530, 2013. Available from: <http://journals.plos.org/plosone/ article?id=10.1371/journal.pone.0070530>. Accessed: May 09, 2018. doi: 10.1371/journal.pone.0070530.
PASTOOR, F.J. et al. Increasing calcium intakes lower urinary concentration of phosphorus and magnesium in adult
ovariectomized cats. Journal of Nutrition, v.124, p.299-304,
1994. Available from: <http://jn.nutrition.org/content/124/2/299. long>. Accessed: Apr. 28, 2017.
SCHENCK, P.A.; CHEW, D.J. Hypercalcemia: A quick reference.
Veterinary Clinics of North America: Small Animal Practice,
v.38, p.449-455, 2008. Available from: <http://www.sciencedirect. com/science/article/pii/S0195561608000338?via%3Dihub>. Accessed: Apr. 28, 2017. doi: 10.1016/j.cvsm.2008.01.020.
WAGNER, E. et al. Influence of the feed base excess on
urine parameters in cats. Journal of Animal Physiology and Animal Nutrition, v.90, p.19–24, 2006. Available from: <http://
onlinelibrary.wiley.com/doi/10.1111/j.1439-0396.2005.00613.x/ abstract;jsessionid=0538070126D31BEB32E2A37D8AEC ED93.f03t02>. Accessed: May 28, 2017. doi: