ISSN 0100-736X (Print) ISSN 1678-5150 (Online)
Original Article Pequenos Animais/Small Animals Diseases
RESUMO.- [Efeitos das fontes de cálcio na dieta de gatos adultos sobre parâmetros urinários e equilíbrio ácido-básico.] O cálcio (Ca) é um macroelemento que faz parte da composição mineral da dieta de animais de companhia. Este macroelemento é considerado um cátion de forte capacidade alcalinizante e, de acordo com a fonte e quantidade inclusa, pode aumentar o pH urinário. Os sais de cálcio têm diferentes solubilidades e dependendo do ânion ao qual o cálcio está associado, pode ser mais ou menos absorvido e assim, alterar o pH da urina. O objetivo deste estudo foi avaliar os efeitos de duas fontes de cálcio na alcalinização do pH urinário, bem como a excreção de eletrólitos urinários
ABSTRACT.- Halfen D.P., Kessler A.M., Trevizan L., Vendramini T.H.A., Santos J.P.F., Pedrinelli V., Brunetto M.A. & Carciofi A.C. 2018. Effect of calcium sources in the diets of adult cats on urinary parameters and acid-base balance.Pesquisa Veterinária Brasileira 38(11):2133-2138. Departamento de Nutrição e Produção Animal, Faculdade de Medicina Veterinária e Zootecnia, Universidade de São Paulo, Av. Duque de Caxias Norte 225, Pirassununga, SP 19635-900, Brazil. E-mail: [email protected]
Calcium is a macroelement that is part of the mineral composition of the diet of companion animals, and is considered a cation of strong alkalizing power, increasing urinary pH. Calcium salts have different solubilities and depending on the anion to which calcium is associated with, it can be more or less absorbed, modifying the pH of the urine. The aim of this study was to evaluate the efficiency of calcium sources on alkalinization of urinary pH, as well as excretion of urinary electrolytes and acid-base balance of adult cats. An extruded diet for cats was selected, and had 160mEq/kg of calcium from the sources of either calcium carbonate (CaCO3) or calcium gluconate (C12H22CaO14) added. In the control treatment there was no addition of calcium sources, resulting in three treatments. Nine adult cats were used, mixed breed, in two experimental periods, with six replicates per treatment. Animal average age was 4±1.3 years old and average weight was 3.96±0.71kg. The cats remained in metabolic cages for an adaptation period of seven days, followed by six days of urine total collection, with volume, density, pH and calcium concentration (g/d) measurements. The acid-base balance was studied by blood gas analysis of venous blood. The two sources of calcium alkalinized the urine (P<0.001). However, calcium gluconate had less alkalinization power compared to the calcium carbonate (P<0.05). Urinary calcium was not affected by treatments, and represented less than 0.5% of calcium intake. The experiment showed that calcium, although an alkaline cation and considered strong influencer of the EB of the diet, cannot be evaluated individually, because depending on its associated anion it may have greater or lesser influence on cats urine pH.
INDEX TERMS: Calcium, diets, cats, urinary parameters, acid-base balance, base excess, calcium carbonate, calcium gluconate, urinary calcium, urolithiasis, clinics.
PVB-5796 SA
Effect of calcium sources in the diets of adult cats on
urinary parameters and acid-base balance
1Dóris P. Halfen2, Alexandre M. Kessler3, Luciano Trevizan3,
Thiago H.A. Vendramini4, João P.F. Santos4, Vivian Pedrinelli2, Marcio A. Brunetto4*
and Aulus C. Carciofi5
1 Received on March 27, 2018.
Accepted for publication on May 7, 2018.
2 Departamento de Clínica Veterinária, Universidade de São Paulo (USP), Avenida Prof. Dr. Orlando Marques de Paiva 87, Cidade Universitária, São Paulo, SP 05508-270, Brazil.
3 Departamento de Zootecnia, Universidade Federal do Rio Grande do Sul, Porto Alegre (UFRGS), Av. Bento Gonçalves 2600, Porto Alegre, 91540-500, Brazil.
4 Departamento de Nutrição e Produção Animal, Universidade de São Paulo (USP), Avenida Prof. Dr. Orlando Marques de Paiva 87, Cidade Universitária, São Paulo, SP 05508-270. *Corresponding author: [email protected]
5 Departamento de Clínica e Cirurgia Veterinárias, Universidade Estadual Paulista (Unesp), Via de acesso Prof. Paulo Donato Castellane s/n, Jaboticabal, SP 14884-900, Brazil.
os os urinários e equilíbrio ácido-básico].
.H.A., Santos J.P.F., Pedrinelli V., Brunetto M.A. & Carciofi A.C.
e o equilíbrio ácido-básico de felinos. Foi selecionada uma dieta extrusada para gatos e adicionados 160mEq/kg de cálcio das fontes carbonato de cálcio (CaCO3) ou gluconato de cálcio (C12H22CaO14). No tratamento controle, não houve adição de fontes de cálcio. Foram utilizados nove gatos adultos, de raças mistas, em dois períodos experimentais, com seis repetições por tratamento. Os animais apresentavam idade média de 4,0±1,3 anos e peso corporal médio de 3,96±0,71kg. Estes permaneceram em gaiolas metabólicas em período de adaptação durante sete dias, seguido de coleta total de urina durante seis dias. Nestas amostras foram aferidos o volume, densidade, pH e concentração de cálcio (g/d). O equilíbrio ácido-básico foi avaliado por hemogasometria em amostras de sangue venoso. As duas fontes de cálcio alcalinizaram a urina (P<0,001). No entanto, o gluconato de cálcio apresentou menor potencial de alcalinização em comparação ao carbonato de cálcio (P<0,05). O cálcio urinário não foi afetado pelos tratamentos e representou menos de 0,5% da ingestão de Ca. O experimento demonstrou que o cálcio, apesar de ser um cátion alcalinizante e influenciador do EB da dieta, não pode ser avaliado individualmente, porque dependendo do ânion associado, pode apresentar maior ou menor influência no pH da urina de gatos.
TERMOS DE INDEXAÇÃO: Cálcio, dieta, felinos, parâmetros urinários, equilíbrio ácido-básico, carbonato de cálcio, cálcio urinário, excesso de base, gluconato de cálcio, urolitíase, clínica.
INTRODUCTION
Nutrition, through the manipulation of the electrolytic composition modifies the base excess of dietary (BE), which is a mEq difference between cations, such as calcium, and anions, calculated with predictive equations (Jeremias et al. 2013). BE can alter urinary pH (Allen & Kruger 2000), and changes in urine pH are, in fact, due to the impact of the cations and anions balance on the acid-base state of the animals (Pizzorno et al. 2010).
Urolithiasis in dogs and cats has been much studied in recent years and management of this disorder is evolving, with nutrition being a keystone for the management of these animals (Jeremias et al. 2013, Lulich et al. 2016), since diet influences urinary pH, and it has a strong influence on certain types of urolith formation (Bartges & Callens 2015, Bartges 2016).
The cations that most influence urinary pH are calcium (Ca), magnesium (Mg), sodium (Na) and potassium (K), and the anions are phosphorus (P), sulfur (S), and chlorine (Cl) (Block 1984). Thus, calcium is part of the mineral composition of the diet and is considered a cation of strong alkalizing power, increasing urinary pH by altering BE (Dibartola 2006). Calcium carbonate (CaCO3) is considered a strong dietary alkali (Kienzle et al. 1991), however other chemical forms of calcium, such as calcium sulfate, present cation-anion balance close to zero and may have lower effects on the acid-base status of animals.
Kienzle et al. (1991) and Pastoor et al. (1994a) obtained discrepant results regarding the action of calcium as a urinary alkalinizer. They observed that the addition of CaCO3 raised urinary pH, unlike calcium chloride (CaCl2), which acidified the pH. The acidifying effect of calcium chloride is due to the fact that calcium is less absorbed than chloride and urinary chloride
excretion decreases the excretion of bicarbonate and increases ammonium, acidifying the urinary pH (Pastoor et al. 1994a). Thus, considering that the effect of calcium on urinary pH is apparently influenced by the composition of calcium salts, and based on the need for new approaches and adequate information on the storage potential of each mineral source to make the right decision during cat food formulation, the present study evaluated the efficiency of two calcium sources on alkalinization of urinary pH, as well as excretion of urinary electrolytes and acid-base balance of adult cats.
MATERIALS AND METHODS
Ethics statement. The experiment was conducted at the Laboratory of Research on Nutrition and Nutritional Diseases of Dogs and Cats, São Paulo State University, Jaboticabal, Brazil, in compliance with procedures approved by the Ethics Research Committee for Animal Welfare of the College of Agrarian and Veterinary Sciences, São Paulo State University (protocol number 017648/11).
Animals and experimental design. Eighteen healthy adult mixed-breed cats aged 5±1.4 years and with 3.96±0.71kg of body weight. The experiment was conducted with 2 groups and each group of 9 cats received three diets in a randomized complete block design (3 cats/diet in each group), resulting in 6 cats/diet. The blocking factors were body weight (BW), body condition score (BCS) and age. About 3.21g Ca/kg (+160mEq/kg) of calcium carbonate (CaCO3) or calcium gluconate (C12H22CaO14) were added to a dry diet for cats with BE around -140mEq/kg. In the control diet, no calcium source was added. All diets were pelleted and their nutritional level was similar (Table 1), all being within recommendations for adult cat maintenance (AAFCO 2008). Calcium sources were added by replacing corn starch.
Cats belonged to the same laboratory colony, and their health was assessed prior to the beginning of the survey by clinical and hematologic examination, as well as by urine analysis. The animals were kept in individual stainless steel metabolic cages (90x80x90cm) equipped with a system to separate faeces and urine. Cats were fed once daily (8h00) and the metabolizable energy (ME) of diets was calculated from their chemical composition. The amount of food supplied was calculated as 130kcal ME per kg0.4 (NRC 2006). Water was provided ad libitum, and food was offered ad libitum until the next meal. Food intake was daily measured by weighing offered food and refusal amounts.
Urine analysis. Diet adaptation occurred from days 1 to 7, and the following 6 days were used for total urine collection, in two
periods. In the first period (days 8-10), urine was collected twice
daily in plastic containers with 0.1g of thymol (0.1g per 100mL of urine) and kept refrigerated (4°C). Immediately after collection, urine volume was measured, as well as urine density with a refractometer (model T2-N3, ATAGO CO., LTD, Tokyo, Japan), and pH with a pH meter (model DM20, DIGIMED, São Paulo, Brazil). The urine collected in 24h was maintained frozen. The urine produced in 72h was mixed and evaluated for sodium (mmol/L) and potassium (mmol/L) using an ion-selective method (AVL unit - OMNI4, Roche, Basel, Switzerland) determined by mercuric thiocyanate methodology (Labtest, Minas Gerais, Brazil) followed by spectrophotometry.
urine produced in 72h. Calcium quantification was analyzed using
colorimetric method (CPC - cresolphthalein, calcium Liquiform, Minas Gerais, Brazil), and magnesium by the colorimetric method (Magon sulfonate, magnesium Liquiform, Minas Gerais, Brazil).
Faecal score. Faecal score was always determined by the same researcher, according to a scale from 1 to 5, as follows: 1 = watery (liquid, can be poured from a container); 2 = soft, unshaped stool (assumes the shape of the container); 3 = soft, shaped, and moist
stool; 4 = firm, shaped, dry stool (remains firm and soft); 5 = hard,
dry pellets (small, hard masses) (De-Oliveira et al. 2008).
Blood gas analysis. After 13d of diet consumption, 0.5mL of venous blood was collected from the medial saphenous vein without compression, at 08:00 am (before feeding) and 02:00 pm (six hours after feeding). Before blood was collected, the syringe was washed
out with a heparin solution, leaving the dead-space filled. Blood was
immediately analyzed for pH, sodium, potassium, ionized calcium, partial pressure of carbon dioxide, bicarbonate, base excess and osmolality using Omini C Blood Gas Analyzer (Roche Diagnostics, Indianapolis, USA).
Chemical analysis. Diet samples were analyzed for dry matter
(DM), crude protein (CP), crude fiber (CF), mineral matter (MM) and
acid-hydrolyzed fat (AHF) according to AOAC (2006). The samples were ground in a cutting mill equipped with 1mm screen and analyzed
for DM by submitting samples to oven drying; ash by muffle furnace
incineration; and crude protein CP using the Kjeldahl method. Samples were also analyzed for AHF using Soxhlet apparatus, and CF using the Weende method (AOAC 2006). Nitrogen-free extract (NFE) was calculated by subtracting ash, AHF, CP and CF components from DM (NFE = DM-ash-AHF-CP-CF). Minerals were analyzed after nitric-perchloric digestion. Phosphorus was measured with the
spectrophotometer using the vanadate-molybdate method. Calcium, potassium, magnesium, chloride, and sodium were measured by
flame atomic absorption spectrophotometry.
Statistical analysis. Data were analyzed by the statistical software SAS (version 9.2, SAS Institute Inc., Cary, USA), in a randomised block design by ANOVA, three treatments in two blocks, and the averages of treatments were compared by the SNK test. All analyses were performed using GLM module from the Statigraphics plus
4.1 software. Values of p≤0.05 were considered significant.
RESULTS
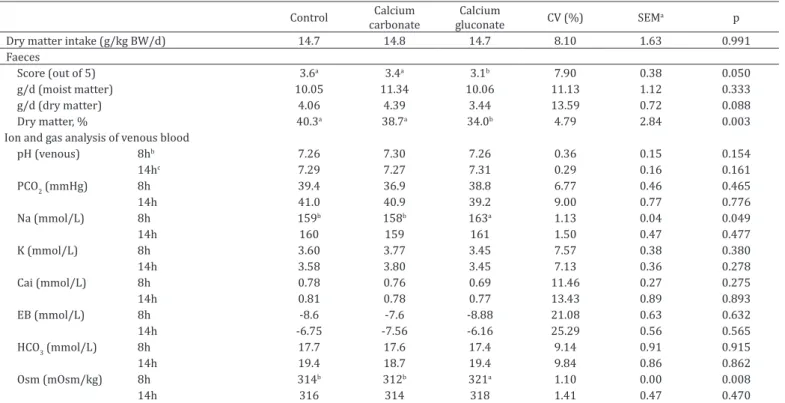
Cats showed average daily food intake of 14.7±1.5g/kg DM/ BW/d, which is considered satisfactory and did not differ among groups. The group fed with added calcium gluconate diet had lower faecal score (P=0.050) and faecal dry matter (P=0.003), and higher venous Na+ (P=0.049) and osmolality
(P=0.008; Table 2).
Daily urinary volume and urine density were not significantly different. Cats fed with diets with added calcium showed increased urine pH and the addition of calcium carbonate in the diet showed greater effect than calcium gluconate on pH, (P<0.001; Table 3).
Cats fed with control diet had increased Na+ excretion
(P=0.018). The group fed with calcium carbonate diet had lower percentage of urinary phosphorus excretion (P=0.044). The addition of calcium in either form did not result in increased excretion of phosphorus in urine (P=0.233; Table 3).
The correlation between urinary pH and Na+ excretion was
negative (R2=-0.49, P<0.05). Ca2+ excretion was correlated only
with the Mg2+ excretion (R2=0.49, P<0.05). Chloride excretion
(R2=0.79, P<0.001) was highly correlated with K+ excretion,
as well as K+ to Na+ (R2=0.47, P<0.05; Table 4).
DISCUSSION
Cats fed with diet containing calcium gluconate had lower faecal score (P=0.050) compared to cats that received control diet and diet with added calcium carbonate, which indicates production of faeces with higher moisture content (Table 2). Since there was no difference in urinary volume between groups, the possible explanation for higher water loss in the stool could be the increased osmolality by osmotic active glucose from gluconate. Blood gas analysis showed slight metabolic acidosis in control and calcium gluconate treatments, with pH, HCO3 and BE below normal values (Dibartola 2006), probably due to low BE of the control diet. However, deviations from normality were minimal and did not differ from calcium carbonate values. Ionized calcium was found below normal blood gas parameters for adult cats in all experimental diets, before and after feeding (Table 2). Hypocalcemia found in this study (reference values of iCa: 1.15 to 1.35; Dibartola 2006), may be explained by the use of heparin in the syringe for blood collection.
Na+ and osmolality values were higher (P<0.05) in the
treatment with calcium gluconate. Hypernatremia could have occurred by the presence of impermeable solutes such as glucose. Initially, the elevation of blood glucose draws intracellular water to the extracellular fluid in order to normalise osmolality, with consequent dilution of sodium and hyponatremia. Subsequently, there may be development of hypernatremia due to osmotic diuresis, which occurs as a
Table 1. Ingredient and chemical composition of the experimental diets
Control Calcium carbonate
Calcium gluconate Ingredients (%)
Commercial diet for catsa 96.49 96.49 96.49
Corn starch 3.51 2.70 0
Calcium carbonateb 0 0.81 0
Calcium gluconatec 0 0 3.51
Chemical composition (%, dry-matter basis)
Dry matter 91.4 93.5 92.9
Crude Protein 30.09 29.87 30.16
Fat 13.36 13.16 12.58
Crude Fibre 2.56 2.37 2.46
Ash 7.92 8.83 8.83
Calcium 1.53 1.79 1.86
Phosphorus 1.54 1.54 1.50
Magnesium 0.15 0.15 0.15
Sodium 0.54 0.50 0.51
Potassium 0.72 0.68 0.72
Chlorine 0.66 0.65 0.67
Sulphur 0.43 0.42 0.42
a Ingredient composition: maize, maize gluten meal, meat meal, wheat
bran, soybean meal, fish meal, poultry by-products meal, poultry fat, beet pulp, sodium chloride, flavour, calcium propionate, potassium sorbate,
Table 2. Dry matter intake, faecal parameters and ion gas analysis of venous blood of cats
Control Calcium carbonate
Calcium
gluconate CV (%) SEMa p
Dry matter intake (g/kg BW/d) 14.7 14.8 14.7 8.10 1.63 0.991
Faeces
Score (out of 5) 3.6a 3.4a 3.1b 7.90 0.38 0.050
g/d (moist matter) 10.05 11.34 10.06 11.13 1.12 0.333
g/d (dry matter) 4.06 4.39 3.44 13.59 0.72 0.088
Dry matter, % 40.3a 38.7a 34.0b 4.79 2.84 0.003
Ion and gas analysis of venous blood
pH (venous) 8hb 7.26 7.30 7.26 0.36 0.15 0.154
14hc 7.29 7.27 7.31 0.29 0.16 0.161
PCO2 (mmHg) 8h 39.4 36.9 38.8 6.77 0.46 0.465
14h 41.0 40.9 39.2 9.00 0.77 0.776
Na (mmol/L) 8h 159b 158b 163a 1.13 0.04 0.049
14h 160 159 161 1.50 0.47 0.477
K (mmol/L) 8h 3.60 3.77 3.45 7.57 0.38 0.380
14h 3.58 3.80 3.45 7.13 0.36 0.278
Cai (mmol/L) 8h 0.78 0.76 0.69 11.46 0.27 0.275
14h 0.81 0.78 0.77 13.43 0.89 0.893
EB (mmol/L) 8h -8.6 -7.6 -8.88 21.08 0.63 0.632
14h -6.75 -7.56 -6.16 25.29 0.56 0.565
HCO3 (mmol/L) 8h 17.7 17.6 17.4 9.14 0.91 0.915
14h 19.4 18.7 19.4 9.84 0.86 0.862
Osm (mOsm/kg) 8h 314b 312b 321a 1.10 0.00 0.008
14h 316 314 318 1.41 0.47 0.470
Means not sharing the same superscripts are significant different between feeding groups (p<0.05); a Standard error of the mean (n=6), b before animals fed, c 6h after after animals fed.
Table 3. Urine pH, specific gravity, and volume and macroelements intake and excreted by urine of cats
Control carbonateCalcium gluconateCalcium CV (%) SEMa P Urine
Ph 5.84c 6.35a 6.18b 1.42 0.12 <0.001
Specific gravity, g/dl 1.059 1.051 1.056 0.91 0.01 0.611
Volume, ml/cat/day 55.9 61.9 53.6 34.03 23.26 0.809
Macroelements, mmol/kg BW/d, unless indicated otherwise Ca
Intake 5.63b 7.05a 7.10a 7.59 00.68 0.003
Urinary excretion 0.02 0.01 0.02 22.44 0.009 0.233
% of intake excreted by urine 0.44 0.35 0.23 25.36 0.168 0.119
Mg
Intake 0.90 0.97 0.92 8.07 0.10 0.448
Urinary excretion 0.13 0.13 0.13 23.79 0.037 0.976
% of intake excreted by urine 14.65 14.05 14.41 21.12 3.54 0.957
Na
Intake 3.41 3.27 3.18 11.29 0.50 0.070
Urinary excretion 3.36a 2.05b 1.65b 28.31 0.95 0.018
% of intake excreted by urine 97.47a 62.34b 52.97b 25.93 25.87 0.022
K
Intake 2.69 2.68 2.65 11.28 0.414 0.984
Urinary excretion 2.21 2.52 2.06 17.29 0.66 0.551
% of intake excreted by urine 82.53 93.43 79.61 16.37 21.63 0.596
P
Intake 7.30 7.82 7.42 7.61 0.79 0.606
Urinary excretion 1.90 1.42 1.68 15.93 0.39 0.197
% of intake excreted by urine 26.48a 18.28b 22.66ab 13.56 4.54 0.044
Cl
Intake 2.99 2.98 2.95 11.25 0.43 0.988
Urinary excretion 2.56 3.23 2.96 15.51 0.76 0.339
% of intake excreted by urine 85.87 101.1 109.15 15.98 22.44 0.226
way of removing excess extracellular fluid (Dibartola 2006). Cats fed the diet with calcium gluconate showed no increase in urine volume, but had faeces with higher moisture content. Osmolality, calculated from the Na+, also increased.
Cats fed control the diet had lower calcium intake (P<0.05) due to lower calcium concentration in the diet, showing lower urinary pH, which is consistent with low dietary BE. Cats fed with the diet containing calcium carbonate showed higher urinary pH than cats fed with the diet with added calcium gluconate (P<0.001), although both groups had ingested similar amounts of calcium.
Cats that received the diet with calcium gluconate possibly absorbed more Ca2+, but still there was no greater urinary
Ca2+ excretion. Urine pH was more acidic than in cats fed the
diet containing calcium carbonate. Diet containing calcium carbonate may have had less Ca2+ absorption, but induced higher
urine alkalinization. This difference in the urine alkalization levels is similar to that observed between calcium chloride and calcium carbonate reported by Pastoor et al. (1994a). The authors observed that urine pH was always lower when calcium chloride was added to the diet, while the addition of calcium carbonate increased the urine pH. Kienzle et al. (1991) observed that the addition of calcium carbonate and calcium lactate (C6H10CaO6) increased urine pH, and calcium chloride acidified urine pH.
Although calcium is absorbed by the intestinal tract, not all is retained in tissues. About 90% of daily Ca2+ intake is
excreted in faeces, while the remaining is eliminated in urine (Guyton & Hall 1996). Despite being a high-power alkalinizing cation, its absorption is dependent on the associated anion, being more or less absorbed (Allen & Kruger 2000). Renal calcium excretion levels in healthy cats are low and seem to not be strictly correlated with dietary calcium intake (Zentek & Schulz 2004).
Pansu et al. (1993) studied the solubility and intestinal transit time limit of calcium absorption in rats. According to them, calcium carbonate has low solubility, and is preferably absorbed via transcellular in the proximal parts of the intestine, when it becomes slightly soluble in higher pH. Salts with greater solubility such as calcium gluconate will be soluble at higher pH values, which may be absorbed on other portions of the intestine, on calcium paracellular pathway, since it is considered non-saturable.
Passlack & Zentek (2013) investigated the impact of dietary calcium and phosphorus on urine composition of cats and demonstrated that increasing dietary calcium and phosphorus did not affect urinary mineral concentrations and had more influence on PTH levels. An increase in faecal calcium was observed, showing that the homeostatic regulatory process of calcium metabolism in cats seems to be related to the intestinal tract and not to renal excretion. Moreover, PTH enhances blood calcium concentration by increasing intestinal calcium absorption, reducing the renal calcium excretion (Healy et al. 2003).
Jeremias et al. (2013) observed that equations predicting base excess of foods tended to overestimate urine pH and according to the study, they could have some limitations. It is possible that not the entire acid load produced in the intermediary metabolism is related to food macroelements, because differences in absorption of certain acid and alkaline minerals are not taken into account.
Kienzle & Wilms-Eilers (1994) tested diets with ammonium chloride (NH4Cl) and observed that it suppresses postprandial alkaline tide when combined with calcium carbonate, but this effect can be reversed when it is associated with sodium carbonate (Na2CO3). Calcium carbonate is not readily soluble and therefore, it is absorbed more slowly while sodium carbonate is rapidly absorbed, contributing to the postprandial alkaline tide.
Lower urinary calcium excretion was also reported by Pastoor et al. (1994a), who evaluated the balance of daily Ca2+
in cats fed with a diet high in Ca2+ (13g/kg). The percentage
excreted in urine was approximately 0.59% of Ca2+ consumed
and faecal percentage was around 98% of Ca2+ consumed, similar to findings in the present experiment, which found even lower urinary calcium excretion levels.
In the calcium carbonate metabolism in human patients, Ca2+ was minimally excreted in the urine, while carbonate
contributes to the increased potential of bicarbonate buffer, demonstrating that carbonate is most likely responsible for urine alkalization (Clarkson et al. 1970).
In this study, urinary K+ and Ca2+ excretions were similar
to concentrations reported by Lulich et al. (2004). However, Na+, Mg2+ and P excretions were higher in this experiment
(Table 3), which may be related to the different amount of macrominerals in the diets.
In the control diet, high Na+ and phosphorus excretions
were observed and pH was negatively correlated with Na+
(R2=-0.49, P<0.05; Table 4). This can be explained by the
acid-base balance, which in an attempt to compensate for the metabolic acidosis, increases the excretion of H+ ions,
which are buffered by HPO4, forming H2PO4, which may be excreted as sodium salt (NaH2PO4). Phosphorus excretion in the treatment with calcium gluconate was significantly higher than in the treatment with calcium carbonate, which can also be explained by the buffering of HPO4.
According to Pastoor et al. (1994b), increased Ca2+
intake decreased phosphorus and Mg2+ absorption due to
the formation of insoluble calcium-magnesium-phosphate complexes (Brink et al. 1992). In this study, there was no difference in urinary Mg2+ excretion, but there was lower
phosphorus excretion in cats fed with the diet containing calcium carbonate. This may have occurred because calcium carbonate, due to its lower absorption or reexcretion into the intestinal lumen, may have had more time to react with phosphorus, generating complexes, which possibly could have increased its faecal excretion, concomitantly decreasing its urinary excretion. Calcium gluconate, due to its higher and
Table 4. Correlation between the electrolytes excreted in the urine of cats
pH Ca Mg Na K P Cl
pH 1 NS NS -0.49* NS NS NS
Ca 1 0.49* NS NS NS NS
Mg 1 NS NS 0.51* NS
Na 1 0.47* NS NS
K 1 NS 0.79**
P 1 NS
Cl 1
faster Ca2+ absorption, had less time for reactions and plays a
different role in urine pH when compared to calcium gluconate. This study has some limitations that should be considered: the major one was the lack of data regarding digestibility and faecal excretion of minerals, requiring further studies. In addition, Buckley et al. (2011) demonstrated that high water intake influences urinary evaluations in cats by increasing the urine volume, reducing the urine density. The amount of water ingested by cats was not measured in this study. However, no significant differences among evaluations mentioned above were observed.
CONCLUSIONS
The experiment demonstrated that calcium carbonate and gluconate of calcium alkalinized the urine. Calcium carbonate has highest potential than calcium gluconate, which demonstrates that carbonate also contributes to alkalinization, and this action is not exclusive to calcium.
The calcium ion should not be evaluated in isolation, since its presence in urine affects the urinary pH variably according to the anion forming the different Ca salts.
Conflict of interest statement.- The authors have no competing interests.
Acknowledgements.- The authors are grateful to Mogiana Alimentos Ltda
(Guabi), for the financial, technical support, and to CAPES foundation for
the author supported.
REFERENCES
AAFCO 2008. Association of American Feed Control Officials. Association of American Feed Control Officials, Oxford. 246p.
Allen T.A. & Kruger J.M. 2000. Feline lower urinary tract disease, p.689-723. In: Hand M.S., Thatcher C.D., Remillard R.L. & Roudebush P. (Eds), Small Animal Clinical Nutrition. 4th ed. Mark Morris Institute, Topeka. AOAC 2006. Official methods of analysis. 18th ed. Association of Official
Analytical Chemist, Arlington. 1141p.
Bartges J.W. 2016. Feline calcium oxalate urolithiasis: risk factors and rational treatment approaches. J. Feline Med. Surg. 18(9):712-722. <http://dx.doi. org/10.1177/1098612X16660442> <PMid:27562981>
Bartges J.W. & Callens A.J. 2015. Urolithiasis. Vet. Clin. N. Am., Small Anim. Pract. 45(4):747-768. <http://dx.doi.org/10.1016/j.cvsm.2015.03.001> Block E. 1984. Manipulating dietary anions and cations for prepartum dairy cows to reduce incidence of milk fever. J. Dairy Sci. 67(12):2939-2948. <http://dx.doi.org/10.3168/jds.S0022-0302(84)81657-4> <PMid:6530489> Brink E.J., Beynen A.C., Dekker P.R., Van Beresteijn E.C.H. & Van der Meer R. 1992. Interaction of calcium and phosphate decreases ileal magnesium solubility and apparent magnesium absorption in rats. J. Nutr. 122(3):580-586. <http://dx.doi.org/10.1093/jn/122.3.580> <PMid:1542015> Buckley C.M., Hawthorne A., Colyer A. & Stevenson A.E. 2011. Effect of dietary
water intake on urinary output, specific gravity and relative supersaturation for calcium oxalate and struvite in the cat. Brit. J. Nutr. 106(Suppl.1):S128-S130. <http://dx.doi.org/10.1017/S0007114511001875> <PMid:22005408> Clarkson E., Durrant C., Phillips M., Gower P., Jewkes R. & De Wardener H.E.
1970. The effect of a high intake of calcium and phosphate in normal subjects and patients with chronic renal failure. Clin. Sci. 39(6):693-704. <http://dx.doi.org/10.1042/cs0390693> <PMid:5493940>
De-Oliveira L.D., Carciofi A.C., Oliveira M.C.C., Vasconcellos R.S., Bazolli R.S., Pereira G.T. & Prada F. 2008. Effects of six carbohydrate sources on diet digestibility and postprandial glucose and insulin responses in cats. J. Anim. Sci. 86(9):2237-2246. <http://dx.doi.org/10.2527/jas.2007-0354> <PMid:18469063>
Dibartola S.P. 2006. Fluid Therapy in Small Animal Practice. Philadelphia, Pennsylvania. 611p.
Griyth D.P. & Dunn D. 1978. Collection and preservation of urine for biochemical analyses. Investig. Urol. 15(6):459-461. <PMid:649294>.
Guyton A.C. & Hall J.E. 1996. Tratado de Fisiologia Médica. Guanabara Koogan, Rio de Janeiro. 1176p.
Healy K.D., Zella J.B., Prahl J.M. & DeLuca H.F. 2003. Regulation of the murine renal vitamin D receptor by 1,25-dihydroxyvitamin D3 and calcium. Proc. Natl. Acad. Sci. U.S.A. 100(17):9733-9737. <http://dx.doi.org/10.1073/ pnas.1633774100> <PMid:12900504>
Jeremias J.T., Nogueira S.P., Brunetto M.A., Pereira G.T., Loureiro B.A., Ferreira C.S., Gomes M.O.S. & Carciofi A.C. 2013. Predictive formulas for food base excess and urine pH estimations of cats. Anim. Feed Sci. Technol. 182(1/4):82-92. <http://dx.doi.org/10.1016/j.anifeedsci.2013.04.003> Kienzle E. & Wilms-Eilers S.K. 1994. Struvite diets in cats: effect of
ammonium chloride and carbonates on acid base balance of cats. J. Nutr. 124(Suppl.12):2652-2659. <http://dx.doi.org/10.1093/jn/124. suppl_12.2652S>
Kienzle E., Schuknecht A. & Meyer H. 1991. Influence of food composition on the urine pH in cats. J. Nutr. 121(Suppl.11):S87-S88. <http://dx.doi. org/10.1093/jn/121.suppl_11.S87> <PMid:1941250>
Lulich J.P., Osborne C.A., Lekcharoensuk C., Kirk C.A. & Bartges J.W. 2004. Effects of diet on urine composition of cats with calcium oxalate urolithiasis. J. Am. Anim. Hosp. Assoc. 40(3):185-191. <http://dx.doi.org/10.5326/0400185> <PMid:15131098>
Lulich J.P., Berent A.C., Adams L.G., Westropp J.L., Bartges J.W. & Osborne C.A. 2016. ACVIM Small Animal Consensus Recommendations on the Treatment and Prevention of Uroliths in Dogs and Cats. J. Vet. Intern. Med. 30(5):1564-1574. <http://dx.doi.org/10.1111/jvim.14559> <PMid:27611724> NRC 2006. Nutrient requirements of dogs and cats. National Research Council,
National Academy of Science Press, Washington. 424p.
Pansu D., Duflos C., Bellaton C. & Bronner F. 1993. Solubility and intestinal transit time limit calcium absorption in rats. J. Nutr. 123(8):1396-1404. <PMid:8336210>
Passlack N. & Zentek J. 2013. Urinary calcium and oxalate excretion in healthy adult cats are not affected by increasing dietary levels of bone meal in a canned diet. PloS One 8(8):e70530. <http://dx.doi.org/10.1371/journal. pone.0070530> <PMid:23940588>
Pastoor F.J., Opitz R., Van ’t Klooster A.T. & Beynen A.C. 1994a. Dietary calcium chloride vs. calcium carbonate reduces urinary ph and phosphorus concentration, improves bone mineralization and depresses kidney calcium level in cats. J. Nutr. 124(11):2212-2222. <http://dx.doi.org/10.1093/ jn/124.11.2212> <PMid:7965206>
Pastoor F.J.H., Van ‘T Klooster A.T., Mathot J.N.J.J. & Beynen A.C. 1994b. Increasing calcium intakes lower urinary concentration of phosphorus and magnesium in adult ovariectomized cats. J. Nutr. 124(2):299-304. <http://dx.doi.org/10.1093/jn/124.2.299> <PMid:8308580>
Pizzorno J., Frassetto L.A. & Katzinger J. 2010. Diet-induced acidosis: is it real and clinically relevant? Brit. J. Nutr. 103(8):1185-1194. <PMid:20003625> Zentek J. & Schulz A. 2004. Urinary composition of cats is affected by the