Printed version ISSN 0001-3765 / Online version ISSN 1678-2690 http://dx.doi.org/10.1590/0001-3765201820180241
www.scielo.br/aabc | www.fb.com/aabcjournal
Growth and biochemical variables in Amazon catfish (
Pseudoplatystoma
reticulatum
♀ x
Leiarius marmoratus
♂) under different water pH
CARLOS HENRIQUE P.LEMOS, SAMANTHACHUNG, CLÁUDIO V.M.RIBEIRO and CARLOS EDUARDOCOPATTI
Programa de Pós Graduação em Zootecnia, Universidade Federal da Bahia, Escola de Medicina Veterinária e Zootecnia, Avenida Adhemar de Barros, 500, Ondina, 40170-110 Salvador, BA, Brazil
Manuscript received on March 7, 2018; accepted for publication on April 23, 2018
ABSTRACT
Although fish may live in different aquatic environments, variations in the water quality parameters, mainly pH, may have a substantial impact in their development and welfare. The objective of this study was to test the effect of different pH levels on the growth performance and biochemical variables in Amazon catfish juveniles (Pseudoplatystoma reticulatum x Leiarius marmoratus). Fish were subjected to four different
water pH levels (4.56, 6.0, 7.24, and 8.90) for 40 days. The total ammonia and alkalinity were higher and lower, respectively, in the treatments with water pHs 4.56 and 6.00 than at the other water pH levels. The un-ionized ammonia was higher at water pH 8.90 than at the other water pH levels. Amazon catfish exposed to water pH 4.56 presented specific growth rate and weight gain significantly higher than other water pH values. In general, fish under exposure to water pH 8.90 presented lower growth performance than other water pH values. Biochemical changes were recorded at all water pH. In conclusion, water pH 4.56 is recommended for an Amazon catfish production system, since fish presented higher growth and water quality variables were kept within adequate limits for aquaculture.
Correspondence to: Carlos Eduardo Copatti E-mail: [email protected]
INTRODUCTION
Fish inhabit different aquatic environments, and changes in water quality parameters may
compromise their development and welfare. For example, in Amazon basin there are acid or
alkaline water environments and fish can migrate
from one river to another mainly in the flood season (Baldisserotto et al. 2009). These changes
can trigger stress and, consequently, reduce growth
and impair physiological homeostasis (Barcellos
et al. 2011). Water pH is a key parameter for fish production because of its influence on their development and survival. Exposure to extreme acidic or alkaline water pH represents
a great challenge to fish, resulting in imbalance
in osmoregulation, and limitation of growth and survival (Parra and Baldisserotto 2007). Therefore,
maintaining desirable water pH in fish farming is
essential to achieve good productivity rates (Copatti et al. 2005, Copatti and Amaral 2009).
Acidic water can promote ionic imbalance due to high concentrations of H+, which causes
the inhibition of influx of Na+
(Aride et al. 2007). This results in disorders in
blood cells, plasma proteins and the volume of fish fluids, which can trigger death from circulatory insufficiency (Wood 1989). Alkaline water, in turn,
reduces the conversion of un-ionized ammonia (NH3) into ionized ammonia (NH4+), compromising
the excretion of NH3 by fish and increasing its concentration in plasma and tissues (Bolner et al. 2014), resulting in osmoregulatory imbalance and toxicity (Wilkie and Wood 1996), impairing growth and survival. At higher water pH, physiological homeostasis starts to break down in most species, with the principal problem being a build up of toxic ammonia in the body fluids associated with an inhibition of branchial ammonia excretion (Wilkie and Wood 1996).
One of the main problems in intensive
aquaculture systems relates to the maintenance of fish welfare (Teixeira et al. 2017). Under conditions of adverse water pH, fish activate mechanisms to
maintain homeostasis (McEwen and Wingfield 2003). Thus, the evaluation of metabolic variables contributes to a better understanding of fish healthiness. Plasma cortisol, glucose and protein, for example, are biochemical variables commonly
used to assess the metabolic state of fish (Barcellos
et al. 2011, Sena et al. 2016).
Cortisol is the main corticosteroid in fish and increases in plasma in response to a stressor stimulus (Barcellos et al. 2011). Although cortisol is involved in the stress response, growth and reproduction, this remarkably versatile hormone also has a well-established role in the endocrine control of osmoregulation (Mommsen et al. 1999). Cortisol acts stimulating the increase in the functional area of chloride cells (Lin et al. 2015) and decreasing gill permeability by tightening the tight junctions (Kelly and Chasiotis 2011, Chasiotis et al. 2012) to maintain ionic balance. Elevation of plasma cortisol levels may trigger increased plasma glucose levels as a way to compensate an increased tissue energy demand (Costas et al.
2008). Total plasma protein, in turn, is related to protein metabolism and reflects the nutritional
status of fish (Higuchi et al. 2011).
The Amazon catfish (Leiarius marmoratus♂
x Pseudoplatystoma reticulatum♀) is a hybrid developed in the 1990s in Brazil. It has achieved prominence in Brazilian production by possessing characteristics desirable for production, such as rapid growth, resistance to handling and acceptability of vegetable ingredients in the diet (Prieto-Guevara et al. 2015). However, we are not
aware of any study investigating the effects of water
pH on their growth and welfare. Therefore, this study aimed to evaluate growth performance and
biochemical variables of Amazon catfish juveniles subjected to different water pH levels.
MATERIALS AND METHODS
EXPERIMENTAL CONDITIONS
The study was carried out in the Laboratory of fish
nutrition and feeding behavior of the Universidade Federal do Recôncavo da Bahia (UFRB).
Seventy-two Amazon catfish juveniles (96.2 ± 0.96 g; 19.2
± 0.36 cm) were taken from Colpani® fish farm,
Mococa, SP, Brazil. The fish were housed for 15
days in continuously aerated 2000 L tanks in a recirculation system (stocking density 3.0 kg m-3).
Subsequently, the fish were randomly transferred
to 12 continuously aerated 250 L masonry tanks (initial stocking density of 0.40 kg m-3 or 6 fish tank-1), with a semi-static system and biological
filters. The experimental protocol was approved by
the Ethics Committee of the Escola de Medicina Veterinária e Zootencia of the Universidade Federal da Bahia (number 78/2017).
Water pH was maintained by addition of NaOH (5 N) or H2SO4 (5 N). Water pH was monitored
four to five times daily between 7:30 a.m. and 5:30
was centrifuged at −4 °C at 4000 rpm (4 min) to
separate the plasma and the samples were stored
frozen at −20 °C. Prior to blood collection, the
animals underwent a fast for 24 h.
Plasma glucose levels were determined enzymatically by glucose oxidase/glucose peroxidase in a BT 3000 apparatus (500 tests h-1; Wiener Lab, Rosario, Argentina). A cortisol S kit was used for the determination of cortisol in the
plasma aliquots with mini VIDAS® equipment and
the enzyme-linked fluorescent assay technique. The
measured values of cortisol ranged from 2 to 650 ng mL-1. The observed values of total precision,
depending on the serum concentration, ranged
from 7.42% to 12.98% (coefficient of variation)
(Sena et al. 2016).
Determinations of plasmatic total proteins, aspartate aminotransferase (AST), albumin, creatine, urea and uric acid were performed using Labtest Kits in a semi-automatic biochemical analyser (Doles®, model D-250).
STATISTICAL ANALYSIS
The results are expressed as the mean ± S.E.M.
Levene’s test was performed to evaluate the homogeneity of data variances. All parameters studied presented homogenous variances and the data were compared using a one-way ANOVA followed by Tukey’s pair-wise comparisons.
Differences were considered significant at P < 0.05.
RESULTS
WATER QUALITY
The water pH differed significantly between
treatments (8.90 > 7.24 > 6.00 > 4.56) (P < 0.05). Alkalinity was significantly higher at water pH 8.90
than at other water pH values, and at water pH 7.24
than at water pH 4.56 and 6.00 (P < 0.05). Total ammonia was significantly higher at water pH 4.56 and 6.00 than the other treatments (P < 0.05). Un-ionized ammonia was significantly higher at water
and other water physical-chemical variables were monitored twice weekly. Hardness, alkalinity and nitrite were measured with a commercial kit
(kit Alfatecnoquímica, Florianópolis, SC). Total
ammonia was measured by a colorimetric method and read by spectrophotometer (photoLab® S12) and un-ionized ammonia levels were obtained from a conversion table for fresh water.
The statistical design was completely randomized, with four treatments and three replicates, under the following water pH levels
(mean ± standard error of the mean; S.E.M.): 4.56 (± 0.03), 6.00 (± 0.02), 7.24 (± 0.02) and 8.90 (±
0.01). The experiment lasted 40 days. The fish
were fed commercial food (35% crude protein;
3,600 kcal digestible energy, Purina Nutripeixe SI) twice daily (7:30 a.m. and 5:00 p.m.) until apparent satiety. Individuals were fasted for a period of 24 h prior to the experiment. In order to remove excess feces and feed residues, the tanks were siphoned and cleaned. The water lost due to evaporation or cleaning of the tanks was replaced with fresh water under the respective treatment conditions.
GROWTH PERFORMANCE
The following animal performance parameters were analyzed at the end of the experiment: weight gain
(WG) = final body weight – initial body weight; specific growth rate (SGR) = 100 x [ln(final weight) – ln(initial weight)]/days of experiment; condition
factor (CF) = 100 x (final weight/final length3);
final biomass (FB) = final body weight x number of fish and; survival (S) = (final fish number x 100)/ initial fish number).
SAMPLE COLLECTION AND ANALYSIS
After biometry, four fish from each tank (n = 12
pH 8.90 than at other water pH values (P < 0.05). The other water quality variables did not differ significantly between treatments (Table I).
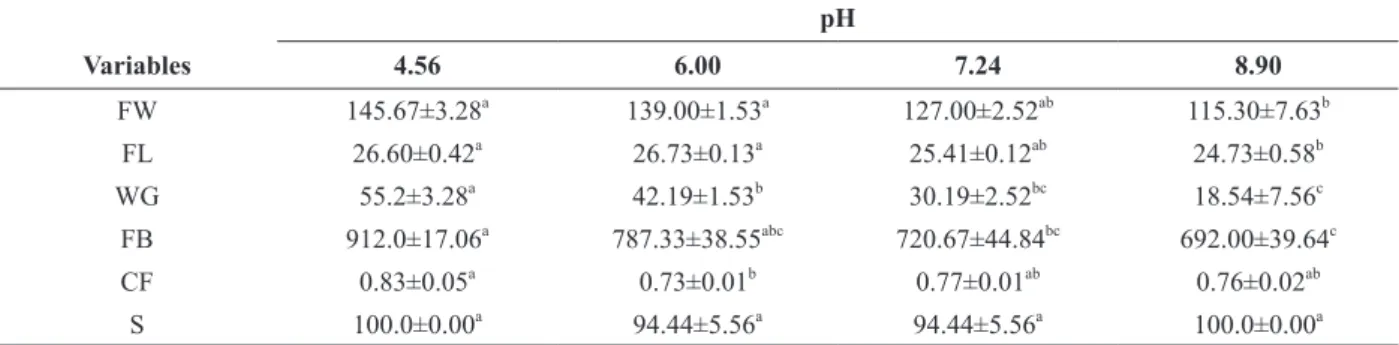
GROWTH PERFORMANCE
The Amazon catfish exposed to water pH 4.56
presented SGR and weight gain significantly higher than other water pH values (P < 0.05). Furthermore,
fish exposed to water pH 6.00 presented SGR and weight gain significantly higher than those
subjected to water pH 8.90 (P < 0.05) (Fig. 1 and Table II). The Amazon catfish exposed to water
pH 8.90 presented final weight and final length
significantly lower than those subjected to water pH levels of 4.56 and 6.00 (P < 0.05). The fish exposed to water pH 4.56 had significantly higher condition
factor than those subjected to water pH 6.00 and
final biomass than those subjected to water pH 7.56 and 8.90 (P < 0.05) (Table II).
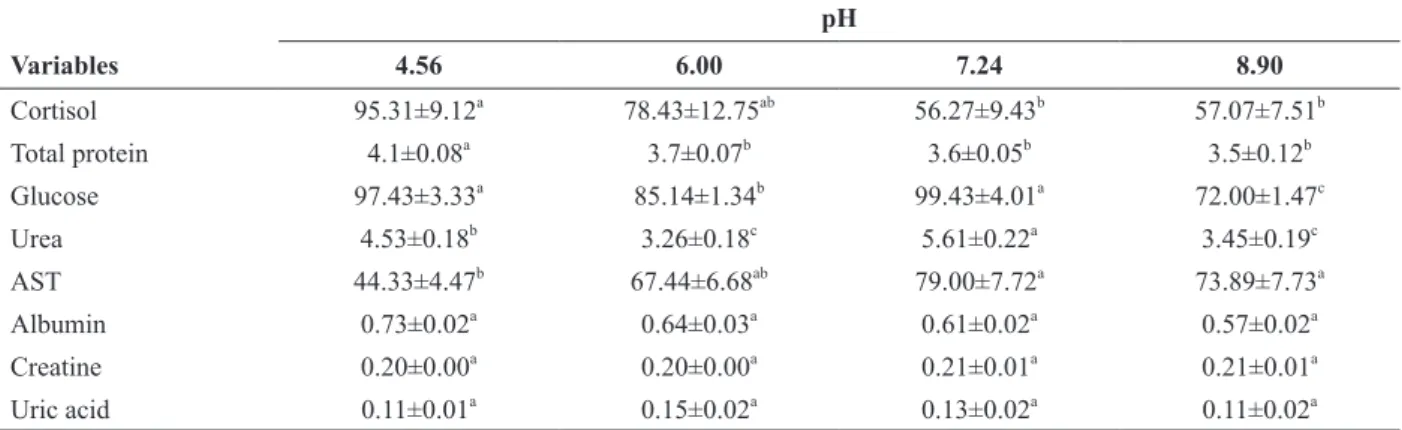
BIOCHEMICAL VARIABLES
Plasma cortisol levels were significantly higher in fish subjected to water pH 4.56 in relation to those subjected to water pH levels of 7.24 and 8.90 (P < 0.05). Plasma total protein levels were significantly higher in Amazon catfish exposed to water pH 4.56
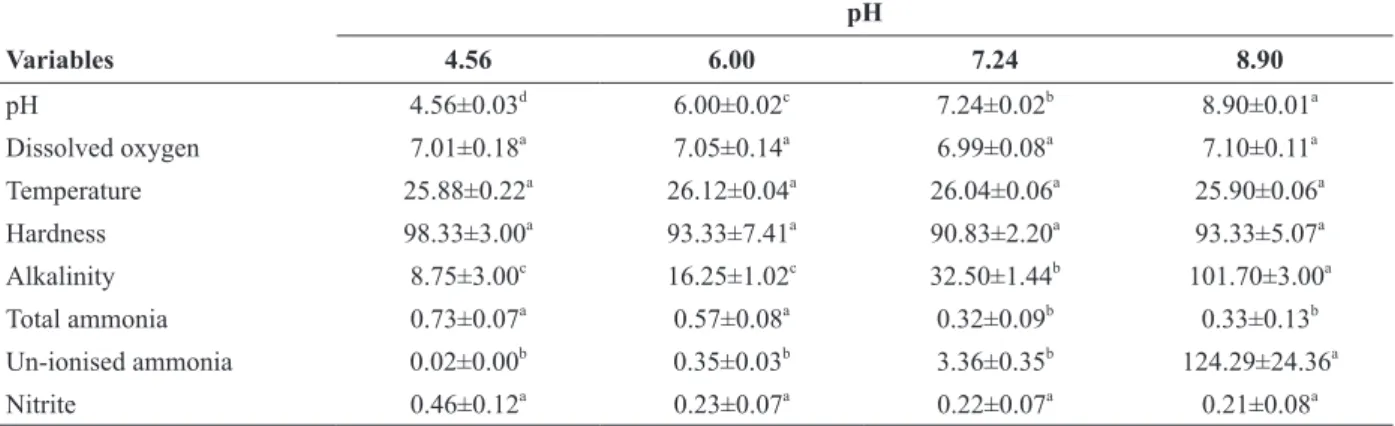
TABLE I
Water quality variables of Amazon catfish (P. reticulatum x L. marmoratus) maintained at different water pH levels.
pH
Variables 4.56 6.00 7.24 8.90
pH 4.56±0.03d 6.00±0.02c 7.24±0.02b 8.90±0.01a
Dissolved oxygen 7.01±0.18a 7.05±0.14a 6.99±0.08a 7.10±0.11a
Temperature 25.88±0.22a 26.12±0.04a 26.04±0.06a 25.90±0.06a
Hardness 98.33±3.00a 93.33±7.41a 90.83±2.20a 93.33±5.07a
Alkalinity 8.75±3.00c 16.25±1.02c 32.50±1.44b 101.70±3.00a
Total ammonia 0.73±0.07a 0.57±0.08a 0.32±0.09b 0.33±0.13b
Un-ionised ammonia 0.02±0.00b 0.35±0.03b 3.36±0.35b 124.29±24.36a
Nitrite 0.46±0.12a 0.23±0.07a 0.22±0.07a 0.21±0.08a
Temperature is expressed as °C, dissolved oxygen is expressed as mg L-1
O2, hardness and alkalinity are expressed as mg L-1 CaCO3, total ammonia is expressed as mg L-1 N-NH3 and un-ionized ammonia is expressed as µg L-1 N-NH3. Data are presented as the means ± SEM (n = 3 tanks per treatment). Different letters indicate statistically significant differences between treatments (P < 0.05).
Figure 1 - Specific growth rate (% day-1) of Amazon catfish (P. reticulatum x L. marmoratus) maintained at different water
pH levels. Data are presented as the means ± SEM (n = 3 tanks per treatment). Different letters indicate statistically significant differences between treatments (P < 0.05).
than to other treatments (P < 0.05). Plasma glucose
levels were significantly higher in juveniles at water pH levels of 4.56 and 7.24 than at other values, and at water pH 6.00 than at water pH 8.90
(P < 0.05). Plasma urea levels were significantly higher in the fish exposed to water pH 7.24 than to
other water pH values, and to water pH 4.56 than to
water pH levels of 6.00 and 8.90 (P < 0.05). Plasma AST levels were significantly higher in juveniles
TABLE II
Growth performance of Amazon catfish (P. reticulatum x L. marmoratus) maintained at different water pH levels.
pH
Variables 4.56 6.00 7.24 8.90
FW 145.67±3.28a 139.00±1.53a 127.00±2.52ab 115.30±7.63b
FL 26.60±0.42a 26.73±0.13a 25.41±0.12ab 24.73±0.58b
WG 55.2±3.28a 42.19±1.53b 30.19±2.52bc 18.54±7.56c
FB 912.0±17.06a 787.33±38.55abc 720.67±44.84bc 692.00±39.64c
CF 0.83±0.05a 0.73±0.01b 0.77±0.01ab 0.76±0.02ab
S 100.0±0.00a 94.44±5.56a 94.44±5.56a 100.0±0.00a
FW (final weight), WG (weight gain) and FB (final biomass) are expressed in g, FL (final length) is expressed in cm, CF (condition factor) is expressed as g cm-3*100 and, survival is expressed as %.Data are presented as the means ± SEM (n = 3 tanks per treatment). Different letters indicate statistically significant differences between treatments (P < 0.05).
comparison those subjected to water pH 4.56 (P
< 0.05). The other biochemical variables did not differ significantly between treatments (Table III).
DISCUSSION
WATER QUALITY
Water quality variables (except alkalinity and
un-ionized ammonia) of the present study were within the limits established for cachara (Pseudoplatystoma reticulatum) (Campos 2010) and silver catfish (Rhamdia quelen) (Baldisserotto 2013), species whose genus is the same as the parental species of
the hybrid Amazon catfish. The results obtained for
dissolved oxygen, total ammonia and temperature were similar to values previously reported with
Amazon catfish juveniles (Fortes‐Silva et al. 2017). In general, response in Amazon catfish at low pH
demonstrates that this species is extremely tolerant to acidic conditions common in Amazonian waters.
Similar observations were observed with tambaqui
(Aride et al. 2007, Wood et al. 2017), another Amazon species.
Alkalinity is one of the main variables of
water quality due to its behavior as buffer, avoiding high fluctuations of water pH levels (Boyd et al.
2016). Alkalinity values below 30 mg L-1 CaCO3
can lead to disturbances in the acid–base balance of fish (Bhatnagar and Devi 2013), which could
compromise their growth and welfare. As expected, in the present study, lower values of water alkalinity were observed in treatments with acidic water pH (Boyd et al. 2016).
The production of nitrogenous residues in fish
arises from the catabolism of amino acids, which are excreted by the gills (Wood 1993). This excretion is made through the Rhesus glycoproteins present in the gills, which are located in the basolateral and apical membranes (Wright and Wood 2012). If water un-ionized ammonia levels are high, its concentration in plasma and fish tissue also increases (Wright et al. 2007). This elevation is potentiated in alkaline water because the ammonia excretion is reduced due to the lower concentration of H+ ions in the water that react with NH3 and convert it into NH4+ (Wright and Wood 2012).
In addition, in the present study, the values of un-ionized ammonia observed at water pH 8.90 were higher than those recommended for
aquaculture (Baldisserotto 2013, Baldisserotto
et al. 2014), which may lead to osmoregulatory alterations, compromising fish physiology and survival (Bolner et al. 2014), as well as decreases in feed intake, metabolism and growth (Foss et al. 2009, Paust et al. 2011). Internal ammonia builds up might be a particular problem for Amazonian
fish because they are generally more sensitive to
perhaps because they evolved in generally acidic waters, where NH3 concentrations would be low (Souza-Bastos et al. 2016). Nevertheless, the values of un-ionized ammonia found in our study remained
below lethal levels (< 500 mg L-1
NH3) described
for silver catfish at water pH 7.57 (Baldisserotto et
al. 2014).
GROWTH PERFORMANCE
Exposure to extreme water pH levels may limit growth performance and, in some cases, cause
mortality in fish (White et al. 2014). However, in our study, no mortality occurred in Amazon catfish
subjected to extreme water pH values (4.56 and 8.90), demonstrating their ability to tolerate acid or alkaline waters.
In addition, it was found that alkaline water decreased growth of juveniles, which may be related to the high values of un-ionized ammonia recorded for this water pH. According to Wood et al. (2017), more ammonia being released by deamination of amino acids associated with oxidation of their carbon skeletons in aerobic metabolism can trigger negative growth because the increased metabolic
cost, as verified in this study. Similar results were
observed in tambaqui (Colossoma macropomum)
and in silver catfish, where the growth performance
was lower in fish subjected to alkaline water (water
pH 8.0) compared to acidic water (water pH 4.0 and 6.0) (Aride et al. 2007, Copatti et al. 2011).
On the other hand, the best growth performance of juveniles in acidic water can be explained by lower levels of un-ionized ammonia (at pH 4.56), or by a better capacity of physiological adjustment (at water pH 6.00), which could support the cultivation of Amazon catfish in regions where water pH is acidic. Our findings are surprising
because they differ from the usual knowledge for the cultivation of teleost fishes. However, similar
results have already been verified in previous
studies with tambaqui (Aride et al. 2007, Wood et
al. 2017), where the absence of increased N-loss (as ammonia) at pH 4.0 may explain why Amazon species can sustain high growth rates under acidic conditions.
BIOCHEMICAL VARIABLES
Alterations of plasma cortisol levels provide fundamental responses on the physiological status of fish (Wendelaar Bonga 1997). The increase of plasma cortisol levels may stimulate hepatic glycogenolysis to provide energy to tissues in stressful situations (Vinodhini and Narayanan 2009). Plasma total protein is related to the TABLE III
Biochemical variables of Amazon catfish (P. reticulatum x L. marmoratus) maintained at different water pH levels.
pH
Variables 4.56 6.00 7.24 8.90
Cortisol 95.31±9.12a 78.43±12.75ab 56.27±9.43b 57.07±7.51b
Total protein 4.1±0.08a 3.7±0.07b 3.6±0.05b 3.5±0.12b
Glucose 97.43±3.33a 85.14±1.34b 99.43±4.01a 72.00±1.47c
Urea 4.53±0.18b 3.26±0.18c 5.61±0.22a 3.45±0.19c
AST 44.33±4.47b 67.44±6.68ab 79.00±7.72a 73.89±7.73a
Albumin 0.73±0.02a 0.64±0.03a 0.61±0.02a 0.57±0.02a
Creatine 0.20±0.00a 0.20±0.00a 0.21±0.01a 0.21±0.01a
Uric acid 0.11±0.01a 0.15±0.02a 0.13±0.02a 0.11±0.02a
Cortisol is expressed as ng mL-1
, total protein and albumin are expressed as g dL-1
, glucose, urea, creatine and uric acid are expressed as mg dL-1
maintenance of osmotic pressure and acid-base balance of fish, and its elevation reflects ionic
disturbances and osmotic changes of plasma fluid
(Milligan and Wood 1982).
The increase of plasma cortisol and total protein
levels in Amazon catfish exposed to water pH 4.56
observed in the present study may be an adaptive
protective mechanism against the evident effects of ionoregulation and acid–base balance disorders
due to the increase in the concentrations of H+ ions
in water (Wood 1989). The chronic activation of the stress system due to high plasma cortisol levels induces a tertiary stress response accompanied by a decreased growth rate (Wendelaar Bonga 1997). However, in this study, no growth reduction was observed in Amazon catfish subjected to water pH 4.56 over 40 days, which may demonstrate their ability to make physiological adjustments to
avoid the effects of tertiary stress. Additionally,
the elevation of plasma cortisol levels of the
fish exposed to water pH 4.56 could explain the
increase of plasma glucose levels at this water pH, which is often a secondary stress response resulting from the elevation of plasma cortisol levels and has the function of providing energy to the tissues (Wiseman et al. 2007).
Nevertheless, the increase of plasma glucose levels is not always related to the increase of plasma cortisol levels (Wendelaar Bonga 1997),
as observed in this study for fish exposed to water
pH 7.24. On the other hand, the increase of plasma glucose levels at water pH 7.24 may be related to the elevation of plasma urea levels, which was also
observed for the fish in water pH 4.56. Increasing
urea synthesis is a strategy to reduce the toxicity of
ammonia in fish (Kajimura et al. 2004). In addition, urea production does not reflect direct oxidative deamination of amino acids and, consequently, does not reflect increased metabolic cost (Wood
1993, Wood et al. 2017).
Finally, the reduction of plasma glucose levels
in Amazon catfish exposed to water pH 8.90 may
be an adaptive energy-saving strategy (Das et al. 2004), in view of the high concentrations of un-ionized ammonia commonly found in alkaline water, which can diffuse easily through the gill epithelium (Wright et al. 2007). In other words, it is an attempt by fish to reduce catabolism
and, consequently, the concentration of nitrogen
compounds, which, in turn, probably compromised the growth performance of Amazon catfish subjected to alkaline water in our study. A similar
result has been observed in silver catfish, where
hepatic, muscular and renal glucose were reduced in fish exposed at alkaline water (pH 10.0) in comparison to acidic water (pH 3.0) (Bolner et al. 2014). So, the lower growth performance in
fish at alkaline water pH could not be attributed
to stress (Wood et al. 2017), since plasma glucose and cortisol levels did not raise (or increase) as demonstrated in this study.
The evaluation of plasma AST has been used to verify fish responses under stress conditions
(Chien et al. 2003), and its elevation may reflect a
metabolic impairment of the liver and/or skeletal muscle (Lemaire et al. 1991). The increase of plasma AST levels in juveniles subjected to pH levels of 7.24 and 8.90 in this study was probably influenced by the higher concentrations of un-ionized ammonia, which could trigger toxicity and impair hepatic functions. Nevertheless, the plasma AST levels found in this study remained within
the baseline described for silver catfish (114 U L-1)
(Borges et al. 2004).
CONCLUSIONS
Exposure to alkaline waters resulted in reduced growth performance and biomass of Amazon
catfish, which was probably influenced by the high
concentrations of un-ionized ammonia at this pH. In contrast, the best growth rate occurred in acidic waters, mainly in water pH 4.56. Furthermore, we
at water pH levels of 4.56 (plasma cortisol, total protein, glucose and urea), 6.00 (plasma cortisol, glucose and AST), 7.24 (plasma glucose, urea and AST) and 8.90 (plasma AST). Therefore, the
production of Amazon catfish at acidic water (pH 4.56) is recommended, since fish presented higher growth and, in general, water quality variables were kept within adequate limits for aquaculture.
ACKNOWLEDGMENTS
The authors thank Dr. Rodrigo Fortes-Silva and
Bahia Pesca for the supply of fish and the facilities to conduct the research. The first author also thanks Fundação de Amparo à Pesquisa do Estado da
Bahia (FAPESB) by the research grant awarded.
REFERENCES
ARIDE PHR, ROUBACH R AND VAL AL. 2007. Tolerance response of tambaqui Colossoma macropomum (Cuvier) to water pH. Aquac Res 38: 588-594.
BALDISSEROTTO B. 2013. Fisiologia de peixes aplicada à piscicultura, 3rd
ed., Santa Maria: UFSM, 350 p.
BALDISSEROTTO B, COPATTI CE, GOMES LC, CHAGAS EC, BRINN RP AND ROUBACH R. 2009. Calcium fluxes in Hoplosternum littorale (tamoatá) exposed to different types of Amazonian waters. Neotrop Ichthyol 7: 465-470. BALDISSEROTTO B, MARTOS-SITCHA JA, MENEZES
CC, TONI C, PRATI RL, GARCIA LO, SALBEGO J, MANCERA JM AND MARTÍNEZ-RODRÍGUEZ G. 2014. The effects of ammonia and water hardness on the hormonal, osmoregulatory and metabolic of the freshwater silver catfish Rhamdia quelen. Aquat Toxicol 152: 341-352.
BARCELLOS LJG, VOLPATO GL, BARRETO RE, COLDEBELLA I AND FERREIRA D. 2011. Chemical communication of handling in fish. Physiol Behav 103: 372-375.
BHATNAGAR A AND DEVI P. 2013. Water quality guidelines for the management of pond fish culture. Int J Environ Sci 3: 1980-1993.
BOLNER KC, COPATTI CE, ROSSO FL, LORO VL AND BALDISSEROTT B. 2014. Water pH and metabolic parameters in silver catfish (Rhamdia quelen). Biochem Syst Ecol 56: 202-208.
BORGES A, SCOTTI LV, SIQUEIRA DR, JURINITZ DF AND WASSERMANN GF. 2004. Hematologic and serum biochemical values for jundiá (Rhamdia quelen). Fish Physiol Biochem 30: 21-25.
BOYD CE, TUCKER CS AND SOMRIDHIVE JB. 2016. Alkalinity and hardness: critical but elusive concepts in aquaculture. J World Aquac Soc 47: 6-41.
CAMPOS JL. 2010. O cultivo do pintado (Pseudoplatystoma corruscans, Spix, Agassiz, 1829), outras espécies do gênero Pseudoplatystoma e seus híbridos. In: Baldisserotto
B and Gomes LC (Eds), Espécies nativas para piscicultura no Brasil, Santa Maria: UFSM, Santa Maria, Brazil, p. 335-361.
CHASIOTIS H, KOLOSOV D, BUI P AND KELLY SP. 2012. Tight junctions, tight junction proteins and paracellular permeability across the gill epithelium of fishes: A review. Respir Physiol Neurobiol 184: 269-281.
CHIEN Y, PAN C AND HUNTER B. 2003. The resistance to physical stresses by Penaeus monodon juveniles fed diets supplemented with astaxanthin. Aquaculture 216: 177-191.
COPATTI CE AND AMARAL R. 2009. Osmoregulation in piava juveniles, Leporinus obtusidens (Characiformes: Anastomidae), during the exchanges from the water’s pH. Biodivers Pampeana 7: 1-6.
COPATTI CE, COLDEBELLA IJ, RADUNZ NETO J, GARCIA LO, DA ROCHA MC AND BALDISSEROTTO B. 2005. Effect of dietary calcium on growth and survival of silver catfish fingerlings, Rhamdia quelen (Heptapteridae), exposed to different water pH. Aquac Nutr 11: 345-350. COPATTI CE, GARCIA LO, KOCHHANN D, DA CUNHA
MA, BECKER AG AND BALDISSEROTTO B. 2011. Low water hardness and pH affect growth and survival of silver catfish juveniles. Cienc rural 41: 1482-1487. COSTAS B, ARAGÃO C, MANCERA JM, DINIS MT AND
CONCEIÇÃO LEC. 2008. High stocking density induces crowding stress and affects amino acid metabolism in Senegalese sole Solea senegalensis (Kaup 1858) juveniles. Aquac Res 39: 1-9.
DAS PC, AYYAPPAN S, JENA JK AND DAS BK. 2004. Acute toxicity of ammonia and its sub‐lethal effects on selected haematological and enzymatic parameters of mrigal, Cirrhinus mrigala (Hamilton). Aquac Res 35:
134-143.
FORTES-SILVA R, COSTA LS, PAULINO RR, RODRIGUES EJ, SANCHEZ-VAZQUEZ FJ AND ROSA PV. 2017. Hybrid fish model (Pseudoplatystoma reticulatum♀× Leiarius marmoratus♂) to study feeding behaviour: protein
source self‐selection and demand-feeding rhythms. Aquac Res 48: 3705-3718.
FOSS A, IMSLAND AK, ROTH B, SCHRAM E AND STEFANSSON SO. 2009. Effects of chronic and periodic exposure to ammonia on growth and blood physiology in juvenile turbot. Aquaculture 296: 45-50.
quelen submitted to diets with different proteic and energetic levels. Ci Anim Bras12: 70-75.
KAJIMURA M, CROKE SJ, GLOVER CN AND WOOD CM. 2004. Dogmas and controversies in the handling of nitrogenous wastes: the effect of feeding and fasting on the excretion of ammonia, urea and other nitrogenous waste products in rainbow trout. J Experim Biol 207: 1993-2002. KELLY SP AND CHASIOTIS H. 2011. Glucocorticoid
and mineralocorticoid receptors regulate paracellular permeability in a primary cultured gill epithelium. J Experim Biol 214: 2308-2318.
LEMAIRE P, DRAI P, MATHIEU A, LEMARIE S, CARRIERE S, GUIDICELLI J AND LAFAURIE M. 1991. Changes with different diets in plasma enzymes (GOT, GPT, LDH, ALP) and plasma lipids (cholesterol, triglycerides) of sea– bass (Dicentrarchus labrax). Aquaculture 93: 63-75.
LIN CH, SHIH TH, LIU ST, HSU HH AND HWANG PP. 2015. Cortisol regulates acid secretion of H+
-ATPase-rich ionocytes in zebrafish (Danio rerio) embryos. Front Physiol 6: 328.
MCEWEN BS AND WINGFIELD JC. 2003. The concept of allostasis in biology and biomedicine. Horm Behav 43: 2-15.
MILLIGAN CL AND WOOD CM. 1982. Disturbances in haematology, fluid volume distribution and circulatory function associated with low environmental pH in the rainbow trout, Salmo gairdneri. J Experim Biol 99: 397-415.
MOMMSEN TP, VIJAYAN MM AND MOON TW. 1999. Cortisol in teleosts: dynamics, mechanisms of action, and metabolic regulation. Rev Fish Biol Fisher 9: 211-268. PARRA JEG AND BALDISSEROTTO B. 2007. Effect
of water pH and hardness on survival and growth of freshwater teleosts. In: Baldisserotto B, Mancera JM and Kapoor BG (Eds), Fish osmoregulation,New Hampshire: Science Publishers, USA, p. 135-150.
PAUST LO, FOSS A AND IMSLAND AK. 2011. Effects of chronic and periodic expo-sure to ammonia on growth food conversion efficiency and blood physiology in juvenile Atlantic halibut (Hippoglossus hippoglossus L.). Aquaculture 315: 400-406.
PRIETO-GUEVARA MJ, SILVA RF, COSTA LS, PEREIRA RT AND ROSA PV. 2015. Effect of fixed feeding time on growth, body composition, and hepatic histology of hybrid catfish (Pseudoplatystoma reticulatum x Leiarius marmoratus) fed with carbohydrates and lipids ratios. Rev Colomb Cienc Pec 28: 83-92.
SENA AC, TEIXEIRA RR, FERREIRA EL, HEINZMANN BM, BALDISSEROTTO B, CARON BO AND COPATTI
CE. 2016. Essential oil from Lippia alba has anaesthetic activity and is effective in reducing handling and transport stress in tambacu (Piaractus mesopotamicus × Colossoma macropomum). Aquaculture 465: 374-379.
SOUZA-BASTOS LR, VAL AL AND WOOD CM. 2016. Are Amazonian fish more sensitive to ammonia? Toxicity of ammonia to eleven native species. Hydrobiol 789: 143-155.
T E I X E I R A R R , D E S O U Z A R C , S E N A A C , BALDISSEROTTO B, HEINZMANN BM, COUTO RD AND COPATTI CE. 2017. Essential oil of Aloysia triphylla in Nile: anaesthesia, stress parameters and sensory evaluation of fillets. Aquac Res 48: 3383-3392. VINODHINI R AND NARAYANAN M. 2009. The Impact
of toxic heavy metals on the hematological parameters in common Carp (Cyprinus carpio L.). Iranian J Environ Health Sci Eng6: 23-28.
WENDELAAR BONGA S. 1997. The stress response in fish. Physiol Rev 77: 591-625.
WHITE RS, MCHUGH PA, GLOVER CN AND MCINTOSH AR. 2014. Multiple environmental stressors increase the realised niche breadth of a forest-dwelling fish. Ecograp 38: 154-162.
WILKIE MP AND WOOD CM. 1996. The adaptations of fish to extremely alkaline environments. Comp Biochem Physiol Part B: Biochem Mol Biol 113: 665-673.
WISEMAN S, OSACHOFF H, BASSETT E, MALHOTRA J, BRUNO J, VAN AG, MOMMSEN TP AND VIJAYAN MM. 2007. Gene expression pattern in the liver during recovery from an acute stressor in rainbow trout. Comp Biochem Physiol Part D Genomics Proteomics 2: 234-244. WOOD CM. 1989. The physiological problems of fish in acid waters. In: Morris R, Brown DJA, Taylor EW and Brown JA (Eds), Acid toxicity and aquatic animals, Cambridge: Cambridge University Press, USA, p. 125-152.
WOOD CM. 1993. Ammonia and urea metabolism and excretion. In: Evans D (Ed), The physiology of fishes, Boca Raton, CRC Press Inc., USA, p. 379-425.
WOOD CM, GONZALEZ RJ, FERREIRA MS, BRAZ-MOTA S AND VAL AL. 2017. The physiology of the Tambaqui (Colossoma macropomum) at pH 8.0. J Comp Physiol B 188: 393-408.
WRIGHT PA, STEELE SL, HUITEMA A AND BERNIER NJ. 2007. Induction of four glutamine synthetase genes in brain of rainbow trout in response to elevated environmental ammonia. J Experim Biol 198: 127-135.