The present study aimed to evaluates polymerization shrinkage (PS) using microcomputed tomography (μCT) and microtensile bond strength (μTBS) in bulk fill composites (BFC) and conventional class I restorations as well as the correlation between these factors. Class I cavities (4 x 5 x 4 mm), factor-C = 4.2, were created in third molars that were free of caries, which were randomly divided in 4 groups (n = 6): XTI (Filtek Supreme XTE: incremental technique); XTB (Filtek Supreme XTE: single fill technique); TBF (Tetric Bulk Fill); and SF (SonicFill). Each tooth was scanned twice in μCT: T0 was after filling the cavity with composite, and T1 was after light curing. The data were analyzed by subtracting the composite volume for each time (T1 - T0). After 1 week, the teeth were sectioned crosswise in the buccolingual and mesiodistal directions to obtain specimens with approximately 1 mm² thickness and fixed in a universal testing machine to perform μTBS. The Kruskal-Wallis and Dunn tests showed a statistically significant difference for shrinkage in µCT among the XTI and XTB and between the SF and XTB. Regarding the μTBS, all the groups differed from XTB. Bulk fill composites type presents a PS similar to that of the conventional nanoparticulate composite inserted using the incremental technique, but the bond strength was higher for the incremental group, which presented a lower number of pre-test failures when compared to BFC. No correlation was observed between the polymerization shrinkage and bond strength in the studied composites.
Po l y m e r i z a t i o n S h r i n k a g e o f
B u l k F i l l C o m p o s i t e s a n d i t s
Correlation with Bond Strength
Lauber Jose dos Santos Almeida Junior1, Estevam Carlos de Oliveira Lula2, Karla Janilee de Souza Penha1, Vinicius Souza Correia1, Fernando Augusto Cintra Magalhães3,4, Darlon Martins Lima1, Leily Macedo Firoozmand1
1Department of Dentistry I, UFMA - Universidade Federal do Maranhão, São Luís, MA, Brasil 2Program in Public Health, UFMA - Universidade Federal do Maranhão, São Luís, MA, Brasil 3Department of Physiology and Pathology, Araraquara Dental School, UNESP - Universidade Estadual Paulista, Araraquara, SP, Brazil 4Department of Pathology, Nursing School, UFMA - Universidade Federal do Maranhão, Imperatriz, MA, Brasil Correspondence: Lauber Jose dos Santos Almeida Junior, Universidade Federal do Maranhão, Centro de Ciências Biológicas e da Saúde, Departamento de Odontologia I. Campus Bacanga, 65085-580, São Luís, MA, Brasil. Tel: +55-98-98804-3207. e-mail: [email protected]
Key Words: polymerization, x-ray microtomography, composite resins, tensile strength
Introduction
Modifications in the organic matrix of composites have allowed for the evolution of new materials known as bulk fill composites (BFCs). These materials have been indicated for use in a single layer in deep cavities (4 to 5 mm) and with a high-factor cavity configuration (Factor-C), simplifying the steps in the clinic (1). Some studies have shown that BFCs have presented adequate marginal adaptation (2), low polymerization shrinkage (1) and satisfactory results in bond strength (3,4).
Even with the development of new polymeric materials, polymerization shrinkage (PS) of composites is an unavoidable phenomenon because it is an inherent property of these materials. There is significant evidence that the stress of PS in the composites can lead to deleterious effects, such as marginal leakage, gap formation, cuspal deflection, tooth cracking, reduced resin-dentin bond strength, and lowered mechanical properties, which cause great concern about the control of these effects and make the phenomenon clinically relevant (5).
The most obvious concern with respect to the PS stresses is the detrimental effect on marginal integrity and sealing of the composite restoration to the tooth (5), which may lead to tooth/composites interface failure, but these failures
can be minimized by performing the incremental insertion technique, with the decrease of the C-factor (4).
It is known that the fill technique and the type of composite can have a great impact on adhesion, particularly in cavities with high C-factor (6). However, the methods used to observe cavity filling and marginal adaptation require the samples to be subjected cuts that generate severe stress, causing changes and the formation of small cracks and creeps (7). In light this, some questions about the fidelity of the observed results, regarding whether these failures occur before or after the PS or if the failures occur during filling of the cavity. Another question is whether the failures, the PS, and inadequate filling could interfere with the bond strength of the restoration. Within this context, recent the microcomputed tomography (μCT) has been presented in the literature (7-9)as a safe and non-destructive method of analyzing a material’s behavior in 3D without deteriorating or destroying the specimens (10).
Almeida-Junior LJS et al/
polymerization shrinkage is associated with the bond strength, therefore, to affirm this correlation without observing images before and after the polymerization raises doubts about the adaptation at the interface of the pulp wall.
Using non-destructive (microcomputed tomography-μCT) and destructible (microtensile bond strength-μTBS) tests, the aim of this in vitro study was to analyze the PS and resin-dentin bond strength of class I restorations with high C-factor, with different bulk fill composites and a conventional composite, to correlate these factors with each other. The null hypotheses tested were that: (I) there is no difference in the volume of polymerization shrinkage of bulk fill and conventional composites; (II) there is no difference in μTBS between bulk fill and conventional composites; and (III) there is no correlation between PS in μCT and μTBS between these composites.
Material and Methods
This study was submitted to the Research Ethics Committee in Brazil and approved under number 1708531.
Sample Preparation
One-way ANOVA was used to determine the sample size, considering 4 groups. From the data obtained by Fronza et al. (12) for inter-group variance (147.2) the intra-group variance (104.8), a sample size of 4 units per group was obtained for an alpha of 5% and power of 80%.
Twenty-four caries-free third molars were cleaned and stored in thymol at 0.5%, followed by prophylaxis and storage in distilled water at 37 ºC ± 1º C for 24 h.
Standard Class I cavities of 4 mm deep (4 x 5 x 4 mm - Fig. 1) and with high C-factor (C = 4.2) were made with diamond tips no. 1090 and 1014 (KG SORENSEN, Cotia, SP, Brazil) at high-rotation refrigeration. The live internal angles were plumped (2) to make the force dissipation and adaptation of the material easier. The prepared teeth were randomly divided in 4 experimental groups (n = 6), according to the composites used for restoration of the
cavities (Table 1): XTI (Filtek Supreme XTE: incremental technique); XTB (Filtek Supreme XTE: bulk fill technique); TBF (Tetric Bulk Fill, insertion according the manufacturer’s instruction); and SF (SonicFill, insertion according the manufacturer’s instructions). The restorative materials and their respective information and filling/insertion techniques are described in Table 1.
Restorative Procedure
After sample preparation, the cavities were conditioned with 37% phosphoric acid (FGM, Joinville, Brazil), then washed with water and the excess was removed with absorbent paper, followed by application of the adhesive system Single Bond 2 (3M, ESPE, St. Paul, MN, USA) according to the manufacturer’s instructions, and polymerized for 10 s. The composite was inserted according to Table 1 for each group, and the condensation was performed with a cosmedent SP2 spatula (Cosmedent, Chicago, IL, USA); after, the composites were light cured for 40 s. During the restorative procedure to avoid any light sources, the samples were immediately protected in dark plastic vials and placed in the apparatus microtomography chamber for a scan and volume quantification before light curing. In the microtomography chamber, there was no light incidence once the operational protocol for μCT Skyscan 1176 (Skyscan, Kontich, Antwerp, Belgium) takes place in a dark environment. All of the polymerization procedures were performed with light cured with a high-power LED light-curing device (Bluephase, Ivoclar Vivadent; Schaan, Liechtenstein) with an output above 1100 mW/cm2 for 40 s (13). The same operator performed all the restorative procedures. Then, the specimens were stored in distilled water at 37 °C ± 1° C for 24 h.
μCT Scanning and Analysis
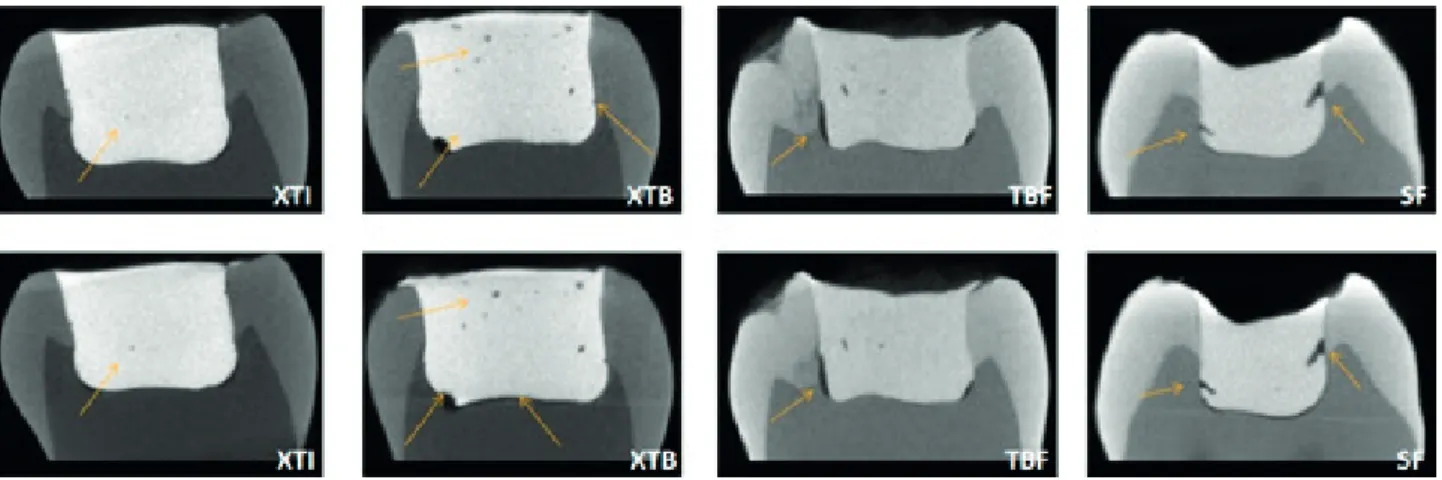
Images were obtained using microtomography SkyScan 1176. A computerized microtomograph was used to analyze the restored cavities. Each tooth was scanned in two times: T0- after the insertion of the resin composite and T1- after
Bulk Fill Composites in μCT/μTBS
the final polymerization (Fig. 2). The microtomograph acted under the operating condition for the power device (90 Kvp, 275 microamperes) with a resolution of 17.48 μm (filter Cu =0.1 mm). The jig that was used was the one of the own machine. The average of the total number of slices was 250, with an average reading time close to 28 minutes. The images were standardized in the DataViewer® software and the analyses were performed in CTAnalyser®. All the calculations were performed on the volume of interest (VOI) obtained from the region of interest (ROI) centered on the delimitations of restorative material. The volumetric analyses aimed to quantify the
resin composite volume at two different moments. The initial reading (T0) was considered “reference,” and the final reading (T1) was considered a “target” in order to align the images geometrically. From these measures, the volume of the polymerization shrinkage was calculated in percentage through analysis of the anatomical structure of the restoration. The final shrinkage volume was measured by the difference between the times and expressed as a percentage.
Microtensile Bond Strength (μTBS)
After 1 week of storage in distilled water at 37
Table 1. Technique and compositions of Materials Investigated
Material
(Group) Manufacturer Composition
Increment size
Insertion technique
Filtek Supreme XTE (XTI)
3M ESPE, St. Paul, MN, USA
Non-agglomerated silica nanoparticles (20nm), non-agglomerated zirconia (4 to 11nm). 78.5 wt% and 63.3 vol%.
Matrix: Bis-GMA UDMA, TEGDMA, PEGDMA and bis-EMA
1.5 mm IT/MI
Filtek Supreme XTE (XTB)
3M ESPE, St. Paul, MN, USA
Non-agglomerated silica nanoparticles (20 nm), non-agglomerated zirconia (4 to 11nm). 78.5 wt% and 63.3 vol%.
Matrix: Bis-GMA UDMA, TEGDMA, PEGDMA and bis-EMA
4 mm BT/MI
Tetric Bulk Fill (TBF)
Ivoclar Vivadent,
Schaan, Liechtenstein,
GE
Barium aluminium silicate glass with two different mean particle sizes, an „Isofiller“, ytterbium fluoride and spherical
mixed oxide, ivocerin initiator, 79-81 wt%, 61 vol% and 17vol% “Isofillers”. Matrix: Bis-GMA, Bis-EMA, UDMA
4 mm BT/MI
SonicFill (SF)
Kerr, Orange, CA, USA
Barium glass, silicon dioxide (5-10%), oxide, chemicals (10-30%), MPS (10-30%), silicon dioxide, EBPDMA (1-5%), bisphenol A bis (2-hydroxy-3-methacryloxypropyl)
ether (1-5%), and TEGDMA (1-5%) (Filler 83.5 wt%)
4 mm BT/SI
Adper Single bond 2 (etch-and-rinse adhesive system)
3M ESPE, St. Paul, MN, USA
Bis-GMA, HEMA, dimethacrylates, photoiniciator, methacrylate functional copolymer of polyacrylic and
polyitaconic acids, 10% by weight of 5 nanometer-diameter spherical silica particles, water, ethanol.
Apply two consecutive coats of adhesive to the tooth surface with
gentle agitation for 15 s; gently air thin; light cure for 10 s
Bis-EMA: Bisphenol-A polyethylene glycol diether dimethacrylate; Bis-GMA: Bisphenol-A diglycidyl ether dimethacrylate; EBPDMA: Ethoxylated Bisphenol-A-dimethacrylate; TEGDMA: Triethylene glycol dimethacrylate; PEGDMA: polyethylene glycol dimethacrylate; UDMA: Urethane dimethacrylate, MPS: 3-(trimethoxysilyl) propyl methacrylate; HEMA: 2-Hydroxyethyl methacrylate. IT: incremental technique; BT: bulk fill technique; MI: manual insertion; SI: sonic insertion.
Almeida-Junior LJS et al/
°C ± 1 °C, the teeth were perpendiculary sectioned in the buccolingual and mesiodistal directions to obtain specimens with approximately 1 mm² thickness in serial cuts. The cross-sectional measurement was performed using a digital caliper (Mitutoyo Co., Tokyo, Japan). The specimens were fixed to a Geraldeli 1-jig at their ends with ethyl cyanoacrylate-based glue (Atascadero, CA, USA) in a microtensile device coupled to a universal testing machine (INSTRON Equipment and Test systems Ltda., São José dos Pinhais, PR, Brazil). A speed of 1 mm/min was employed until the specimens fractured. The bond strength was expressed in megapascals (MPa), calculated by the ratio between the applied force (N) at the moment of fracture and the exposed area (A) (mm²).
The type of failure was observed using a 50x magnification optical microscope (PanTec, Panambra Ind., and Technique AS, São Paulo, Brazil) and classified into 3 types: A (adhesive failure), C (cohesive failure in the composite or dentin), and M (mixed failure).
Statistical Analysis
The Shapiro-Wilk test indicated that the polymerization shrinkage values and bond strength did not show normal distributions. The data were analyzed using a Kruskal-Wallis test followed by a Dunn posthoc test for p < 0.05. The correlation between the bond strength and the volume shrinkage was obtained using Spearman’s rank correlation coefficient (p < 0.05). The statistical software STATA 14 (College Station, TX, USA) was used for the data analysis.
Results
Polymerization Shrinkage Analysis by μCT
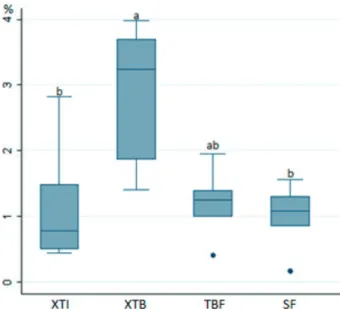
The results for μCT were expressed in percentage volume of polymerization shrinkage (VS). For the volume of polymerization shrinkage, a statistically significant difference was observed between the XTI and XTB groups (p=0.03) and the SF and XTB groups (p=0.012) (Fig. 3).
Resin-Dentin Bond Strength Analysis by Microtensile bond strenght
The microtensile test showed a statistically significant difference in the bond strength of the studied groups (p<0.001). The XTI differed statistically significantly from all of the other groups in bond strength (p<0.001). Also, the SF differed statistically from the XTB (p = 0.049). (Table 2).
Fewer pre-test failures were observed in the XTI group. A predominance of adhesive and mixed failures was observed in all of the evaluated groups (Table 2). The values of μTBS ranged from 0 MPa (pre-test failure - Ptf) to 68.3 MPa. There was a statistically significant difference for the μTBS values when the pre-test failures with zero value (p<0.001) were considered, but this statistical difference was not observed when these specimens were excluded from the analysis (p=0.50).
Correlation Between Shrinkage Volume and Bond Strength
A statistically significant correlation was not observed between bond strength and shrinkage volume (p=0.21), with a weak negative association (r = -0.239) (Fig. 4). Regarding the relationship between the bond strength and the number of specimens, the number of specimens obtained in the samples had a significant association with the bond strength in the group that considered the pre-test failures (p<0.001). Each specimen had an increase of 2.37
Figure 3. Boxplot of the volumetric polymerization shrinkage in μCT. Groups with the same letter are not statistically significantly different (p>0.05). VS: volumetric shrinkage; XTI (Filtek Supreme XTE: incremental technique); XTB (Filtek Supreme XTE: single fill technique); TBF (Tetric Bulk Fill); SF (SonicFill).
Bulk Fill Composites in μCT/μTBS
MPa in bond strength.
Discussion
The appeal of simplifying procedures in clinical practice and the accelerated development of the single insertion of bulk fill composites confront the use of the already established incremental technique in conventional composites. The results of this study verified that the incremental insertion technique (XTI) and the sonic bulk fill technique (SF) presented lower volumes of PS and higher bond strength than the single insertion of conventional composite (XTB), but no correlation was found between these two factors. Thus, hypotheses I and II were rejected because there were significant differences in the polymerization shrinkage and bond strength of the bulk fill and conventional composite types. And the hypothesis III was not rejected because there was any correlation between the volume of PS and bond strength.
The determination of the VS was verified by means of μCT, a method recently shown in the literature as being efficient (10), because it allows for better distribution of the dimension of the spaces along the walls in a 3D visualization. The μCT can be used effectively to characterize the volume of composites before and after the polymerization, thus allowing the determination of the shrinkages (9,14), with the advantage of not destroying or promoting the induction of forces over the test body (10). In addition, the evaluation by μCT can produce quantitative analyses of the PS -compared to the conventional methods, which are qualitative or semi-quantitative (14) -which are fundamental for determining the volume of shrinkage.
The results of this study demonstrate a statistically significant difference for the %VS after the polymerization. The SF group presented lower shrinkage, followed by the (XTI), TBF, and XTB groups (Fig. 3). Conventional nanoparticulate composites, such as the one used in this study, were introduced for their improved mechanical properties and reduced shrinkage, which explains the low
observed shrinkage for the XTI. The highest VS value being found for the XTB is explained by the modification of the recommended technique (1.5 mm). For this material, the manufacturer does not indicate single insertions (4 mm), since insufficient polymerization in deeper portions of the material can compromise its physical properties.
Some factors may have contributed to the studied bulk fill composites presenting a low PS. According to the literature (15), the magnitude of the composite’s shrinkage is controlled by the material’s composition. An increase in the loaded content may, until a certain point, reduce the polymerization shrinkage by decreasing the monomer content in relation to the charge/monomer. Also, the low shrinkage in the TBF group may be due to the changes in the organic matrix. According to the manufacturer, TBF increases the polymerization depth through the insertion of a new initiator (Ivocerin®), which, along with the camphorquinone/amine present in the composites, allow suitable polymerization, even in higher increments (16), still, the presence of prepolymerized particles of TBF can decrease the polymerization shrinkage.
This study’s results verify a statistically significant difference of bulk fill and conventional composites (p<0.001) using μTBS. The evaluation of the restorations in deep cavities and with a high C-factor (C = 4.2) was intended to verify the behavior of these materials after a possible shrinkage stress in the walls of the cavity and its impact on the bond strength. Generally, the bond strength is lower in deep cavity preparations when compared to the insertion of the material on flat surfaces (17).Other studies have shown that bond strength is greatly impacted by the cavity configuration factor (18)and by different types of bulk fill composites (13).
The XTI composite showed higher bond strength values when compared to the XTB and bulk fill composites when considered pre-test failures (p<0.001) (Table 2). Likewise, Colak et al. (19) found higher bond strength in a conventional composite that was incrementally
Table 2. Medians and interquartile ranges of µTBS
Group µTBS -ptf (MPa) median/IQR ptf/n µTBS +ptf (MPa) median/IQR Failure Analysis (%)
XTI 27.7/2.8aA 19/67 20.3/9aB A: 54 M: 30 C: 16
XTB 29.7/27.6aA 64/67 0/0cB A: 33 M: 67
TBF 35.8/7.7aA 56/71 4/7.6bcB A: 26.7 M: 60 C: 13.3
A: 26.7 M: 60 C: 13.3
SF 24.5/13.4aA 52/72 5.4/8.5bB A: 40 M: 40 C: 20
Almeida-Junior LJS et al/
inserted than in bulk fill composites TBF and SF. Still, the bulk fill composites presented higher bond strength than the XTB, corroborating with the literature (6,17). When the incremental and bulk fill techniques were compared, regardless of composites, better results were found for the incremental technique (3).
In the μTBS study, one of the important factors to be evaluated is the number of pre-test failures (20). Not considering pre-test failures values could lead to a more misleading interpretation than when we consider them, for example the XTB group had only 3 specimens for μTBS, however 3 specimens cannot represent a universe of 67. Like this, a value of 0 MPa was assigned for pre-test failures because doing so is a widely accepted method in the literature (11,13,20). This actually penalized the material seriously because there was always a certain bond strength above 0 MPa. However, if the specimens that failed before testing would have been excluded from the μTBS calculation, distinctly a higher data would have been noted, as in the XTB group.
The results of this study showed that there was a statistically significant difference between the groups when the values of the pretested lost specimens were considered to be 0, (Table 2). Likewise, Van Ende et al. (13) observed higher values for the bond strength of the Surefil SDR composite, which did not present pre-test failures among the specimens submitted to microtensile testing in Class I cavities. Differently, other bulk fill and conventional composites showed low bond strength values, because they had more pre-test failures. Different results can be obtained when not considering pre-test failures, such as a study (4) that found greater results for the bond strength of a BFC when compared to conventional composites. The μCT methodology used in this study was fundamental to analyzing, in 3D, that pre-test failures can be associated not only with the cutting technique and specimen preparation but also with bad adaptation of materials during the insertion/condensation of the composites in the cavity before polymerization. This demonstrates the high variability in bond strength results and emphasizes the need for further investigation (13).
According to Table 2, it was observed that the XTB group did not show cohesive failure. It was observed that when the incremental or bulk fill technique was correctly used, some cohesive failures could be find, corroborating the hypothesis that when the techniques are used properly there is a better bonding of the dentin/material. In the microtensile test, due to the small area tested, there is a greater representativeness of adhesive and/or mixed failures (18). Despite proper curing of the composite itself, the oxygen-inhibited layer of the adhesive may not receive sufficient energy to copolymerize adequately with
the overlying composite, creating a fragile zone at the interface, which may explain the occurrence of adhesive failures in cavities (13).
The correlation analysis between the PS in μCT and μTBS in bulk fill composites for posterior class I restorations with a high C-factor was not significant, although there were differences in the isolated PS values and bond strength of the studied composites (Fig. 4). Guo et al. (21)observed that in the composites, the bond strength during the polymerization time follows a similar tendency to stress/ shrinkage tension, with the bond strength decreasing as the composite’s thickness increases due to reduced irradiance at the tooth/composite interface. Importantly, in addition to the PS, the type of adhesive system (6,11) and other factors may influence the bond strength (18).
Areas suggestive of gaps in the dentin wall of the cavity before polymerization (Fig. 2) raises doubts about whether pre-test failures are exclusively caused by polymerization shrinkage. Sagsoz et al. (4) observed satisfactory results of μTBS for bulk fill composites; however, studies that evaluate the bond strength without observing the marginal adaptation before and after polymerization may not be reliable. The preparation of the specimens to evaluate the μTBS, as well as the preparation to observe the tooth/ composite interface in scanning electronic microscopy (7), can generate stresses and cracks in the test body. Differently, the images obtained by μCT can be used to analyze the same sample several times without deteriorating or changing test body’s structure (7).
The weak correlation between the volume of the shrinkage and the bond strength (r = -0.2399) confirms the premise that the composites contract towards the walls that are bonded (22) and not, as believed before that the composites contracted in a direction toward the light (23,24). Thus, the interface may rupture if the shrinkage stress (24), between 13 and 17 MPa, is higher than the bond strength between the composite and the adhesive system, resulting in cracks (24). The obtained results verify that the bond strength, when not considering the pre-test failures, ranged from 24.6 to 34.0 MPa, higher than the values indicated by Davisson et al. (24); that is, the non-polymerization shrinkage was able to interfere with the bond strength.
Bulk Fill Composites in μCT/μTBS
class I restorations with high C-factor when bulk fill and conventional composites were used.
Resumo
O presente estudo teve por objetivo avaliar a contração de polimerização (CP) usando microtomografia computadorizada (µCT) e a resistência de união por microtração (µTBS) em restaurações classe I de compósitos bulk fill (CBF) e convencional, assim como a correlação entre esses fatores. Cavidades classe I (4 x 5 x 4 mm), fator C=4,2, foram feitas em terceiros molares livres de cárie que foram randomizados e divididos em 4 grupos (n = 6): XTI (Filtek Supreme XTE: técnica incremental); XTB (Filtek Supreme XTE: técnica de preenchimento único); TBF (Tetric Bulk Fill); E SF (SonicFill). Cada dente foi escaneado duas vezes em μCT: T0 -após o preenchimento da cavidade com compósito, e T1 - após a cura à luz. Os dados foram analisados subtraindo o volume do compósito para cada tempo (T1 - T0). Após 1 semana, os dentes foram seccionados transversalmente no sentido vestíbulo-palatino e mesio-distal para obter espécimes com aproximadamente 1 mm² de espessura e fixados em uma máquina de ensaio universal para teste de μTBS. Os testes de Kruskal-Wallis e Dunn mostraram diferença estatisticamente significante para a contração em μCT entre XTI e XTB, e entre SF e XTB. Em relação à μTBS, todos os grupos diferiram do XTB. Compósitos do tipo bulk fill apresentam uma CP similar ao compósito convencional nanoparticulado inserido usando a técnica incremental, porém a resistência de união foi maior para o grupo incremental, que apresentou um menor número de falhas pré-teste quando comparado aos CBF. Não foi observada correlação entre a contração de polimerização e a resistência de união nos compósitos estudados.
Acknowledgements
The authors thank FAPEMA (Fundação de Amparo à Pesquisa do Maranhão) for financial support provided for this research (Universal Notice #40/2016, PAEDT Notice #16/2015).
References
1. Sampaio CS, Chiu KJ, Farrokhmanesh E, Janal M, Puppin-Rontani RM, Giannini M, et al.. Microcomputed tomography evaluation of polymerization shrinkage of Class I flowable resin composite restorations. Oper Dent 2017;42:16-23.
2. Campos EA, Ardu S, Lefever D, Jassé FF, Bortolotto T, Krejci I. Marginal adaptation of class II cavities restored with bulk-fill composites. J Dent 2014;42:575-581.
3. Kumagai RY, Zeidan LC, Rodrigues JA, Reis AF, Roulet JF. Bond strength of a flowable bulk-fill resin composite in Class II MOD cavities. J Adhes Dent 2015;17:427-432.
4. Sagsoz O, Ilday NO, Karatas O, Cayabatmaz M, Parlak H, Olmez MH, et al.. The bond strength of highly filled flowable composites placed in two different configuration factors. J Conserv Dent 2016;19:21-25. 5. Ferracane JL, Hilton TJ. Polymerization stress - Is it clinically
meaningful? Dent Mater 2016;32:1-10.
6. Van Ende A, De Munck J, Van Landuyt KL, Poitevin A, Peumans M, Van Meerbeek B. Bulk-filling of high C-factor posterior cavities: effect on adhesion to cavity-bottom dentin. Dent Mater 2013;29:269-277. 7. Meleo D, Manzon L, Pecci R, Zuppante F, Bedini R. A proposal of
microtomography evaluation for restoration interface gaps. Ann Ist Super Sanita 2012;48:83-88.
8. Kim HJ, Park SH. Measurement of the internal adaptation of resin composites using micro-CT and its correlation with polymerization shrinkage. Oper Dent 2014;39:57-70.
9. Sun J, Lin-Gibson S. X-ray microcomputed tomography for measuring polymerization shrinkage of polymeric dental composites. Dent Mater 2008;24:228-234.
10. Carrera CA, Lan C, Escobar-Sanabria D, Li Y, Rudney J, Aparicio C, et al.. The use of micro-CT with image segmentation to quantify leakage in dental restorations. Dent Mater 2015;31:382-390.
11. Mine A, De Munck J, Cardoso MV, Van Landuyt KL, Poitevin A, Kuboki T, et al.. Effect of low-shrinking composite on the bonding effectiveness of two adhesives in occlusal Class-I cavities. Dent Mater J 2012;31:418-426.
12. Fronza BM, Rueggeberg FA, Braga RR, Mogilevych B, Soares LE, Martin AA, et al.. Monomer conversion, microhardness, internal marginal adaptation, and shrinkage stress of bulk-fill resin composites. Dent Mater 2015;31:1542-1551.
13. Van Ende A, De Munck J, Van Landuyt K, Van Meerbeek B. Effect of Bulk-filling on the Bonding Efficacy in Occlusal Class I Cavities. J Adhes Dent 2016;18:119-124.
14. Zeiger DN, Sun J, Schumacher GE, Lin-Gibson S. Evaluation of dental composite shrinkage and leakage in extracted teeth using X-ray microcomputed tomography. Dent Mater 2009;25:1213-1220. 15. Al Sunbul H, Silikas N, Watts DC. Polymerization shrinkage kinetics and
shrinkage-stress in dental resin-composites. Dent Mater 2016;32:998-1006.
16. Ilie N, Bucuta S, Draenert M. Bulk fill resin based composites: an in vitro assessment of their mechanical performance. Oper Dent 2013;38:618 625.
17. Armstrong SR, Keller JC, Boyer DB. The influence of water storage and C-factor on the dentin-resin composite microtensile bond strength and debond pathway utilizing a filled and unfilled adhesive resin. Dent Mater 2001;17:268-276.
18. Van Ende A, De Munck J, Mine A, Lambrechts P, Van Meerbeek B. Does a low-shrinking composite induce less stress at the adhesive interface? Dent Mater 2010;26:215-222.
19. Colak H, Ercan E, Hamidi MM. Shear bond strength of bulk-fill and nano-restorative materials to dentin. Eur J Dent 2016;10:40-45. 20. Armstrong S, Breschi L, Özcan M, Pfefferkorn F, Ferrari M, Van Meerbeek
B. Academy of Dental Materials guidance on in vitro testing of dental composite bonding effectiveness to dentin/enamel using micro-tensile bond strength (μTBS) approach. Dent Mater 2017;33:133-143. 21. Guo J, Holmes B, Yang B, Li Y, Heo YC, Chen J, et al.. Determining the
temporal development of dentin-composite bond strength during curing. Dent Mater 2016;32:1007-1118.
22. Versluis A, Tantbirojn D, Douglas WH. Do dental composites always shrink toward the light? J Dent Res 1998;77:1435-1445.
23. Lutz F, Kejci I, Luescher B, Oldenburg TR. Improved proximal marginal adaptation of class II composite restorations by use of light reflecting wedges. Quintessence Int 1986;17:659-664.
24. Davidson CL, de Gee AJ, Feilzer A. The competition between the composite dentin bond strength and the polymerization contraction stress. J Dent Res 1984;63:1396-1399.