www.ambi-agua.net E-mail: ambi.agua@gmail.com
This is an Open Access article distributed under the terms of the Creative Commons Attribution License, which permits unrestricted use, distribution, and reproduction in any medium, provided the original work is properly cited.
A simplified methodology for the analysis of the establishment of
hydrokinetic parks downstream from hydroelectric plants
ARTICLES doi:10.4136/ambi-agua.2188 Received: 27 Sep. 2017; Accepted: 07 Feb. 2018
Paulo André Vasco Barbosa1; Claudio José Cavalcante Blanco1*;
André Luiz Amarante Mesquita2; Yves Secretan3
1Universidade Federal do Pará (UFPA), Belém, PA, Brasil
Faculdade de Engenharia Sanitária e Ambiental (FAESA/ITEC) E-mail: pav_barbosa@hotmail.com, blanco@ufpa.br
2Universidade Federal do Pará (UFPA), Belém, PA, Brasil
Faculdade de Engenharia Mecânica (FEM/ITEC). E-mail: andream@ufpa.br
3Université du Québec (UQ), Quebec, Canada
Institut National de la Recherche Scientifique - Eau, Terre et Environnement (INRS-ETE) E-mail: yves.Secretan@ete.inrs.ca
*Corresponding author
ABSTRACT
The exploitation of surplus energy through the setup of hydrokinetic parks in reservoirs downstream from hydroelectric plants is on the increase worldwide. Costly measurements in loco are required in order to estimate the amount of energy that may be extracted from a river. However, river modeling provides river velocities and depths whereby the power of hydrokinetic parks may be estimated. Velocities and depths were simulated with a Saint-Venant 2-D model applied to a downstream reservoir of the Tucuruí hydroelectric dam. Velocities were extrapolated in the vertical direction by means of a logarithmic function to determine the vertical velocity profile, which transfers energy to the turbines. The turbine diameters were defined according to the depths of the studied section and information available in the literature. In the analyzed section, 73 turbines with approximately 3 MW may be installed. Power may be greater if other sections are evaluated. However, studies on environmental impacts and production reduction due to decrease of water level downstream the hydroelectric plant should be taken into account prior to the installation of hydrokinetic plants.
Keywords: hydroelectric plants, hydrokinetic turbine, surplus energy.
Metodologia Simplificada para Análise da Instalação de Parque
Hidrocinético a Jusante de Centrais Hidrelétricas
RESUMO
O aproveitamento de energia remanescente, através da implantação de parques hidrocinéticos, em reservatórios de jusante de centrais hidrelétricas vem ganhando destaque no mundo. Para estimar a quantidade de energia que pode ser extraída de um rio, são necessárias medições in loco, gerando custos consideráveis. Entretanto, através de modelagem fluvial
Rev. Ambient. Água vol. 13 n. 3, e2188 - Taubaté 2018
simuladas via modelo de Saint-Venant 2-D aplicado ao reservatório de jusante da hidrelétrica de Tucuruí. As velocidades foram extrapoladas na direção vertical por meio de uma função logarítmica para determinação do perfil vertical de velocidades. Os diâmetros das turbinas foram definidos em função das profundidades do trecho estudado e de informações disponíveis na literatura. Assim, na seção analisada podem ser instaladas 73 turbinas com potência de aproximadamente 3 MW. Essa potência pode ser maior desde que outras seções sejam avaliadas. Todavia, estudos relativos a impactos ambientais e redução da produção da planta principal devido à redução da altura útil de queda devem ser levados em consideração, antes da instalação de parques hidrocinéticos em reservatórios a jusante de hidrelétricas.
Palavras-chave: centrais hidrelétricas, energia remanescente, turbina hidrocinética.
1. INTRODUCTION
Humans have always exploited energy from rivers. Hydroelectric plants are currently the biggest exploiters of this kind of energy on a global scale. Globally, there is a rising demand for renewable and clean energy, and thus new ways to obtain energy have been highlighted. Hydrokinetic energy from rivers is an emergent source of renewable energy. Hydrokinetic turbines are placed directly in the river flow, without any dams, to harness water and create an artificial fall, without changing the river's course (Filizola et al., 2015).
The basin of the Amazon has an area of more than 6 million square kilometers and features an annual discharge of 209.000 m3. s-1, ranked as the largest on the planet (Molinier et al.,
1995). Although the Amazon basin has a large potential for the generation of hydrokinetic energy, currently and in spite of modern technology, it generates small amounts of energy, similar to large hydroelectric power plants (Van Els and Brasil Junior, 2015). No study has been undertaken to quantify the amount of energy that could be potentially generated in Brazil by hydrokinetic turbines.
Lago et al. (2010) and Rourke et al. (2009) studied the field of potential hydrokinetic energy generation to exploit the movements of sea currents and waves. Other researchers focused their studies on the use of hydrokinetic energy in conventional hydroelectric plants (Liu and Packey, 2014). Turbines may be positioned directly downstream from the conventional hydroelectric, where residual energy is still extant. Holanda et al. (2017) employed the Saint-Venant model to simulate velocities and depths in the downstream reservoir of the Tucuruí dam. The authors observed the greatest velocities and depths and ten sites in the main channel of the Tocantins River were pinpointed as potential installation sites for hydrokinetic turbines to exploit surplus energy downstream from the Tucuruí hydroelectric plant.
Rev. Ambient. Água vol. 13 n. 3, e2188 - Taubaté 2018
2. METHODOLOGY
2.1. Study area and data
The Tucuruí hydroelectric power plant uses the Tocantins River to generate energy. The
current study focuses on the dam’s downstream reservoir in its non-navigable stretch. Its discharge and, consequently, its velocities and depths, are controlled by the power plant. Figure 1 shows the stretch under analysis, the velocity iso-surfaces in the middle of the z-axis and the
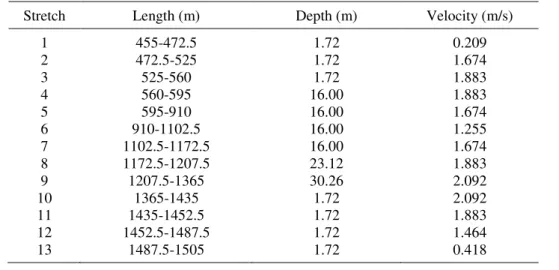
iso-surfaces depths in which the aforementioned velocities were found. This particular stretch was used due to its different depths and the existence of points with maximum velocity. The hydrokinetic generation potential was estimated within a section of approximately 1,995 m, disregarding stretches with null velocity. Thirteen stretches were identified (organized from left to right, in Figure 1). Table 1 shows lengths and velocities in the middle of the water column and its respective depths for the thirteen stretches.
Figure 1. Velocities (a), depths (b) and the transversal section for downstream reservoir of the
Tucuruí River’s hydroelectric power plant, taking into account the highest registered flow of
31,274 m3/s (2007-2014).
Source: Adapted from Holanda et al. 2016.
Table 1. Velocity and depth rates for the stretches under analysis.
Stretch Length (m) Depth (m) Velocity (m/s)
1 455-472.5 1.72 0.209
2 472.5-525 1.72 1.674
3 525-560 1.72 1.883
4 560-595 16.00 1.883
5 595-910 16.00 1.674
6 910-1102.5 16.00 1.255
7 1102.5-1172.5 16.00 1.674 8 1172.5-1207.5 23.12 1.883
9 1207.5-1365 30.26 2.092
10 1365-1435 1.72 2.092
11 1435-1452.5 1.72 1.883
12 1452.5-1487.5 1.72 1.464
Rev. Ambient. Água vol. 13 n. 3, e2188 - Taubaté 2018 2.2. Determination of velocity and depth profiles
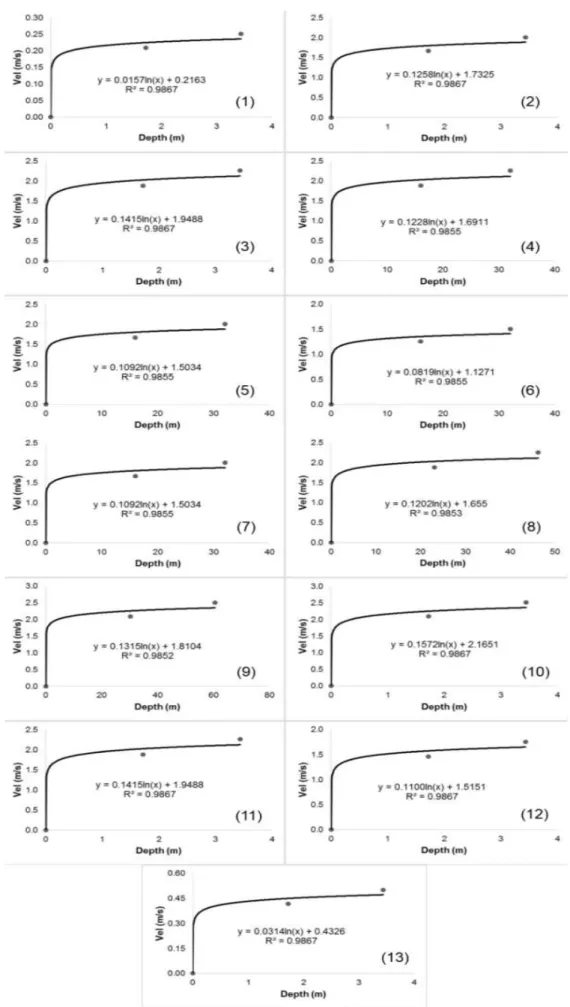
The vertical velocity profiles (Equation 1) are determined by logarithmic distribution (Martin and McCutcheon, 1998).
𝑦 = 𝑎 ln 𝑥 + 𝑏 (1)
where y is the velocity (m/s) and x is the depth (m). Three ordered pairs (x, y) are needed
to generate the curve. The first pair is the velocity at the bottom of the river, which is equal to zero according to the no-slip condition; the depth at the bottom of the river was considered zero. In Figure 1, depth and velocity are the second pair. The third pair is the depth and velocity at the surface of the river. In this case, velocity is defined as 6/5 of the velocity at the middle of the water column (Martin and McCutcheon, 1998); depth is determined through the vertical depth profile. Thus, coefficients a and b may be calculated. Figure 3 demonstrates vertical
velocity profiles for the analyzed section of the river, as a function of depth, following Equation 1.
2.3. Determination of the diameters and the lateral positioning of the turbines
Velocity profile and depths are required to determine the diameters of the turbines to be installed. Rate was obtained by using approximately 50% of the total depth to exploit the greatest velocities in the turbines. The largest diameter in the study was 15 m (Kirinus, 2013). So that interference between the functioning turbines would be avoided, the distance between adjacent turbines was defined as 2.27D (Brasil Junior et al., 2016), where D is the turbine’s
rotor diameter. In the vertical direction a single turbine was installed to avoid environmental impacts due to the blockage of the river flow.
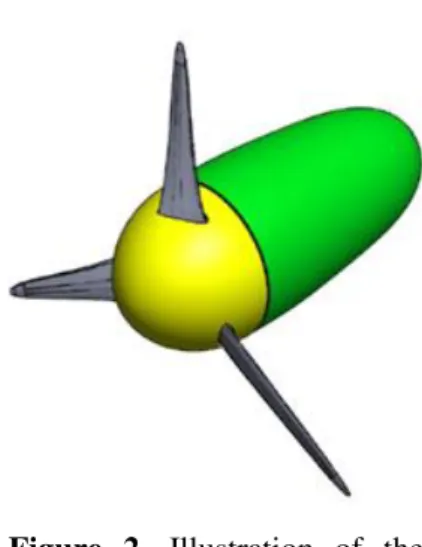
2.4. Proposed turbines
Axial turbines (Figure 2), very similar to wind turbines, were proposed for the hydrokinetic park. They have a more robust structure to withstand the inertia of the water, which has a density 1000 times greater than the density of air. Design velocity and rotor diameter were defined by depths and velocities shown in Table 1. The diameter of the rotor hub and the number of blades also depend on the design of each machine. Profiles used were generally of the NACA type. Costs of implementation and maintenance of the hydrokinetic turbines reached R$ 1.91 per kWh (Brasil Junior et al., 2007), or rather, the equivalent of US$ 0.98 per kWh (Santos and Blanco, 2016).
Rev. Ambient. Água vol. 13 n. 3, e2188 - Taubaté 2018 2.5. Determination of project velocities and power installed
Projected velocity is defined as the mean rate between vertical velocities alongside the turbine. The power is determined by Equation 2.
𝑃𝑜𝑡 = 12𝐶𝑝𝜌𝐴𝑣3 (2)
In which, Pot is the power (W); Cp is the power coefficient; 𝜌 is the water density (kg/m³); A is the area (m²); comprehended by the rotor’s diameter D (m); v is the project velocity (m/s).
Since the machine is free flowing, the maximum percentage the rotor converts from the energy available in the stream is 59.26%, settled by Betz limit (Betz, 1926). Therefore, in Equation 2,
Cp is equal to 0.59, i.e., maximum power coefficient, whilst water density is 1000 kg/m³. Under
operating conditions, Cp varies and is not equal to the Betz limit (Mesquita et al., 2014).
However, the above rate will be taken into account since current analysis deals with potential estimates. In fact, further studies are required to define Cp.
3. RESULTS AND DISCUSSION
3.1. Velocity and depth profiles
The profiles provided by Equation 1 are shown in Figure 3. All logarithmic curves have a correlation coefficient larger than 0.98, ensuring, in a mathematically simple way, a good estimate of the velocities in the vertical direction of the chosen cross section.
Figure 4 shows the distribution of velocities as a function of depths and the length of the studied section, and the positioning of the hydrokinetic turbines, illustrating the cross section of a possible hydrokinetic park. The section comprises rates of maximum velocity and depths, which allow the setup of turbines up to 15 m in diameter. The width of the section is sufficient to comply with the recommendation of 2.27D of lateral distance between the turbines.
3.2. Calculation of the installed power
Table 2 shows depths, project velocities, diameters, number of turbines, and installed power (Equation 2) for the thirteen stretches.
Table 2. Parameters to determine the installed power in each stretch.
Patch Depth (m) Number of turbines D (m) v (m/s) P (kW)
1 3.44 4 2.00 0.24 0.025
2 3.44 13 2.00 1.90 41.30
3 3.44 8 2.00 2.14 36.17
4 32.0 1 15.0 2.00 209.8
5 32.0 6 15.0 1.85 994.1
6 32.0 3 15.0 1.39 209.5
7 32.0 1 15.0 1.85 165.7
8 46.2 2 15.0 2.09 472.5
9 60.5 2 15.0 2.32 646.8
10 3.44 17 2.00 2.37 105.4
11 3.44 4 2.00 2.14 18.09
12 3.44 8 2.00 1.66 16.99
13 3.44 4 2.00 0.50 0.239
Rev. Ambient. Água vol. 13 n. 3, e2188 - Taubaté 2018
Rev. Ambient. Água vol. 13 n. 3, e2188 - Taubaté 2018
Figure 4. Distribution of velocities as a function of depths and length of the studied stretch in the Tocantins River for a hydrokinetic park.
In all, 73 turbines may be installed. The total power in the section is equivalent to approximately 3 MW. A fraction of the Amazon’s population, even those living close to Tucuruí’s hydroelectric plant, uses isolated systems (mostly diesel motors) for the generation
of electric energy (Blanco et al., 2008). Consequently, the above energetic potential may be employed to minimize diesel consumption. Henceforth, the emissions of pollutants linked to the burning of fossil fuels will be reduced. The determined power corresponds to only one section taken into consideration. Since current study has been restricted to the non-navigable stretch of the river downstream from the Tucuruí dam, other sections may be analyzed and the amount of energy will increase. Even if 3 MW is a small amount when compared to the installed capacity of the Tucuruí hydroelectric plant (8,370 MW), the amount may be increased, provided that other sections are analyzed by the methodology under analysis. Nevertheless, 3 MW is a rate close to that provided by other projects worldwide, as may be observed below.
Lalander and Leijon (2009) analyzed velocities and depths of ten sites on the Dalälven River in Sweden, downstream from a hydroelectric plant. Taking into account the highest registered flow of 700 m3/s, the ten sites, each equipped with a hydrokinetic turbine, are capable
of producing the equivalent of 344 kW. Each turbine produces 34.4 kW. In the Tocantins case, on average each turbine produces 41.1 kW, demonstrating the similarity of the potentials found. Ortega-Achury et al. (2010) analyzed the setup project of approximately 200 turbines in the East River, along the east shore of Roosevelt Island and near the United Nations Headquarters (USA) and found that they generated up to 10 MW. In this case, the power generated per turbine is up to 50 kW, which is similar to 51.3 kW for the Rhône River, France, with 39 hydrokinetic turbines and a power of 2 MW (CNR, 2017). These last two specific power rates are higher than those for the Tocantins River, albeit in the same order of magnitude.
4. CONCLUSION
The extrapolation of velocities via logarithmic function was excellent with R2 of the order
Rev. Ambient. Água vol. 13 n. 3, e2188 - Taubaté 2018
However, the turbines need to be designed with greater detail. As previously stated, Cp
should be determined as a function of the variation of velocities and the limits of cavitation. Another issue to be taken into consideration is the cost-benefit ratio analysis of the hydrokinetic park setup, in relation to the energy to be generated, since the setup of hydrokinetic turbines will reduce the available head due to the increase of water level downstream the hydroelectric plant.
Further, the environmental impacts must be taken into account due to the modification of the field of velocity caused by the setup of the turbines. In fact, silting and erosion will occur. Last but not least, the transposition of fish through the turbines must also be evaluated. These issues are outside the scope of current study and will be addressed in future discussions on the theme.
5. ACKNOWLEDGEMENTS
The authors are grateful to the Brazilian Coordination for the Improvement of Higher Education Personnel (CAPES) through the Pró-Amazônia research project. The second author thanks the Brazilian National Council for Scientific and Technological Development (CNPq) for the Productivity Grant in Research process number 304936/2015-4. The third author thanks the Brazilian National Council for Scientific and Technological Development (CNPq) for the Productivity Grant in Research process number 305450/2015-8.
6. REFERENCES
BETZ, A. Windenergie und ihre Ausnutzung durch Windmühlen. Germany: Ökobuch Verlag, 1926.
BLANCO, C. J. C.; SECRETAN, Y.; MESQUITA, A. L. A. Decision support system for micro-hydro power plants in the Amazon region under a sustainable development perspective.
Energy for Sustainable Development, v. 12, n. 3, p. 25–33, 2008. https://doi.org/10.1016/S0973-0826(08)60435-4
BRASIL JUNIOR, A. C. P.; VAN ELS, R.; SALOMON, L. R. B.; OLIVEIRA, T.; RODRIGUES, A. P.; FERREIRA, W. O. Turbina hidrocinética geração 3. In: CITENEL - CONGRESSO DE INOVAÇÃO TECNOLÓGICA EM ENERGIA ELÉTRICA, 4., 2007, Araxá. Anais... Brasília: ANEEL, 2007.
BRASIL JUNIOR, A. C. P.; MENDES, R. C. F.; OLIVEIRA, T. F.; ANDRIAMPARANY, T.; KOUIDRI, M.; MESQUITA, A. L. A. On the hydrodynamics of a row arrangement of hydrokinetic propeller turbines. American Journal of Hydropower, Water and Environmental Systems, v. July, p. 19-24, 2016. http://dx.doi.org/10.14268/ajhwes.2016.00032
COMPAGNIE NATIONALE DU RHÔNE - CNR. Ferme D’Hydroliennes Fluviales De 2
MW Sur Le Rhone: Une Première Mondiale, Retenue Par L’ADEME. 2017. Available
at: https://goo.gl/pTnidH. Access on: 01 May 2017.
Rev. Ambient. Água vol. 13 n. 3, e2188 - Taubaté 2018
HOLANDA, P. da S.; BLANCO, C. J. C.; MESQUITA, A. L. A.; BRASIL JUNIOR, A. C. P.; FIGUEIREDO, N. De F.; MACEDO, E. N. et al. Assessment of hydrokinetic energy resources downstream of hydropower plants. Renewable Energy, n. 101, p. 1203-1214, 2017. https://doi.org/10.1016/j.renene.2016.10.011
KIRINUS, E. de P. Avaliação do potencial passível de conversão em energia elétrica das correntes na plataforma continental sul brasileira. 2013. 205 f. Master's Dissertation (Computational Modelling) - Instituto de Matemática, Estatística e Física, Universidade Federal do Rio Grande do Sul, 2013.
LALANDER, E.; LEIJON, M. Numerical modelling of a river site for in-stream energy converters. In: EUROPEAN WAVE AND TIDAL ENERGY CONFERENCE, 8., 2009, Uppsala, Sweden. Proceedings… [S.l.]: EWTEC Committee, 2009.
LAGO, L. I.; PONTA, F. L.; CHEN, L. Advances and trends in hydrokinetic turbine systems.
Energy for Sustainable Development, v. 14, p 287-296, 2010. https://doi.org/10.1016/j.esd.2010.09.004
LIU, Y.; PACKEY, D. J. Combined-cycle hydropower systems – The potential of applying hydrokinetic turbines in the tailwaters of existing conventional hydropower stations.
Renewable Energy, v. 66, p. 228-231, 2014. https://doi.org/10.1016/j.renene.2013.12.007
MARTIN, L.; MCCUTCHEON, S. C. Hydrodynamics and Transport for Water Quality Modelling. Boca Raton: CRC Press, 1998.
MESQUITA, A. L. A.; MESQUITA, A. L. A.; PALHETA, A. C.; VAZ, J. R. P.; MORAIS, M. V. G.; GONÇALVES, C. A methodology for the transient behaviour of horizontal axis hydrokinetic turbines. Energy Conversion Management, v. 87, p. 1261 – 1268, 2014. https://doi.org/10.1016/j.enconman.2014.06.018
MOLINIER, M.; GUYOT, J. L.; OLIVEIRA de E.; GUIMARÃES, V. Les régimes
hydrologiques de l’Amazone et de ses affluents. In: CHEVALLIER, P.; POUYAUD, B.
(Ed.). L’hydrologie tropicale: géoscience et outil pour le developpement. Wallingford: IAHS, 1995. p. 209-222.
ORTEGA-ACHURY, S. L.; MCANALLY, W. H.; DAVIS, T. E.; MARTIN, J. L.
Hydrokinetic Power Review. Mississippi: Bagley College of Engineering, 2010. ROURKE, F. O.; BOYLE, F.; REYNOLDS, A. Marine current energy devices: Current status
and possible future applications in Ireland. Renewable and Sustainable Energy Reviews, v.14, p. 1026-1036, 2009. https://doi.org/10.1016/j.rser.2009.11.012
SANTOS, V. S.; BLANCO, C. J. C. Estimativa de crédito de carbono para projetos de geração de energia com fontes renováveis na ilha de Marimarituba, Santarém-PA. Revista de Estudos Ambientais, v. 18, n. 1, p. 17-29, 2016. http://dx.doi.org/10.7867/1983-1501.2016v18n1p17-29