ABSTRACT: The aim of the current study is to estimate the correlation coefficients and the consequence of genotypic correlations on direct and indirect effects through path analysis between agronomic traits of maize hybrids used for silage production. Eight (8) topcross hybrids and seven (7) checks were analyzed in completely randomized blocks, with six replications, in two environments: Campos do Goytacazes and Itaocara counties – Rio de Janeiro State, in the crop year 2015/2016. The following agronomic traits were assessed: plant height, first ear height, culm diameter, number of ears, ear yield with straw at silage maturity, ear yield without straw at silage maturity, grain yield at silage maturity, grains ratio in the fresh matter and fresh matter yield.
PLANT BREEDING -
Article
Correlations between agronomic traits and path
analysis for silage production in maize hybrids
Jocarla Ambrosim Crevelari1*, Nayara Norrene Lacerda Durães1, Laila Cecília Ramos Bendia2,Julio Cesar Fiorio Vettorazzi1, Geovana Cremonini Entringer1, José Arantes Ferreira Júnior1,
Messias Gonzaga Pereira1
1.Universidade Estadual do Norte Fluminense Darcy Ribeiro - Melhoramento Genético Vegetal - Campos dos Goytacazes (RJ), Brazil.
2.Universidade Estadual do Norte Fluminense Darcy Ribeiro - Ciência Animal - Campos dos Goytacazes (RJ), Brazil.
*Corresponding author: [email protected]
Received: Dec. 12, 2016 – Accepted: Jun. 27, 2017
The highest correlation estimates were found between the variables ear yield without straw and grain yield, and between ear yield with straw and ear yield without straw, with magnitudes 0.95 and 0.92, respectively. The coefficient of determination was high, which indicates that the assessed components explain most of the existing variation in fresh matter yield. According to the path analysis, the trait showing the strongest direct effect on fresh matter yield was the ear yield with straw at silage maturity, in association with the high correlation (r = 0.91), which showed the possibility of achieving significant gains through indirect selection.
INTRODUCTION
The existing relations between traits are assessed through phenotypic, genotypic and environmental correlations. The phenotypic correlation has genetic and environmental causes, whereas the genetic correlations present association of inheritable nature, thus they can be used to guide breeding programs. Accordingly, it is worth distinguishing and quantifying the degree of genetic and environmental association between traits in genetic studies (Cruz et al. 2004; Marchezan et al. 2005).
Although the correlation coefficients are used to quantify the magnitude and direction of factors influencing the determination of complex traits, they do not allow making cause/effect conclusions and inferring the type of association ruling the pair of traits Y/X (Coimbra et al. 2005). Such
studies, per se, do not allow inferring the direct and indirect
influences determining a main trait, such as yield. Therefore, studies concerning consequences of the correlation coefficient are conducted through path analysis.
The path analysis allows clearly interpreting the direct influence of a variable over another, and the interference of other variables on this association. Hence, it is possible knowing in details the influence of traits involved in a previously set diagram, as well as justifying the existence of positive and negative correlations, of high and low magnitude, between the studied traits (Santos et al. 2014).
Wright (1921) has developed the path analysis method to reduce issues related with correlation coefficient interpretation. Such method consists on the quantification of the direct and indirect effects of explanatory variables on a basic variable (Cruz et al. 2004).
The path analysis has been used in different cultures of economic importance such as cotton (Hoogerheide et al. 2007), wheat (Vieira et al. 2007), beans (Cabral et al. 2011), sugarcane (Espósito et al. 2012), elephant grass (Menezes et al. 2014) and canola (Coimbra et al. 2005), sweet corn (Entringer et al. 2014), corn (Toebe and Cargnelutti Filho 2013) and popcorn maize (Cabral et al. 2016).
The fresh matter yield is a complex trait, which results from the association between many traits. The awareness of this association’s degree, which is acquired through correlation studies, makes it possible identifying traits able to be used as yield indirect selection criteria. However, detailed studies involving path analysis become necessary, because the direct interpretation of the correlation magnitudes between yield
may result in mistakes in the strategic selection, since the high correlation between two variables may be the outcome from other variables effects over these two variables.
The aim of the present study is to estimate the correlation coefficients and the consequences of genotypic correlations on the direct and indirect effects through the application of path analysis to the agronomical traits of hybrid maize used for silage production.
MATERIALS AND METHODS
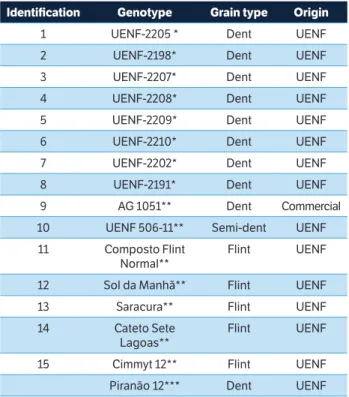
The herein used genotypes were gathered in the corn collection of Norte Fluminense Darcy Ribeiro State University. Eight (8) genotypes were selected to find the topcross hybrids, all of the heterotic group DENT. Each genotype was crossed with a tester – Piranão 12, which is a broad-based tester, also belonging to the heterotic group DENT – in order to generate heterotic group DENT topcross hybrids (Table 1).
Identification Genotype Grain type Origin
1 UENF-2205 * Dent UENF
2 UENF-2198* Dent UENF
3 UENF-2207* Dent UENF
4 UENF-2208* Dent UENF
5 UENF-2209* Dent UENF
6 UENF-2210* Dent UENF
7 UENF-2202* Dent UENF
8 UENF-2191* Dent UENF
9 AG 1051** Dent Commercial
10 UENF 506-11** Semi-dent UENF
11 Composto Flint
Normal**
Flint UENF
12 Sol da Manhã** Flint UENF
13 Saracura** Flint UENF
14 Cateto Sete
Lagoas**
Flint UENF
15 Cimmyt 12** Flint UENF
Piranão 12*** Dent UENF
Table 1. Description of the 8 topcross hybrids, 7 controls and of the tester used in the experiments concerning grain type and origin. Campos dos Goytacazes and Itaocara, RJ, in the crop year 2015/2016.
*Topcross hybrids; ** Controls; *** Tester.
de Janeiro State (Fluminense Northern Region) and at the Experimental Station in Barra do Pomba Island, Itaocara County – Rio de Janeiro State (Fluminense Northern Region) in the crop year 2015/2016. These counties are located at
21°24’48” South, 41°44’48” West, 14m altitude, with mean
rainfall 108.6 mm and mean temperature 27.27 °C; and
at 21°40’09” South, 42°04’34” West, 60m altitude, with
mean rainfall 183.25 mm and mean temperature 25.32 °C, respectively (INMET 2017).
The experimental design followed completely randomized blocks, with six replications, each replication with 15 treatments, 8 topcross hybrids and 7 checks (Table 1). The experimental unit comprised 8.0 m rows, located 1.0m from each other, and 0.2 m between plants, which has resulted in 40 plant stands per plot. Three seeds were sown in each hole. The thinning was performed 21 days after plant emergence and one plant was left in each pit.
The controls belonging to the heterotic group Flint were used to investigate agronomic performance, nutritional value and ruminal degradability of the grains harvested at silage maturity, since studies have shown that the grain type (Flint or Dent) plays an important role in silage quality. The inclusion of pretense checks to the Flint heterotic group will be better appreciated in future studies when the bromatological variables will be included.
Topcross hybrids were obtained in isolated site at the Experimental Station of Ilha Barra do Pomba in Itaocara – RJ, located in the northwest region of Rio de Janeiro State. Each genotype was grown in 10.0 m rows, spaced 1.0 m from each other, with five seeds per meter, totaling 50 plants per row, 0.20 m apart from each other.
According to the soil analysis, the starter fertilizer
consisted on applying 400 kg.ha–1 of the N P K 8-28-16.
Subsequently, two topdressings were performed: one, in the
vegetative stage (V7), using 300 kg.ha–1 of the N P K 20-00-20;
and another in the vegetative stage in between (V7 and
V10), using 200 kg.ha–1 of urea. Cultivation was conducted
according to the recommendations to the culture (Fancelli and Dourado Neto 2000).
The detasseling of females was carried out before ears released the style-stigma during the flowering period, in order to avoid undesired crosses. Thus, the style-stigma received only the tester’s pollen. Harvest was carried out 120 days after sowing.
The following agronomical traits were assessed: plant height (PH); soil level measurements (in meters) up to the
insertion node of the plant tassel; the mean insertion height of the first ear (TH); soil level measurements (in meters) up to the basis of the upper ear on the culm; mean culm diameter (CD), which is measured in the first internode above the plant’s culm (in millimeters); total number of harvested ears (NT); ear yield with straw at silage maturity (TPS) (in
kg.ha–1); ear yield without straw at silage maturity (TPWS)
(in kg.ha-1); grain yield at silage maturity (GY) (in kg.ha–1);
grain yield in fresh matter (GFM) (in %); and fresh matter
yield (FMY) (in kg.ha–1).
The PH, TH and CD were randomly taken in six plants, in the reproductive stage (R4). The NT was found by counting the total number of ears harvested in the plot. The TPS and the TPWS were obtained by weighing the ears with and without straw at silage maturity. The GY was measured through the weighing of grains threshed at silage maturity, and the GFM was found trough the ratio between GY and FMY. The FMY was obtained by weighing the plants (leaves + stem + cob + ear straw + grain) from each plot, at harvest. The NT, TPS, TPWS, GY, GFM and FMY features were measured in the reproductive stage (R4), in 20 plants, in each plot (totaling 4.0 m in each row of the plot). The plants were cut 20 cm from the ground at harvest, when the grains were at dough stage (3/4 of the milk line).
An individual analysis of variance was initially performed in each environment to test the homogeneity of the mean squared error by applying the Hartley’s test. To test data’s normality, the Shapiro-Wilk test was used. The joint analysis of variance was performed after confirmed homogeneity and normality.
The analysis of variance was conducted considering the following statistical model:
Yijk = μ + Gi + B/Ajk + Aj + GAij + eijk
where Yijk is the observation in the k
th block, which is assessed
in the ith genotype and in the jth environment; µ is the general
constant of the assay; Gi is the random effect of the genotype
i, B/Ajk is the effect of block K on environment j; Aj is the
fixed effect of the environment j; GAij is the interaction effect
between genotype i and environment j; and eijk is the random
error associated with the observation .
and the other agronomical traits were considered to be the explanatory variables.
One of the problems in some data analyses is the multicollinearity between the studied traits. When the variables are correlated to each other, it is said that there is inter-relation or multicollinearity between them. Problems caused by multicollinearity do not simply result from multicollinearity itself, but rather from its degree of magnitude (Cruz et al. 2004).
The multicollinearity diagnosis was set based on the condition number (CN), which consists of the ratio between the highest and the lowest eigenvalue of the correlation matrix (Montgomery and Peck 1981). In practical ways, when the number of conditions is lower than 100, there is weak multicollinearity; when it is between 100 and 1000, the multicollineariarity is from moderate to strong; and, finally, when it is higher than 1000, the multicollinearity is severe (Montgomery and Peck 1981). When the multicollinearity degree is considered weak, there is no serious issue to be analyzed (Cruz et al. 2004).
The genotypic correlation matrix between traits was tested through the number of conditions proposed by Montgomery and Peck (1981) in order to assure the reliability of path analysis outcomes concerning multicollinearity. The correlation matrix showed severe multicollinearity (CN = 3135.09) when all variables were taken into account. Carvalho and Cruz (1996) methodology was applied to mediate multicollinearity. This methodology consists of applying a constant k to the
diagonal matrix X’X of the OLS estimator. The applied K value 5.2568 made the herein presented outcomes reliable. Thus, all variables were used in the path analysis. Statistical analyses were conducted in the Genes software (Cruz 2013).
RESULTS AND DISCUSSION
Significant effects (p < 0.01) were observed in all studied features, and it has indicated genetic variability between genotypes. The effects of the genotype vs. environment interaction were significant in GFM and FMY, only. The significant interaction highlights that the response from the genotypes was not coincident in different environments (Table 2).
The assessed hybrids general mean has shown satisfactory outcomes, i.e., it has shown high yield potential in the Northern and Northwestern region of Rio de Janeiro State (Table 2). It is possible inferring that the experimental precision lies within normality and presents variation coefficient from 5.12%, in PH, to 26.64%, in GY, according to the Scapim
et al.(1995) classification (Table 2). The high valuecoefficient
of experimental variation found in GY and in GFM has evidenced the complex nature of this trait, which, besides being ruled by many genes, is strongly influenced by the environment.
It was observed that the heritability based on the mean has ranged from 86.26% (CD) to 98.39% (TH). Therefore, it
Mean squares
GL PH TH CD NT TPS TPWS GY GFM FMY
Block/
Environment 10 0.127 0.032 15.794 44.232 12704427.18 5124740.55 6174884.58 49.417 218208646.97 Genotype 14 0.872** 0.534** 28.096** 227.160** 58630438.74** 41075268.75** 45741692.89** 253.888** 694328908.77**
Environment 1 1.210ns 0.500ns 0.103ns 849.338ns 520829190.13** 75886288.2ns 32281711.02ns 27.323ns 1717854693.88ns
G x L 14 0.018ns 0.010ns 5.057ns 29.731ns 6361321.04ns 3220131.2ns 4602091.02ns 43.031* 57082567.51*
Error 140 0.014 0.008 3.859 18.786 3795018.77 2145899.27 2757549.21 19.601 25944711.63
GA 2.31 1.53 22.70 28.66 11,439 7,709 6,232 16.96 37,034
AC 2.10 1.42 21.77 27.46 10,163 6,774 5,219 16,13 31,804
CVe (%) 5.12 5.84 8.65 15.12 17.02 19.00 26.64 26.10 13.75
h2 98.33 98.39 86.26 91.72 93.52 94.77 93.97 92.27 96.26
r
ˆgg 0.99 0.99 0.92 0.95 0.96 0.97 0.96 0.96 0.98
.
PH: Plant Height (m); TH: Ear Height (m); CD: Culm Diameter (mm); NT: Total number of Ears; TPS: Ear yield with straw at silage maturity (kg.ha–1); TPWS: Ear yield without straw at silage maturity (kg.ha–1); GY: Grain Yield at silage maturity (kg.ha–1); GFM: Grain yield in Fresh Mass (%) and FMY: Fresh Mass yield (kg.ha-1); ns: Not significant by the F test; **: Significant (p < 0.01) by the F test; *: Significant (p < 0.05) by the F test; GA: General Average; AC: Average Checks; CVe: Coefficient of experimental variation; h2: Mean heritability of the genotypes; r ˆgg: Accuracy; G: Genotype; L: Environment.
is possible predicting the possibility of success by selecting the breeding program according to the heritability estimate. The genetic parameter accuracy at genotype selection is useful to simultaneously identify environmental and genetic variations in the 0% to 100% scale. Values above 70% are desirable in genotype assessment experiments (Ramalho et al. 2012). All values in the present study were above 0.92, which indicates the possibility of success at genotype selections.
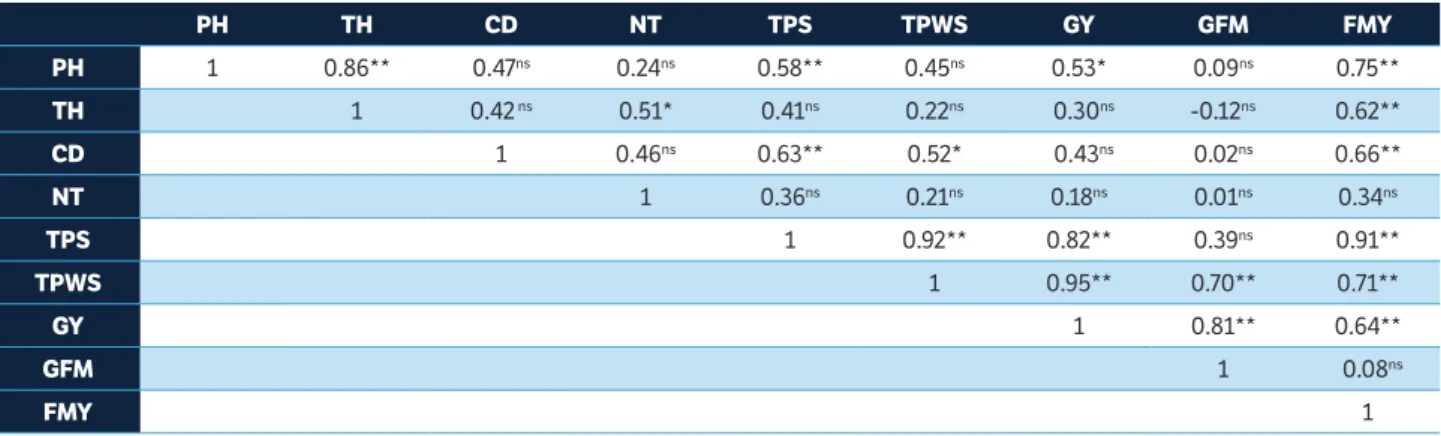
The genotypic correlation estimates applied to the nine agronomical traits are shown in Table 3. The highest positive and significant genotypic correlation estimates were set to the combinations between variables PH and TH (0.86), TPS and TPWS (0.92), TPWS and GY (0.95), and between TPS and FMY (0.91) (Table 3).
The aforementioned estimates show association of heritable nature between traits, so they can be used in the indirect selection of breeding programs. According to Oliveira et al. (2010), the significant correlations are an indication of important traits indirect selection using easy-to-measure agronomical traits.
The fresh matter yield has shown positive significant correlations with six of the eight explanatory variables herein observed with correlation estimates PH (0.75), TH (0.62), CD (0.66), TPS (0.91), TPWS (0.71) and GY (0.64). Yet, it is possible inferring that the explanatory variables have positive correlation to each other, and it shows the complex relation between traits influencing the FMY. These results show the possibility of indirectly selecting the plants presenting the highest PH, TH, CD, TPS, TPWS and GY when one searches for a higher FMY.
Mendes et al. (2008) assessed maize hybrids for silage production and found correlation coefficients (r = 0.63) between plant height and fresh matter production. Paziani et al. (2009) found positive correlation (r = 0.25) between plant height and fresh mass production. Santos et al. (2002) have found positive correlation between plant height (0.50) and grain yield, as well as between ear insertion height (0.51) and grain yield in maize hybrids. These correlations were corroborated in the present study.
It is essential knowing the correlations between traits competing for higher grain yield and fresh matter yield in plant breeding programs, since this knowledge helps selecting favorable hybrids and gives direction to the selection methodology. According to Gomes et al. (2004), studying the relations between different plant traits allows directing the selection by favoring the most correlated productivity and quality traits.
Therefore, when no specific information about maize hybrids is available for silage production, the most regionally adapted hybrids may be used for fresh matter yield. In addition, the grain yield at silage maturity, the ear yield with and without straw at silage maturity and the plant height should be taken into consideration due to the high correlation found between these traits and fresh matter yield.
There was also high correlation between PH and TH, with estimate (r = 0.86). The positive correlation between PH and TH is usual when the structural proportionality of the plant is associated. Other authors have already corroborated these findings using common maize in their research (Magalhães and Durães 2002; Souza et al. 2008).
PH TH CD NT TPS TPWS GY GFM FMY
PH 1 0.86** 0.47ns 0.24ns 0.58** 0.45ns 0.53* 0.09ns 0.75**
TH 1 0.42 ns 0.51* 0.41ns 0.22ns 0.30ns -0.12ns 0.62**
CD 1 0.46ns 0.63** 0.52* 0.43ns 0.02ns 0.66**
NT 1 0.36ns 0.21ns 0.18ns 0.01ns 0.34ns
TPS 1 0.92** 0.82** 0.39ns 0.91**
TPWS 1 0.95** 0.70** 0.71**
GY 1 0.81** 0.64**
GFM 1 0.08ns
FMY 1
Table 3. Estimates of the coefficients of genotypic correlations between eight traits of corn hybrids for silage production. Campos dos Goytacazes and Itaocara, RJ, in the crop year 2015/2016.
.
According to Almeida Filho et al. (1999) and Flaresso et al. (2000), it is worth taking the ear fraction participation into consideration, since it positively correlates with grain yield and allows measuring silage quality. However, the ear rate in the fresh matter should not be seen as the only trait in the maize hybrids selection for silage production purposes, because both the fiber quality and the plant height affect fresh matter yield and silage quality. The selection of maize hybrids for silage may become hard due to the complexity between traits contributing to FMY. Accordingly, the need of developing correlations through direct and indirect effects becomes evident at the time to assess the degree of importance of each explanatory variable in relation to the main variable.
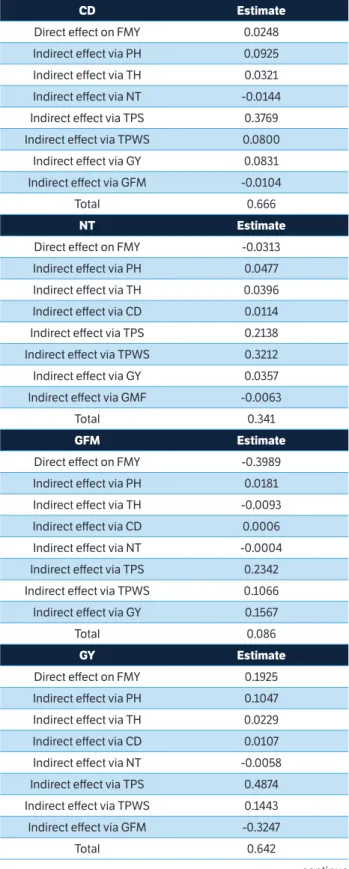
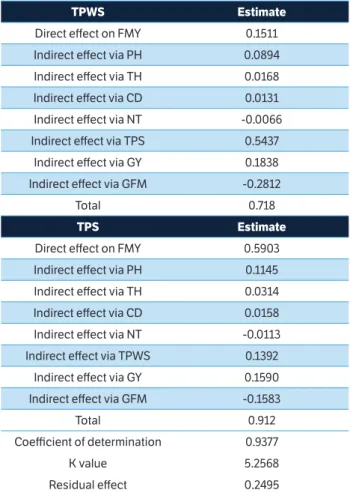
The results of the FMY path analysis according to the explanatory variables PH, TH, CD, NT, TPS, TPWS, GY and GFM are shown in Table 4. The model’s coefficient
of determination in the path analysis (R2) has presented
magnitude 0.9377, and it has indicated that the 93.77% variation in the dependent variable FMY in the model has been explained through the independent variables.
It is extremely important identifying the traits of stronger direct effect on the favorable direction of the selection among
PH Estimate
Direct effect on FMY 0.1952
Indirect effect via TH 0.0662
Indirect effect via CD 0.0117
Indirect effect via NT -0.0076
Indirect effect via TPS 0.3464
Indirect effect via TPWS 0.0692
Indirect effect via GY 0.1032
Indirect effect via GFM -0.0371
Total 0.757
TH Estimate
Direct effect on FMY 0.0762
Indirect effect via PH 0.1696
Indirect effect via CD 0.0104
Indirect effect via NT -0.0162
Indirect effect via TPS 0.2436
Indirect effect via TPWS 0.0334
Indirect effect via GY 0.0579
Indirect effect via GFM 0.0488
Total 0.628
Table 4. Consequences of the genotypic correlations on direct and indirect effect components involving the main dependent variable fresh matter yield and eight agronomic characteristics in maize hybrids for silage. Campos dos Goytacazes and Itaocara counties, RJ, in the crop year 2015/2016.
Table 4. Continuation...
....continue ....continue
CD Estimate
Direct effect on FMY 0.0248
Indirect effect via PH 0.0925
Indirect effect via TH 0.0321
Indirect effect via NT -0.0144
Indirect effect via TPS 0.3769
Indirect effect via TPWS 0.0800
Indirect effect via GY 0.0831
Indirect effect via GFM -0.0104
Total 0.666
NT Estimate
Direct effect on FMY -0.0313
Indirect effect via PH 0.0477
Indirect effect via TH 0.0396
Indirect effect via CD 0.0114
Indirect effect via TPS 0.2138
Indirect effect via TPWS 0.3212
Indirect effect via GY 0.0357
Indirect effect via GMF -0.0063
Total 0.341
GFM Estimate
Direct effect on FMY -0.3989
Indirect effect via PH 0.0181
Indirect effect via TH -0.0093
Indirect effect via CD 0.0006
Indirect effect via NT -0.0004
Indirect effect via TPS 0.2342
Indirect effect via TPWS 0.1066
Indirect effect via GY 0.1567
Total 0.086
GY Estimate
Direct effect on FMY 0.1925
Indirect effect via PH 0.1047
Indirect effect via TH 0.0229
Indirect effect via CD 0.0107
Indirect effect via NT -0.0058
Indirect effect via TPS 0.4874
Indirect effect via TPWS 0.1443
Indirect effect via GFM -0.3247
Table 4. Continuation...
TPWS Estimate
Direct effect on FMY 0.1511
Indirect effect via PH 0.0894
Indirect effect via TH 0.0168
Indirect effect via CD 0.0131
Indirect effect via NT -0.0066
Indirect effect via TPS 0.5437
Indirect effect via GY 0.1838
Indirect effect via GFM -0.2812
Total 0.718
TPS Estimate
Direct effect on FMY 0.5903
Indirect effect via PH 0.1145
Indirect effect via TH 0.0314
Indirect effect via CD 0.0158
Indirect effect via NT -0.0113
Indirect effect via TPWS 0.1392
Indirect effect via GY 0.1590
Indirect effect via GFM -0.1583
Total 0.912
Coefficient of determination 0.9377
K value 5.2568
Residual effect 0.2495
.
PH: Plant Height (m); TH: Ear height (m); CD: Culm Diameter (mm); NT: Total number of ears; TPS: Ear yield with straw at silage maturity (kg.ha–1); TPWS: Ear yield without straw at silage maturity (kg.ha–1); GY: Grain Yield at silage maturity (kg.ha–1); FMY: Fresh Mass Yield (kg.ha–1); and GFM: Grain yield in Fresh Mass (%).
variations in the trait of interest. Accordingly, the concentration of efforts to select this variable may not result in satisfactory gains in the main variable. The described situation is seen in the relation between FMY and PH, FMY and TH, FMY and CD, and FMY and TPWS, FMY and GY, wherein the correlation is high: 0.75, 0.62, 0.66, 0.71 and 0.64, respectively; but the direct effect of PH, TH, CD, TPWS, GY on FMY does not overcome the magnitude of the residual effect (Table 4). The PH variable has shown ease of measurement and indirect effect on FMY via TH; hence, it may be included among the variables presenting significant direct effect on FMY, although its magnitude was lower than that found in TPS and its direct effect had magnitude lower than that of the residual effect (Table 4).
The intensified selection stress over any of these variables may not promote satisfactory genetic gains in fresh matter productivity. According to Cruz et al. (2004), the traits presenting high favorable correlation, but low direct effect, show that the best strategy must be the simultaneous selection of traits by emphasizing the traits whose indirect effects are significant. In this case, the selection based on the FMY, alone, will not be able to promote satisfactory gains in the other traits. Thus, it motivates the adoption of simultaneous selection based on traits that present considerable effects on the indirect selection. The total correlations between traits such as plant height, ear height, culm diameter, ear yield with straw at silage maturity, ear yield without straw at silage maturity, grain yield at silage maturity were all above 0.62, except for the number of ears and for the grain yield in fresh matter, which have presented 0.34 and 0.08 correlation, respectively. According to Cruz et al. (2012), low correlation coefficients do not imply in lack of relation between two variables, but in the absence of linear relation between these variables.
Although the variables NT and GFM have shown positive correlation with FMY, they were not statistically significant (Table 3) and the direct effects were negative: –0.0313 and –0.3989, respectively (Table 4). It means that the indirect effects caused this correlation, as well as that the TPS trait presented the greatest contribution through indirect ways. Thus, as the association between traits was low, it is likely that the simultaneous selection would not lead to successful genetic gains. It is seen that the intensified selection stress over NT and GFM will not promote satisfactory genetic gains in FMY. In this case, indirect and significant causal traits must be simultaneously considered in the selection process, as suggested by Cruz and Regazzi (1997).
those of high correlation with the basic variable for breeding purposes, so that the response correlated through indirect selection is effective (Cruz et al. 2004).
Table 4 shows that the TPS variable had direct effect through the same sign of correlations, as well as that its magnitude was high, since it exceeded the residual effect estimate at magnitude 0.5903.
Traits presenting high favorable correlation with the basic variable, but with direct effect on the unfavorable direction, show lack of cause and effect, i.e., the auxiliary trait is not the main determinant of changes in the basic variable, because there are other traits able to promote stronger impact when it comes to selection (Cruz et al. 2004).
Balbinot et al. (2005) concluded, through path analysis, that the most important component in the prediction of yield in open pollinated varieties was the number of grains per row. Lopes et al. (2007) evaluated the cause and effect relationships in corn cobs related to the types of hybrids and found that the selection of cobs with larger weight of 100 grains and larger number of grains has direct effect on the increase of the grain weight by cob for single and triple hybrid. Saidaiah et al. (2008) path analysis revealed that 100 seed weight exerted maximum positive direct effect followed by plant height and number of leaves above cob on grain yield.
Pavan et al. (2011) path coefficient analysis revealed that plant height, number of kernels rows/cob, number of kernels/row, 100 grain weight, grain yield per plant and fodder yield have highest direct effect on grain yield. Bello et al. (2010) path analysis revealed that ear weight and
number of grains ear-1 had the highest direct effect on grain
yield, while number of grains ear-1 had the highest moderate
indirect negative effects on grain yield. Days to flowering,
plant and ear height, number of grains ear-1 and ear weight
could be the important selection criteria in improving open pollinated maize varieties and hybrids for high grain yield. The lack of information on the association between agronomic traits and the unfolding of the direct and indirect effects between these traits has made it difficult to choose the hybrids of maize for silage production. Therefore, the agronomic traits and the study of the associations between the traits are of fundamental importance for the selection of genotypes for silage production.
The heritability eigenvalues estimated for TPS (93.52%) have enabled the use of simpler selection strategies, besides they are an indication of high genetic gains in the selection (Borém and Miranda 2005).
According to Cruz et al. (2004), the use of the selection is directly proportional to the heritability increase. Therefore, the higher the inheritability estimate, the higher the probability of performing an effective selection.
The fresh matter yield came up as a complex trait influenced by many interrelated traits, and the path analysis was an important statistics applied to identify the traits of great effect.
The present study was an attempt to provide a better understanding to breeders about the agronomical traits that directly or indirectly influence fresh matter yield and to suggest different choices of traits to be selected, in order to maximize the genetic gains through selection.
CONCLUSION
The plant height, ear height, culm diameter, ear yield with straw at silage maturity, ear yield without straw at silage maturity, and grain yield at silage maturity traits have shown agronomic relevance to silage production and quality, since these traits are strongly associated with fresh matter yield.
The coefficient of determination was high in the path analysis, and it has indicated that other assessed traits explain most of the variations in fresh matter yield.
The ear yield with straw at silage maturity was highly correlated with and showed the strongest direct effect on fresh matter yield, fact that turns it into an indirect selection option.
ACKNOWLEDGMENTS
We are grateful to UENF, for granting the scholarships, and to FAPERJ, for the financial support to the implementation of field experiments.
ORCID IDS
J.A. Crevelari
https://orcid.org/0000-0001-9466-2803
N.N.L. Durães
https://orcid.org/0000-0003-3112-4543
L.C.R. Bendia
https://orcid.org/0000-0003-2455-4895
J.C.F. Vettorazzi
https://orcid.org/0000-0002-3887-7735
G.C. Entringer
https://orcid.org/0000-0002-3061-1668
J.A. Ferreira Junior
https://orcid.org/0000-0002-9178-3930
M.G. Pereira
Almeida Filho, S. L., Fonseca, D. M., Garcia, R., Obeid, A. J. and
Oliveira, J. S. (1999). Características agronômicas de cultivares de
milho (Zea mays L.) e qualidade dos componentes da silagem.
Revista Brasileira de Zootecnia, 28, 7-13. http://dx.doi.org/10.1590/ S1516-35981999000100002.
Balbinot Junior, A., Backes, R., Alves, A., Ogliari, J. and Fonseca,
J. (2005). Contribuição de componentes de rendimento na
produtividade de grãos em variedades de polinização aberta de
milho. Revista Brasileira Agrociência, 11, 161-166. http://dx.doi. org/10.18539/CAST.V11I2.1184.
Bello, O. B., Abdulmaliq, S. Y., Afolabi, M. S. and Ige, S. A. (2010).
Correlation and path coefficient analysis of yield and agronomic
characters among open pollinated maize varieties and their F1
hybrids in a diallel cross. African Journal of Biotechnology, 9,
2633-2639.
Borém, A. and Miranda, G. V. (2005). Melhoramento de plantas.
Viçosa: Editora da UFV.
Cabral, P. D. S., Soares, T. C. B., Lima, A. B. P., Soares, Y. J. B. and
Silva, J. A. (2011). Análise de trilha do rendimento de grãos de
feijoeiro (Phaseolus vulgaris L.) e seus componentes. Revista
Ciência Agronômica, 42, 132-138. http://dx.doi.org/10.1590/ S1806-66902011000100017.
Cabral, P. D. S., Amaral Júnior, A. T., Freitas, I. L. J., Ribeiro, R. M.
and Silva, T. R C. (2016). Relação causa e efeito de caracteres
quantitativos sobre a capacidade de expansão do grão em
milho-pipoca. Revista Ciência Agronômica, 47, 108-117. http://dx.doi. org/10.5935/1806-6690.20160013.
Carvalho, S. P. and Cruz, C. D. (1996). Diagnosis of multicollinearity:
assessment of the condition of correlation matrices used in genetic
studies. Brazilian Journal of Genetics, 19, 479-484.
Coimbra, J. L. M., Benin, G., Vieira, E. A., Oliveira, A. C. Carvalho, F.
I. F., Guindolin, A. F. and Soares, A. P. (2005). Consequências da
multicolinearidade sobre a análise de trilha em canola. Ciência Rural,
35, 347-352. http://dx.doi.org/10.1590/S0103-84782005000200015.
Cruz, C. D. and Regazzi, A. J. (1997). Modelos biométricos aplicados
ao melhoramento genético. Viçosa: Editora da UFV.
Cruz, C. D., Regazzi, A. J. and Carneiro, P. C. S. (2004). Modelos
biométricos aplicados ao melhoramento genético. Viçosa: Editora
da UFV.
Cruz, C. D., Regazzi, A. J. and Carneiro, P. C. S. (2012). Modelos
biométricos aplicados ao melhoramento genético. Viçosa: Editora
da UFV.
Cruz, C. D. (2013). GENES - a software package for analysis in
experimental statistics and quantitative genetics. Acta Scientiarum,
35, 271-276. http://dx.doi.org/10.4025/actasciagron.v35i3.21251.
Entringer, G. C., Santos, P. H. A. D., Vettorazzi, J. C. F., Cunha, K. S. and
Pereira, M. G. (2014). Correlação e análise de trilha para componentes
de produção de milho superdoce. Revista Ceres, Viçosa, 61,
356-361. http://dx.doi.org/10.1590/S0034-737X2014000300009.
Espósito, D. P., Peternelli, L. A., Paula, T. O. M. and Barbosa, M. H. P.
(2012). Análise de trilha usando valores fenotípicos e genotípicos
para componentes do rendimento na seleção de famílias de
cana-de-açúcar. Ciência Rural, 42, 38-44. http://dx.doi.org/10.1590/ S0103-84782011005000152.
Fancelli, A. L. and Dourado Neto, D. (2000). Produção de milho.
Guaíba: Agropecuária.
Flaresso, J. A., Gross, C. D. and Almeida, E. D. (2000). Cultivares
de milho (Zea maysL.) e Sorgo (Sorghum bicolor (L.) Moench.)
para ensilagem no alto Vale do Itajaí, Santa Catarina. Revista
Brasileira de Zootecnia, 29, 1608-1615. http://dx.doi.org/10.1590/ S1516-35982000000600003.
Gomes, M. de. S., Pinho, R. G. V., Ramalho, M. A. P., Ferreira, D. V.
and Brito, A. H. de. (2004). Variabilidade genética em linhagens
de milho nas características relacionadas com a produtividade
de silagem. Pesquisa Agropecuária Brasileira, 39, 879-885. http:// dx.doi.org/10.1590/S0100-204X2004000900007.
Hoogerheide, E. S. S., Vencovsky, R., Farias, F. J. C., Freire, E. C. and
Arantes, E. M. (2007). Correlações e análise de trilha de caracteres
tecnológicos e a produtividade de fibra de algodão. Pesquisa
Agropecuária Brasileira, 42, 1401-1405. http://dx.doi.org/10.1590/ S0100-204X2007001000005.
Instituto Nacional de Meteorologia - INMET (2017). Available at:
http://www.inmet.gov.br/projetos/rede/pesquisa/instrucao.html.
Accessed on March 20, 2017.
Lopes, S. J., Lúcio, A. D. C., Storck, L., Damo, H. P., Brum, B. and
Santos, V. J. (2007). Relações de causa e efeito em espigas de
milho relacionadas aos tipos de híbridos. Ciência Rural, 37,
1536-1542. http://dx.doi.org/10.1590/S0103-84782007000600005.
Magalhães, P. C. and Durães, F. O. M. (2002). Cultivo do milho,
germinação e emergência. Sete Lagoas-MG: Ministério da
Agricultura, pecuária e abastecimento. (Technical release 39).
Marchezan, E., Martin, T. N., Santos, F. M. and Camargo, E. R.
(2005). Análise de coeficiente de trilha para os componentes de
produção em arroz. Ciência Rural, 35, 1027-1033. http://dx.doi. org/10.1590/S0103-84782005000500007.
Mendes, M. C., Pinho, R. G. V., Perreira, M. N., Faria Filho, E. M.
and Souza Filho, A. X. (2008). Avaliação de híbridos de milho
obtidos do cruzamento entre linhagens com diferentes níveis de
degradabilidade da matéria seca. Bragantia, 67, 285-297. http:// dx.doi.org/10.1590/S0006-87052008000200004.
Menezes, B. R. S., Daher, R. F., Gravina, G. A. Amaral Júnior, A. T.
Oliveira, A. V., Schneider, L. S. A. and Silva, V. B. (2014). Correlações
e análise de trilha em capim-elefante para fins energéticos. Revista
Brasileira de Ciências Agrárias, 9, 465-470. http://dx.doi.org/ 10.5039/agraria.v9i3a3877.
Montgomery, D. C. and Peck, E. A. (1981). Introduction to linear
regression analysis. New York: John Wiley.
Oliveira, E. J. Lima, D. S. Lucena, R. S., Motta, T. B. N, and Dantas,
J. L. L. (2010). Correlações genéticas e análise de trilha para
número de frutos comerciais por planta em mamoeiro. Pesquisa
Agropecuária Brasileira, 45, 855-862. http://dx.doi.org/10.1590/ S0100-204X2010000800011.
Pavan, R., Lohithaswa, H. C., Wali, M. C., Gangashetty, P. and
Shekara, B. G. (2011). Correlation and path coefficient analysis of
grain yield and yield contributing traits in single cross hybrids of
maize (Zea mays L.). Electronic Journal of Plant Breeding, 2, 253-257.
Paziani, S. F., Duarte, A. P., Nussio, L. G., Gallo, P. B., Bittar, C. M. M.,
Zopollatto, M. and Reco, P. C. (2009). Características agronômicas
e bromatológicas de híbridos de milho para produção de silagem.
Revista Brasileira de Zootecnia, 38, 411-417. http://dx.doi.org/10.1590/ S1516-35982009000300002.
Ramalho, M. A. P., Ferreira, D. F. and Oliveira, A. C. D. (2012).
Experimentação em Genética e Melhoramento de Plantas. Lavras:
Editora da UFLA.
Saidaiah, P., Satyanarayana, E. and kumar, S. S. (2008). Association
and path coefficient analysis in maize (Zea mays L.). Agricultural
Science Digest, 28, 79-83.
Santos, A., Ceccon, G., Davide, L. M. C., Correa, A. M. and Alves,
V. B. (2014). Correlations and path analysis of yield components
in cowpea. Crop Breeding and Applied Biotechnology, 14, 82-87.
http://dx.doi.org/10.1590/1984-70332014v14n2a15.
Santos, P. G., Juliatti, F. C., Buiatti, A. L. and Hamawaki, O. T. (2002).
Avaliação do desempenho agronômico de híbridos de milho em
Uberlândia, MG. Pesquisa Agropecuária Brasileira, 37, 597-602.
http://dx.doi.org/10.1590/S0100-204X2002000500004.
Scapim, C. A., Carvalho, C. G. P. and Cruz, C. D. (1995). Uma proposta
de classificação dos coeficientes de variação para a cultura do
milho. Pesquisa Agropecuária Brasileira, 30, 683-686.
Souza, A. R. R., Miranda, G. V., Pereira, M. G. and Ferreira, P. L.
(2008). Correlação de caracteres de uma população crioula de milho
para sistema tradicional de cultivo. Revista Caatinga, 21, 183-190.
Toebe, M. and Cargnelutti Filho, A. (2013). Não normalidade
multivariada e multicolinearidade na análise de trilha em milho.
Pesquisa Agropecuária Brasileira, 48, 466-477. http://dx.doi. org/10.1590/S0100-204X2013000500002.
Vieira, E. A., Carvalho, F. I. F. Oliveira, A. C. Martins, L. F., Benin,
G., Silva, J. A. G. da Coimbra, J., Martins, A. F., Carvalho, M. F.
and Ribeiro, G. (2007). Análise de trilha entre os componentes
primários e secundários do rendimento de grãos em trigo. Revista
Brasileira Agrociência, 13, 169 -174. http://dx.doi.org/10.18539/ CAST.V13I2.1357.
Wright, S. (1921). Correlation and causation. Journal of Agricultural