APLICABILITY OF PHENOTYPIC AND CANONIC
CORRELATIONS AND PATH COEFFICIENTS IN THE
SELECTION OF OAT GENOTYPES
Claudir Lorencetti1; Fernando Irajá Félix de Carvalho2*; Antônio Costa de Oliveira2; Igor Pirez Valério3; Irineu Hartwig3; Giovani Benin3; Douglas André Mallmann Schmidt3
1
DIMON do Brasil Tabacos Ltda, Depto. de Pesquisa e Melhoramento de Plantas. C.P. 96880-000 - Vera Cruz, RS - Brasil.
2
UFPel/FAEM - Depto. de Fitotecnia, C.P. 354 - 96010-900 - Pelotas, RS - Brasil. 3
UFPel/FAEM - Programa de Pós-Graduação em Agronomia/Fitomelhoramento. *
Corresponding author <carvalho@ufpel.tche.br>
ABSTRACT: Indirect selection through traits of higher heritability and of case measurements can result in larger genetic progress compared to using direct selection. This work was performed with the following objectives: (1) to estimative the phenotypic correlations between individual plant grain yield and agronomic traits of importance in the selection of white oat (Avena sativa L.) genotypes; (2) to identify traits that have the higher direct and indirect effects on grain yield; (3) to determine the intensity of association between primary and secondary components of grain yield; and, (4) to evaluate the consistency of these estimates using five oat genotypes crossed in a diallel format. The number of panicles per plant (NPP) showed to be the trait highest correlated with individual plant grain yield (GY) both through single correlations and through direct effects on grain yields. For weight of a thousand grains (WTG) × GY, in most crosses there was no detected association, leading to possible troubles for breeders, since larger grains were not associated to higher yield, except for the crosses UPF16 × UFRGS17 and UFRGS17 ×
URPel95/015. The trait number of grains per plant (NGP) was directly correlated with GY in all crosses, although the direct effects estimates on GY were negative for the crosses UPF16 × UPF18, UPF16 ×
URPel95/015, UPF18 × UFRGS17 and UFRGS7 × URPel95/015, indicating that correlations are not the main causes altering GY, which could be explained, in the present work, by indirect effects via NPP and mainly via panicle weight (PW).
Key words: Avena sativa L., heritability, indirect selection
APLICABILIDADE DE CORRELAÇÕES FENOTÍPICAS,
CANÔNICAS E COEFICIENTES DE TRILHA NA SELEÇÃO DE
GENÓTIPOS EM AVEIA
RESUMO: A seleção indireta através de caracteres com maior herdabilidade e de fácil mensuração, poderá resultar num elevado progresso genético em relação ao uso de seleção direta. Este trabalho foi conduzido com o objetivo de: (1) estimar as correlações fenotípicas entre rendimento de grãos de plantas individuais e caracteres agronômicos de interesse na seleção de genótipos de aveia branca; (2) identificar os caracteres que evidenciam os maiores efeitos diretos e indiretos sobre o rendimento de grãos; (3) determinar a intensidade de associação entre componentes primários e secundários do rendimento de grãos; e, (4) avaliar a consistência dessas estimativas utilizando cinco genótipos de aveia utilizando-se o esquema de cruzamentos dialélicos. O número de panículas por planta (NPP) evidencia ser o caráter mais correlacionado com o rendimento de grãos (RG) de plantas individuais, tanto por meio das correlações simples como via efeitos diretos sobre o rendimento de grãos; Para peso médio de grãos (PMG) × RG, na maioria dos cruzamentos à ausência de associação, podendo revelar dificuldades aos melhoristas, à medida que grãos maiores não estão associados a rendimento superior, exceto para os cruzamentos UPF16 × UFRGS17 e UFRGS17 × URPel95/015. O caráter número de grãos por panícula (NGP) está diretamente correlacionado com RG em todos os cruzamentos, porém, as estimativas dos efeitos diretos sobre RG foram negativas para os cruzamentos UPF16 × UPF18, UPF16 × URPel95/ 015, UPF18 × UFRGS17, indicando que as correlações não são as principais causas de alteração no RG, o que pode ser explicado, no presente trabalho, pelos efeitos indiretos via NPP e principalmente via peso de panícula (PP).
INTRODUCTION
The great challenge for oat breeders consists in identifying genetic make-ups that superate variet-ies by grain yield. To reach this goal, however, McGinnis & Shebeski (1968) have reported the impor-tance of using selection strategies, mainly for quanti-tative traits, in highly segregating populations. Inten-sifying artificial selection for low heritability traits of difficult gene action estimation must be practiced in advanced generations with reduced frequency of het-erozygosity (Allard, 1999). The indirect selection through less complex traits with larger heritability and of easy measurement could, however, result in larger genetic progress when compared to direct selection.
Considerable importance has been given to studies involving correlation of traits in breeding pro-grams. The quantification and interpretation of these correlations can result in mistakes on selection strate-gies (Cruz & Regazzi, 1997), since a high correlation can be the result of a third trait or a group of traits ef-fecting these traits. In this scenario, path analysis is a tool that is available to the breeder for better under-standing the causes involved in the associations be-tween traits and to partition the existing correlation in direct and indirect effects, through a main variable. Another important tool for the understanding of traits associations is the canonic correlation (Dunteman, 1984). This technique identifies and quantifies the ex-isting correlation between two traits complexes.
The objectives of this work were: (1) to esti-mate the phenotypic correlations between grain yield of individual plants and other agronomic traits for the selection of oat genotypes; (2) to identify the traits that have the higher direct and indirect effects on grain yield; and, (3) to determine the association intensity between primary and secondary components of grain yield.
MATERIAL AND METHODS
The experiment was conducted at the Centro Agropecuário da Palma, in the experimental area be-longing to the Centro de Genômica e Fitomelhoramento, located at Capão do Leão County, RS, Brazil, in 2002. The soil is classified as A Typic Hapludult. Disease control was performed with two fungicide applications 1-p-chlorophenyl-4, 4-dimethyl-3 - ( 1 H - 1 , 2 , 4 - t r i a z o l - 1 - y l m e t h y l ) p e n t a n - 4-dimethyl-3 - o l (Tebuconazole) at the rate of 0.75 L ha-1 of commer-cial product. The first application was performed when the first pustules of leaf rust (Puccinia coronata f. sp. avenae) were found and the second when they reap-peared.
Five oat genotypes (UPF 16, UPF 18, UFRGS 7, UFRGS 17 and URPel 95/015) were crossed in a diallel format, without reciprocal crosses. Parents were chosen based on grain yield and traits of agronomic importance, as well as by the genetic dissimilarity showed by them. Hybrid seeds were obtained during the winter of 2001, through artificial crosses. The F2 populations were produced by selfing F1 plants during the summer of 2001/2002 in greenhouse. F2 popula-tions were evaluated in a completely randomized de-sign. Each plant was considered an experimental unit. Plants were grown in 3 m long rows, with 0.3 m spac-ing between plants and between rows. The number of individuals varied according to the cross. Two crosses (UPF 18 × UFRGS 17 and UFRGS 17 × URPel 95/ 015) had smaller populations, with 134 and 136 indi-viduals, respectively, due to problems occurring dur-ing F1 selfing. For the remaining crosses the popula-tion sizes were about 206 plants.
The following were evaluated in the field: veg-etative cycle (CV), in number of days between the emergence of seedlings and emission of the main panicle; plant height (PH), measured from soil level to the tip the main panicle; and the reproductive cycle (RC), in number of days between the flowering and harvesting maturity. The main panicle of each plant was identified in the field, using a tape, during the flowering phase. Plants were harvested individually. In the laboratory, the main panicle was detached and the number of panicles per plant (NPP) was counted. Ex-cept for the main panicle, the remaining panicles were threshed together to compose the plant grain yield (GY), from the main panicle, panicle weight (PW), number of grains per panicle (NGP) and the weight of a thousand grains (WTG), were determined, by divid-ing panicle grain weight by number of grains.
The statistical analysis consisted on obtaining Pearson correlation coefficients between all considered variables (Steel & Torrie, 1960). After obtaining the cor-relations matrix among the analyzed traits, path analy-sis was performed considering grain yield as dependent variable. From the basic equations for path analysis, the solution for the matrices was obtained through the nor-mal equation system, as follows: X’Xβ = X’Y, in with X’X is a non-singular matrix from the correlations be-tween the explanatory variables; β is a column-vector of path coefficients; and X’Y is a column-vector of the correlations between the explanatory variables and the main variable (Cruz & Regazzi, 1997).
Regazzi (1997), and the significance evaluated using chi-square test. Path analyses and canonical correla-tion estimates were obtained by the GENES software (Cruz, 2001).
RESULTS AND DISCUSSION
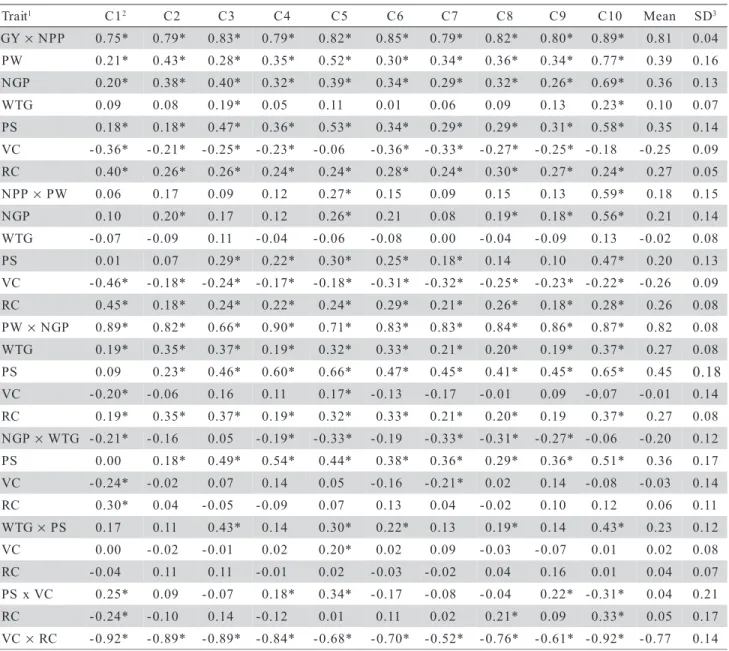
The estimates of Pearson correlation coeffi-cients among all traits on the ten F2 populations, are shown in Table 1. There was a high correlation be-tween grain yield (GY) and number of panicles/plant (NPP) for all crosses, with values varying from 0.75
for the cross UPF 16 × UPF 18 to 0.89 for the cross UFRGS 17 × URPel 95/015. This indicates that the trait NPP is largely responsible for the determining grain yield in individual plants, consistent with the findings of Benin et al. (2003a). Chaubey & Richaria (1993) determined the genetic variability and the simple correlation coefficient for eight quantitative traits in 80 rice (Oryza sativa spp. indica), cultivars finding a broad range for the majority of traits and high broad sense heritability for plant height and tiller num-ber. In this sense, traits NPP seems to be strategic in searching high grain yield genotypes.
Table 1 - Estimative of Pearson correlation coefficients among eight traits mean and standard deviation (SD) evaluated in a dialed cross involving five oat genotypes (Avena sativa L.). Pelotas/RS-2005.
1GY= grain yield per plant; NPP= number of panicles per plant; PW= panicle weight; NGP= number of grains per panicle; WTG=
weight of a thousand grains; PS= plant stature; VC= vegetative cycle and RC= reproductive cycle; 2C1 = UPF 16 × UPF 18; C2 = UPF
16 × UFRGS 7; C3 = UPF 16 × UFRGS 17; C4 = UPF 16 × URPel 95/015; C5 = UPF 18 × UFRGS 7; C6 = UPF 18 × UFRGS 17; C7 = UPF 18 × URPel 95/015; C8 = UFRGS 7 × UFRGS 17; C9 = URFGS 7 × URPel 95/015; C10 = UFRGS 17 × URPel 95/015; 3SD =
standard deviation among correlation estimatives; *Significant at 1% error probability by the t test.
t i a r
T 1 C12 C2 C3 C4 C5 C6 C7 C8 C9 C10 Mean SD3
Y
G × NPP 0.75* 0.79* 0.83* 0.79* 0.82* 0.85* 0.79* 0.82* 0.80* 0.89* 0.81 0.04
W
P 0.21* 0.43* 0.28* 0.35* 0.52* 0.30* 0.34* 0.36* 0.34* 0.77* 0.39 0.16
P G
N 0.20* 0.38* 0.40* 0.32* 0.39* 0.34* 0.29* 0.32* 0.26* 0.69* 0.36 0.13
G T
W 0.09 0.08 0.19* 0.05 0.11 0.01 0.06 0.09 0.13 0.23* 0.10 0.07
S
P 0.18* 0.18* 0.47* 0.36* 0.53* 0.34* 0.29* 0.29* 0.31* 0.58* 0.35 0.14
C
V -0.36* -0.21* -0.25* -0.23* -0.06 -0.36* -0.33* -0.27* -0.25* -0.18 -0.25 0.09
C
R 0.40* 0.26* 0.26* 0.24* 0.24* 0.28* 0.24* 0.30* 0.27* 0.24* 0.27 0.05
P P
N ×PW 0.06 0.17 0.09 0.12 0.27* 0.15 0.09 0.15 0.13 0.59* 0.18 0.15
P G
N 0.10 0.20* 0.17 0.12 0.26* 0.21 0.08 0.19* 0.18* 0.56* 0.21 0.14
G T
W -0.07 -0.09 0.11 -0.04 -0.06 -0.08 0.00 -0.04 -0.09 0.13 -0.02 0.08
S
P 0.01 0.07 0.29* 0.22* 0.30* 0.25* 0.18* 0.14 0.10 0.47* 0.20 0.13
C
V -0.46* -0.18* -0.24* -0.17* -0.18* -0.31* -0.32* -0.25* -0.23* -0.22* -0.26 0.09
C
R 0.45* 0.18* 0.24* 0.22* 0.24* 0.29* 0.21* 0.26* 0.18* 0.28* 0.26 0.08
W
P × NGP 0.89* 0.82* 0.66* 0.90* 0.71* 0.83* 0.83* 0.84* 0.86* 0.87* 0.82 0.08
G T
W 0.19* 0.35* 0.37* 0.19* 0.32* 0.33* 0.21* 0.20* 0.19* 0.37* 0.27 0.08
S
P 0.09 0.23* 0.46* 0.60* 0.66* 0.47* 0.45* 0.41* 0.45* 0.65* 0.45 0.18
C
V -0.20* -0.06 0.16 0.11 0.17* -0.13 -0.17 -0.01 0.09 -0.07 -0.01 0.14
C
R 0.19* 0.35* 0.37* 0.19* 0.32* 0.33* 0.21* 0.20* 0.19 0.37* 0.27 0.08
P G
N × WTG -0.21* -0.16 0.05 -0.19* -0.33* -0.19 -0.33* -0.31* -0.27* -0.06 -0.20 0.12
S
P 0.00 0.18* 0.49* 0.54* 0.44* 0.38* 0.36* 0.29* 0.36* 0.51* 0.36 0.17
C
V -0.24* -0.02 0.07 0.14 0.05 -0.16 -0.21* 0.02 0.14 -0.08 -0.03 0.14
C
R 0.30* 0.04 -0.05 -0.09 0.07 0.13 0.04 -0.02 0.10 0.12 0.06 0.11
G T
W × PS 0.17 0.11 0.43* 0.14 0.30* 0.22* 0.13 0.19* 0.14 0.43* 0.23 0.12
C
V 0.00 -0.02 -0.01 0.02 0.20* 0.02 0.09 -0.03 -0.07 0.01 0.02 0.08
C
R -0.04 0.11 0.11 -0.01 0.02 -0.03 -0.02 0.04 0.16 0.01 0.04 0.07
C V x S
P 0.25* 0.09 -0.07 0.18* 0.34* -0.17 -0.08 -0.04 0.22* -0.31* 0.04 0.21
C
R -0.24* -0.10 0.14 -0.12 0.01 0.11 0.02 0.21* 0.09 0.33* 0.05 0.17
C
Chaubey & Richaria (1993) and Gravois & McNeal (1993) also observed negative correlation be-tween plant height and number of panicles/plant in rice, and concluded that selection for shorter genotypes tends to produce more panicles than the selection of taller genotypes. In the present work, for 60% of the crosses, plant height was positively correlated with NPP. These data agree with those of Mirza et al. (1992) and Benin et al. (2003a) who obtained positive corre-lations between plant height and NPP for rice and two oat crosses. Thus, the selection of short plants does not necessarily ensure a high number of fertile tillers.
An association of interest for breeders was found for NPP × PW, where there were significant positive correlations for the crosses UPF 18 × UFRGS 7 and UFRGS 17 × URPel 95/015 and non-significant, though also positive, for the remaining crosses. This indicates that increasing the number of panicles/plant does not necessarily reduce panicle weight, and also promotes the increase in some parental combinations (UPF 18 × UFRGS 7 and UFRGS 17 × URPel 95/015). This probably occurred due to the positive correlations between NGP and NPP, although significant for only half of the crosses. On the other hand, correlation es-timates for NPP × WTG showed a negative trend. Thus, the increase in NPP tends to influence NGP posi-tively and WTG negaposi-tively. Oat breeders may have trouble when selecting through NPP, genotypes that combine high yield potential and high weight of a thou-sand grains.
Among the primary components of grain yield, another important association was NGP × WTG. The correlation coefficients for this association ranged from -0.33 to 0.05. For the majority of the crosses (UPF 16
× UPF 18, UPF 16 × URPel 95/015, UPF 18 × UFRGS 7, UPF 18 × URPel 95/015, UFRGS 7 × UFRGS 17 and UFRGS 7 × URPel 95/015) the correlation esti-mates were significant, showing a compensatory effect between these two components. This is consistent with the findings of Benin et al. (2003a), but contrasting with those of Yioshida (1981) and Caierão et al. (2001), who found small compensating effect between number and weight of rice panicles and between num-ber and weight of grains in oats, respectively.
Besides the high association with NPP, GY is positively associated with PW, NGP, PS and RC, in all crosses, and negatively associated with VC for eight out of ten crosses (Table 1). Based on the results of simple correlations it can be inferred that the selection for plants with fewer days from emergence to flower-ing and longer period between flowerflower-ing and matura-tion would provide higher yielding genotypes. Evalu-ating a collection of oat genotypes, Benin et al. (2003b), observed that RC is positively correlated with
GY and hectoliter weight. This can be explained, by the fact that these plants have more time for grain fill-ing and, therefore, yield more. However, the correla-tion of WTG × GY was not significant for the major-ity of crosses. Thus, it is important to consider the cor-relation of the trait most positively associated to GY (NPP) with VC. This correlation was significantly negative for all crosses showing that plants with smaller number of fertile tillers are associated with long VC and with direct implications on GY. Negative correlation between GY × VC was also verified by Caierão et al. (2001), although the authors did not evaluate the correlation between VC and NPP.
Another important aspect for oat breeding re-lates to the lack of association between WTG × GY for the majority of crosses, possibly posing difficul-ties to breeders, since large grains are not associated to higher yields. These results contradict those of Caierão et al. (2001) and Benin et al. (2003a), who ob-tained a positive association between these traits. This could possibly be due to NGP effects.
Some diverging results are found when the genotypes used to originate the segregant population are changed. The estimates of phenotypic correlations (rp) between PW × VC ranged from significantly nega-tive for the cross UPF 16 × UPF 18 (-0.20) to positive for UPF 18 × UFRGS 7 (0.17). This also happened be-tween PS × VC and PS × RC, although in distinct crosses. This indicates that correlation estimates are dependent upon the genetic constitution evaluated and upon the environment in which the study is conducted. This discrepancy, as suggested by Falconer (1987), can be attributed to modifying environmental effects and to different physiological mechanisms controlling trait expression.
The indirect selection based on traits of easy measurement and identification in oats, such as PW (Marchioro, 2003), also revealed potential use for the evaluated populations. The results indicate that PW is more dependent on NGP than on WTG (Table 1). Since WTG is a trait of considerable importance for the oat crop, these results inspire some care, since that indi-rect selection via PW can lead to plants with higher NGP but with smaller grains. In this sense, the use of combined selection considering PW and WTG in in-direct selection is important, as also suggested by Caierão et al. (2001).
such correlations are due to the environmental action on genetically independent components, which develop on a segmental manner, i. e., first the number of panicles/plant, then the number of grains/panicle and, last, the weight of grains. When limiting environmen-tal factors cause intense competition among plants, there is also an intense competition among plant parts for nutrients and metabolites. This competition is par-ticularly high during reproductive structure formation, which results in a compensatory variation between the primary yield components (Lana, 1996). Despite the compensating effect among the primary yield compo-nents, i. e., an increase in NPP reflects in a decrease of PW an vice-versa, the possibility exists for a joint increase on these components for same crosses, as in the case of UPF 18 × UFRGS 7 and UFRGS 17 ×
URPel 95/015, where the single correlation (0.27 and 0.59, respectively) has been shown to be significantly positive (Table 1).
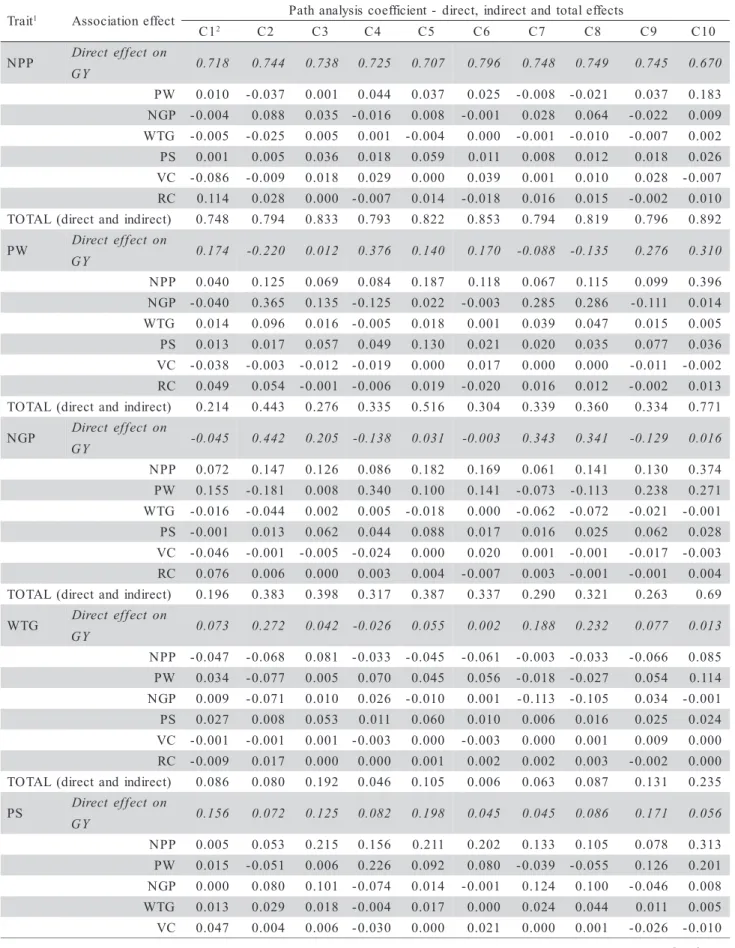
Due to the complex relationships between pri-mary and secondary grain yield components, the cor-relation coefficients between the traits evaluated were used to obtain the path analysis coefficient (Table 2). The unfolding of path analysis coefficients support the high correlation between NPP and GY through the higher direct effects on GY, evidencing associations ranging from 0.67 to 0.79 from crosses UFRGS 7 ×
URPel 95/015 and UPF 18 × UFRGS 17, respectively (Table 2). These values are consistent with rp coeffi-cients, with similar magnitude and signal, supporting the hypothesis of a true association between these traits. Thus, plants with more fertile tillers result in higher grain yield. Breeders might, therefore, be inter-ested in obtaining plants with higher number of tillers. Similar results were obtained by Benin et al. (2003a) in four evaluated crosses. Yan & Wallace (1995) empha-sized that besides the number of panicles/plant the sen-sitivity to increase in genotype density should be taken into account. According to those authors, the yield po-tential of a given genotype (Ymax) is calculated by the yield potential of individual plants squared (a2
) multi-plied by its tolerance to an increase in density (b-1), ac-cording to equation Ymax = (1/4)a2b-1. Tolerance to den-sity is, the tolerance to scarcity of resources for growth such as light, water, nutrients and temperature. Thus, the great importance of NPP in determining grain yield of a genotype, and this trait becomes strategic for the selection of superior genetic make-ups. The remind-ing traits showed reduced indirect effects in compos-ing the simple correlation between GY × NPP.
The direct effects of PW and GY (Table 2) did not show the same consistency of NPP. Direct effects varying from negative (-0.22; UPF 16 × UFRGS 7) to positive (0.37; UPF 16 × URPel 95/015) were found.
For the some crosses (UPF 16 × UPF 18, UPF 16 ×
URPel 95/015, UPF 18 × UFRGS 17, UFRGS 7 ×
URPel 95/015 and UFRGS 17 × URPel 95/015) the di-rect effects between these traits were consistent with phenotypic correlation coefficients (rp), although, for the remaining crosses the direct effects were lower when compared to rp. These results shower the inad-equacy of simple correlations in some situations, as pointed by Santos et al. (1995) and Benin et al. (2003a). In the case of crosses that showed the smaller direct effects, including negative values (UPF 16 ×
UFRGS 7, UPF 16 × UFRGS 17, UPF 18 × URPel 95/ 015 and UFRGS 7 × UFRGS 17) there were also high estimates of indirect effects via NGP. For these four crosses there were high direct effects of NGP on GY with reduced indirect effects via PW. Consequently, the indirect selection for grain yield via PW should be as-sociated to NGP. NGP was directly correlated with ba-sic variable (GY) in all crosses (Table 1). The estimates for direct effects on GY, however, were negative for the crosses UPF 16 × UPF 18, UPF 16 × URPel 95/ 015, UPF 18 × UFRGS 17, and UFRGS 7 × URPel 95/ 015, indicating that correlations are not the main causes of alterations in GY, which can be explained, in the present work, by indirect effects via NPP and mainly via PW. According to Vencovsky & Barriga (1992), in such situations, the causing indirect effects must be considered simultaneously in the selection process.
The rp values showed significant associations between the GY and WTG for the crosses UPF 16 ×
UFRGS 17 and UFRGS 17 × URPel 95/015. The par-titioning of these correlations however revealed a di-rect effect of WTG on GY only for the crosses UPF 16 × UFRGS 7, UPF 18 × URPel 95/015 and UFRGS 7 × UFRGS 17 (Table 2). In this situation there were indirect, effects via NPP and PW in diluting the simple correlation verified in the crosses UPF 16 × UFRGS 17 and UFRGS 17 × URPel 95/015, respectively. In some crosses there was a high direct effect of WTG which should, therefore, be used in the combined se-lection with other traits, depending on the cross, to maximize genetic gain.
PS and RC showed to be positively associated to GY, through simple correlation, for all the crosses. On the other hand, VC showed high negative simple correlations for the majority of crosses (Table 1). The direct effects of these traits on GY (Table 2) were all small when compared to the phenotypic correlation coefficients. This can be explained by the strong in-terference of indirect effects via NPP which, in the majority of cases, were higher than the direct effects.
Continue...
Table 2 - Estimative of direct, indirect and total effects of path analysis coefficients on grain yield of individual plants for a diallelic cross involving five oat parents (Avena sativa L.). Pelotas/RS-2005.
t i a r
T 1 Associationeffect Pathanalysiscoefficient- direct, indirectand totaleffects
1
C 2 C2 C3 C4 C5 C6 C7 C8 C9 C10
P P
N Directeffecton
Y
G 0.718 0.744 0.738 0.725 0.707 0.796 0.748 0.749 0.745 0.670
W
P 0.010 -0.037 0.001 0.044 0.037 0.025 -0.008 -0.021 0.037 0.183
P G
N -0.004 0.088 0.035 -0.016 0.008 -0.001 0.028 0.064 -0.022 0.009
G T
W -0.005 -0.025 0.005 0.001 -0.004 0.000 -0.001 -0.010 -0.007 0.002
S
P 0.001 0.005 0.036 0.018 0.059 0.011 0.008 0.012 0.018 0.026
C
V -0.086 -0.009 0.018 0.029 0.000 0.039 0.001 0.010 0.028 -0.007
C
R 0.114 0.028 0.000 -0.007 0.014 -0.018 0.016 0.015 -0.002 0.010 ) t c e r i d n i d n a t c e r i d ( L A T O
T 0.748 0.794 0.833 0.793 0.822 0.853 0.794 0.819 0.796 0.892
W
P Directeffecton
Y
G 0.174 -0.220 0.012 0.376 0.140 0.170 -0.088 -0.135 0.276 0.310
P P
N 0.040 0.125 0.069 0.084 0.187 0.118 0.067 0.115 0.099 0.396
P G
N -0.040 0.365 0.135 -0.125 0.022 -0.003 0.285 0.286 -0.111 0.014
G T
W 0.014 0.096 0.016 -0.005 0.018 0.001 0.039 0.047 0.015 0.005
S
P 0.013 0.017 0.057 0.049 0.130 0.021 0.020 0.035 0.077 0.036 C
V -0.038 -0.003 -0.012 -0.019 0.000 0.017 0.000 0.000 -0.011 -0.002
C
R 0.049 0.054 -0.001 -0.006 0.019 -0.020 0.016 0.012 -0.002 0.013
) t c e r i d n i d n a t c e r i d ( L A T O
T 0.214 0.443 0.276 0.335 0.516 0.304 0.339 0.360 0.334 0.771
P G
N Directeffecton
Y
G -0.045 0.442 0.205 -0.138 0.031 -0.003 0.343 0.341 -0.129 0.016
P P
N 0.072 0.147 0.126 0.086 0.182 0.169 0.061 0.141 0.130 0.374
W
P 0.155 -0.181 0.008 0.340 0.100 0.141 -0.073 -0.113 0.238 0.271 G
T
W -0.016 -0.044 0.002 0.005 -0.018 0.000 -0.062 -0.072 -0.021 -0.001
S
P -0.001 0.013 0.062 0.044 0.088 0.017 0.016 0.025 0.062 0.028
C
V -0.046 -0.001 -0.005 -0.024 0.000 0.020 0.001 -0.001 -0.017 -0.003
C
R 0.076 0.006 0.000 0.003 0.004 -0.007 0.003 -0.001 -0.001 0.004
) t c e r i d n i d n a t c e r i d ( L A T O
T 0.196 0.383 0.398 0.317 0.387 0.337 0.290 0.321 0.263 0.69
G T
W Directeffecton
Y
G 0.073 0.272 0.042 -0.026 0.055 0.002 0.188 0.232 0.077 0.013
P P
N -0.047 -0.068 0.081 -0.033 -0.045 -0.061 -0.003 -0.033 -0.066 0.085
W
P 0.034 -0.077 0.005 0.070 0.045 0.056 -0.018 -0.027 0.054 0.114
P G
N 0.009 -0.071 0.010 0.026 -0.010 0.001 -0.113 -0.105 0.034 -0.001
S
P 0.027 0.008 0.053 0.011 0.060 0.010 0.006 0.016 0.025 0.024
C
V -0.001 -0.001 0.001 -0.003 0.000 -0.003 0.000 0.001 0.009 0.000
C
R -0.009 0.017 0.000 0.000 0.001 0.002 0.002 0.003 -0.002 0.000 ) t c e r i d n i d n a t c e r i d ( L A T O
T 0.086 0.080 0.192 0.046 0.105 0.006 0.063 0.087 0.131 0.235
S
P Directeffecton
Y
G 0.156 0.072 0.125 0.082 0.198 0.045 0.045 0.086 0.171 0.056
P P
N 0.005 0.053 0.215 0.156 0.211 0.202 0.133 0.105 0.078 0.313
W
P 0.015 -0.051 0.006 0.226 0.092 0.080 -0.039 -0.055 0.126 0.201
P G
N 0.000 0.080 0.101 -0.074 0.014 -0.001 0.124 0.100 -0.046 0.008
G T
W 0.013 0.029 0.018 -0.004 0.017 0.000 0.024 0.044 0.011 0.005 C
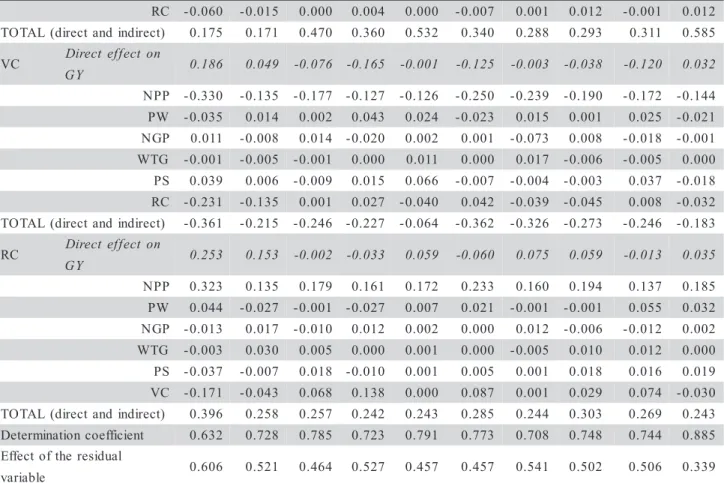
GY in all crosses. In this sense, distinct traits must be considered together with NPP, at the time of selection. For the crosses UPF 16 × URPel 95/015, UPF 18 ×
UFRGS 17, UFRGS 7 × URPel 95/015 and UFRGS 17
× URPel 95/015, the second major direct effect was observed for PW, while for UPF 16 × UFRGS 7, UPF 16 × UFRGS 17, UPF 18 × URPel 95/015 and UFRGS 7 × UFRGS 17 was NGP. For UPF 16 × UPF 18 and UPF 18 × UFRGS 7, the major direct effects were de-tected for RC and PS, respectively. Similar results were obtained by Benin et al. (2003a). According to these authors, the associations and direct and indirect effects of variables analyzed had different associations in re-lation to the genetic constitutions analyzed. This incon-sistency demonstrates the need for higher knowledge about the relationships among the main parents used in hybridizations in breeding programs, in order to en-able a more critical choice of selection strategies to be employed.
The determination coefficients ranged from 0.632 (UPF 16 × UPF 18) to 0.885 (UFRGS 17 ×
URPel 95/015) indicating that a large amount of GY
shown for many crosses was due to effects of the ana-lyzed variables. These values are satisfactory for this work, since grain yield is a quantitative trait, with large number of genes of small effect on the trait and highly influenced by the environment.
In oat, Caierão et al. (2001), Benin et al. (2003a) and Marchioro (2003), indicated that the use of panicle weight to obtain genetic gains in grain yield, due to GY is a trait of low heritability, regulated by many genes and, therefore of low efficiency in selec-tion. However, PW is composed by two primary grain yield components, NGP and WTG. According to Ramalho et al. (1993), the secondary components are equally complex and have relatively low hereditability, as wile as and grain yield. On the other hand Cruz & Regazzi (1997) postulated that selection of secondary components aimed at genetic gain on primary compo-nents and, consequently, increase in grain yield, can be a qualified strategy in plant breeding, because sec-ondary components are generally less complex and have large hereditability and, sometimes, are easier to be identified and measured.
Table 2 - Continuation.
C
R -0.060 -0.015 0.000 0.004 0.000 -0.007 0.001 0.012 -0.001 0.012
) t c e r i d n i d n a t c e r i d ( L A T O
T 0.175 0.171 0.470 0.360 0.532 0.340 0.288 0.293 0.311 0.585
C
V Directeffecton
Y
G 0.186 0.049 -0.076 -0.165 -0.001 -0.125 -0.003 -0.038 -0.120 0.032
P P
N -0.330 -0.135 -0.177 -0.127 -0.126 -0.250 -0.239 -0.190 -0.172 -0.144
W
P -0.035 0.014 0.002 0.043 0.024 -0.023 0.015 0.001 0.025 -0.021
P G
N 0.011 -0.008 0.014 -0.020 0.002 0.001 -0.073 0.008 -0.018 -0.001
G T
W -0.001 -0.005 -0.001 0.000 0.011 0.000 0.017 -0.006 -0.005 0.000
S
P 0.039 0.006 -0.009 0.015 0.066 -0.007 -0.004 -0.003 0.037 -0.018
C
R -0.231 -0.135 0.001 0.027 -0.040 0.042 -0.039 -0.045 0.008 -0.032
) t c e r i d n i d n a t c e r i d ( L A T O
T -0.361 -0.215 -0.246 -0.227 -0.064 -0.362 -0.326 -0.273 -0.246 -0.183
C
R Directeffecton
Y
G 0.253 0.153 -0.002 -0.033 0.059 -0.060 0.075 0.059 -0.013 0.035
P P
N 0.323 0.135 0.179 0.161 0.172 0.233 0.160 0.194 0.137 0.185
W
P 0.044 -0.027 -0.001 -0.027 0.007 0.021 -0.001 -0.001 0.055 0.032
P G
N -0.013 0.017 -0.010 0.012 0.002 0.000 0.012 -0.006 -0.012 0.002
G T
W -0.003 0.030 0.005 0.000 0.001 0.000 -0.005 0.010 0.012 0.000
S
P -0.037 -0.007 0.018 -0.010 0.001 0.005 0.001 0.018 0.016 0.019
C
V -0.171 -0.043 0.068 0.138 0.000 0.087 0.001 0.029 0.074 -0.030
) t c e r i d n i d n a t c e r i d ( L A T O
T 0.396 0.258 0.257 0.242 0.243 0.285 0.244 0.303 0.269 0.243
t n e i c i f f e o c n o i t a n i m r e t e
D 0.632 0.728 0.785 0.723 0.791 0.773 0.708 0.748 0.744 0.885
l a u d i s e r e h t f o t c e f f E e l b a i r a
v 0.606 0.521 0.464 0.527 0.457 0.457 0.541 0.502 0.506 0.339 1GY= grain yield per plant; NPP= number of panicles per plant; PW= panicle weight; NGP= number of grains per panicle; WTG=
weight of a thousand grains; PS= plant stature; VC= vegetative cycle and RC= reproductive cycle; 2C1 = UPF 16 × UPF 18; C2 = UPF
In this sense, through canonic correlations (Table 3) associations between primary (NPP, NGP and WTG) and secondary (PS, VC and RC) grain yield components in oats can be verified. The first canonic correlation was significant, at 1% probability, for all crosses. The second, with exception for UPF 16 ×
UFRGS 7, UPF 18 × UFRGS 17 and UFRGS 17 ×
URPel 95/015 (non significant), were also different from zero by chi–square test, indicating relationships among the groups of traits considered. Thus, only the first two canonic pairs are interesting for the present study. With exception of crosses UPF 16 × UPF 18 and UPF 16 × UFRGS 7, for all the remaining crosses it was found that shorter plants tend to produce panicles with more grains (NGP). Among the secondary com-ponents of grain yield, PS was the one that presented higher rp with NGP (Table 1) and, therefore, the mul-tivariate analysis, based on canonic correlations, con-firmed the resulted already found in studies of simple correlations. However, for UPF 16 × UPF 18, there was indication that plants with larger periods from flower-ing to maturity (CR) tend to be associated more fer-tile tillers (NPP) and, for UPF 16 × UFRGS 17, higher RC means higher weight of a thousand grains (WTG). Comparing these results with the simple correlations (rp), RC revealed a higher rp with NPP for UPF 16 ×
UPF 18 (0.45) and the phenotypic correlations between NPP × PS and NPP × VC were not significant, i. e., the canonic correlations confirmed the simple corre-lations. However, for UPF 16 × UFRGS 7 the rp be-tween WTG and RC did not differ from zero, and the canonic correlations revealed the influence of RC in
determining WTG. Thus, there is evidence of interfer-ence from other traits on the estimative of the simple correlation between them.
Regarding the second canonic pair (Table 3), four (UPF 16 × UFRGS 17, UPF 18 × UFRGS 7, UPF 18 × URPel 95/015 and UFRGS 7 × URPel 95/015) out of seven crosses showed significance for the sec-ond canonic correlation, the reduction in VC determin-ing the increase in NPP. In these cases, there was a con-firmation of the results observed for the phenotypic correlations (Table 1), where NPP was negatively as-sociated to VC for the referred crosses. However, the phenotypic correlation for the remaining crosses, be-tween NPP and VC also revealed a negative sign, and there was no confirmation by multivariate analysis of canonic correlations. According to Carvalho et al. (1998), the association between two traits can be de-fined by others and, consequently, to obtain higher NPP genotypes, there weight be a need to simultaneous by select such traits, besides VC.
These results show the importance of path analysis and canonic correlation studies for the under-standing of the relationships among primary and sec-ondary grain yield components in oat, for the evalu-ated genetic constitutions. This is due to the fact that the magnitude of simple correlations does not always adequately reflect the cause–effect relationship be-tween these traits. In breeding programs, this relation-ship among traits must be taken into account, because the change in one, by means of selection, causes changes in another, when the opposite situation would be desirable. Thus, according to the population being
Table 3 - Canonic correlations (r) and canonic pairs estimated among primary (NPP, NGP and WTG) and secondary (PS, VC and RC) grain yield components in a diallelic cross in oats (Avena sativa L.). Pelotas/RS-2005.
S E S S O R C
1
C 2 C2 C3 C4 C5 C6 C7 C8 C9 C10
t i a r
T 1 CANONICPAIRS
1st 2nd 1st 2nd 1st 2nd 1st 2nd 1st 2nd 1st 2nd 1st 2nd 1st 2nd 1st 2nd 1st 2nd
P P
N 0.84 0.10 0.41 0.93 0.24 0.94 0.29 0.96 0.34 0.87 0.51 0.81 0.52 0.74 0.21 0.99 0.15 0.94 0.18 1.17
P G
N 0.49 -0.28 0.56 -0.40 0.67 -0.54 0.91 -0.41 0.79 -0.29 0.70 -0.45 0.85 -0.47 0.88 -0.45 0.93-0.43 0.67 -0.60
G T
W 0.23 0.91 0.79 -0.32 0.60 -0.01 0.41 -0.06 0.71 -0.58 0.52 -0.57 0.38 -0.72 0.72 -0.06 0.64 0.26 0.64 -0.49
S
O 0.19 0.16 0.23 -0.03 0.65 -0.02 0.61 0.02 0.67 0.07 0.48 -0.12 0.43 -0.14 0.44 -0.05 0.39 0.06 0.74 -0.06
C
V -0.25 -0.32 0.29 -0.24 0.16 -0.18 0.06 -0.06 -0.01 -0.34 -0.13 -0.13-0.29 -0.18 -0.13 -0.13 0.12-0.33 0.28 0.12
C
R 0.33 -0.33 0.47 -0.10 0.15 0.10 0.10 0.20 0.14 -0.05 0.08 0.12 0.03 0.07 -0.12 0.17 0.25-0.04 0.15 0.38
r 0.55 0.21 0.33 0.16 0.66 0.27 0.61 0.25 0.69 0.29 0.54 0.24 0.53 0.26 0.43 0.28 0.48 0.30 0.71 0.26
. f i n g i
S * * * ns * * * * * * * ns * * * * * * * ns
1NPP= number of panicles per plant; NGP= number of grains per panicle; WTG= weight of a thousand grains; PS= plant stature; VC=
vegetative cycle and RC= reproductive cycle; 2C1 = UPF 16 × UPF 18; C2 = UPF 16 × UFRGS 7; C3 = UPF 16 × UFRGS 17; C4 =
UPF 16 × URPel 95/015; C5 = UPF 18 × UFRGS 7; C6 = UPF 18 × UFRGS 17; C7 = UPF 18 × URPel 95/015; C8 = UFRGS 7 ×
analyzed, the results may greatly differ. This shows that populations are distinct due to, basically differences in the parents.
CONCLUSIONS
The number of panicles per plant shows to be the most correlated trait with grain yield of individual plants, both by means of simple correlations as via di-rect effects on grain yield. The use of panicle weight aiming to the indirect selection for grain yield shows potential use in the analyzed genetic constitutions how-ever it must be preferably combined to weight of a thousand grains. Indirect selection via panicle weight in spaced plants can lead to obtain high stature plants. The number of grains per panicle is the main respon-sible by the increase in panicle weight, with a small contribution of weight of a thousand grains. The esti-mates of correlations and direct and indirect effects are population dependent.
ACKNOWLEDGEMENTS
ur thanks to FAPERGS, CNPq and CAPES for sponsoring this research.
REFERENCES
ALLARD, R.W. Principles of plant breeding. New York: John Wiley, 1999. 485 p.
BENIN, G.; CARVALHO, F.I.F.; OLIVEIRA, A.C.; MARCHIORO, V.S.; LORENCETTI, C.; KUREK, A.J.; SILVA, J. A.G.; CARGNIN, A.; SIMIONI, D. Estimativas de correlações e coeficientes de trilha como critério de seleção para rendimento de grãos em aveia. Revista Brasileira de Agrociência, v.9, p.9-16, 2003a.
BENIN, G.; CARVALHO, F.I.F.; OLIVEIRA, A.C.; ASSMANN, I.C.; FLOSS, E.L.; LORENCETTI, C.; MARCHIORO, V. S.; SILVA, J.A. G. Implicações do ambiente sobre o rendimento de grãos em aveia e suas influências sobre estimativas de parâmetros genéticos quantitativos. Revista Brasileira de Agrociência, v.9, p.207-214, 2003b.
CAIERÃO, E.; CARVALHO, F.I.F.; PACHECO, M.T.; LONRECETTI, C.; MARCHIORO, V.S.; SILVA, J.A.G. Seleção indireta em aveia para o incremento no rendimento de grãos. Ciência Rural, v.31, p.231-236, 2001.
CARVALHO, C.G.P.; OLIVEIRA, V.R.; CASALI, V.W.D.; CRUZ, C.D. Correlações canônicas entre componentes primários e secundários da produção de frutos em pimentão. Horticultura Brasileira, v.16, p.113-118, 1998.
CHAUBEY, P.K.; RICHARIA, A.K. Genetic variability, correlations and path-coefficients in indica rice. Indian Journal of Genetics, v.53, p.356-360, 1993.
CRUZ, C.D. Programa genes: aplicativo computacional em genética e estatística. Viçosa: Editora UFV, 2001. 648p.
CRUZ, C.D.; REGAZZI, A.J. Métodos biométricos aplicados ao melhoramento genético. Viçosa: Editora UFV, 1997. 390p. DUNTEMAN, G.H. Introduction to multivariate analysis. Beverly
Hills: Sage Publications, 1984. 237p.
FALCONER, D.S. Introdução à genética quantitativa. Viçosa: UFV, Imprensa Universitária, 1987. 279p.
GRAVOIS, K.A.; McNEW, R.W. Genetic relationships among and selection for rice yield and yield components. Crop Science, v.33, p.249-252, 1993.
LANA, A.M.Q. Avaliação de linhagens de feijão obtidas pelo método de melhoramento single seed descent (ssd) nos sistemas de plantio em monocultivo e consórcio com milho.Viçosa: UFV, 1996. 125p. (Tese - Doutorado em Genética e Melhoramento).
MARCHIORO, V.S. Mecanismos de seleção em populações segregantes de aveia para a otimização do ganho genético embasados em conhecimentos quantitativos e moleculares.Pelotas: UFPel, 2003. 93p. (Tese - Doutorado em Agronomia - Fitomelhoramento). McGINNIS, R.G.; SHEBESKI, L.H. The reliability of single plant
selection for yield in F2. In: INTERNATIONAL WHEAT GENETICS SYMPOSIUM, Canberra, 1968. Proceedings. Canberra:Australian Academy of Science, 1968. p.410-415.
MIRZA, M.J.; FAIZ. F.A; MAJID, A. Correlation studies and path analysis of plant height, yield and yield components in rice (Oryza sativa L.). Sarhad Journal of Agriculture, v.8, p.647-653, 1992. RAMALHO, M.A.P.; SANTOS, J.B.; ZIMMERMANN, M.J.O.
Genética quantitativa em plantas autógamas. Goiânia: Editora da UFG, 1993. 271p.
SANTOS, C.A.F.; REIS, M.S.; CRUZ, C.D.; SEDIYAMA, C.S.
Adequação de modelos no estudo do coeficiente de trilha dos componentes primários e secundários de progênies F6 de soja (Glycine max (L.) Merrill). Revista Ceres, v.42, p.111-121, 1995.
STEEL, R.G.D.; TORRIE, J.H. Principles and procedures of statistics. New York: MacGraw Hill, 1960. 481p.
VENCOVSKY, R.; BARRIGA, P. Genética biométrica no fitomelhoramento. Ribeirão Preto: Sociedade Brasileira de Genética, 1992. 496p.
YAN, W.; WALLACE, D.H. Breeding for negatively associated traits. Plant Breeding Reviews, v.13, p.141-177, 1995.
YIOSHIDA, S. Fundamentals of rice crop science. Los Baños: IRRI, 1981. 1512p.