Rev. Caatinga
CORN-TREE PROXIMITY EFFECTS IN AGROFORESTRY EXPERIMENTS
1VIANNEY REINALDO DE OLIVEIRA2, PAULO SÉRGIO LIMA E SILVA2*, PATRÍCIA LIANY DE OLIVEIRA FERNANDES SIQUEIRA2, IRON MACEDO DANTAS3, MARIA ZULEIDE DE NEGREIROS2
ABSTRACT - In agroforestry systems, annual plants closest to trees may behave differently from plants in rows that are more distant. This study evaluated the proximity effects of Mimosa caesalpiniifolia (sabiá) and
Gliricidia sepium (gliricidia) on corn yield under the taungya and alley cropping systems. The two species were
evaluated, in randomised blocks with five replications, in 2010 and 2011, under taungya and alley cropping, respectively. Three rows of corn (left, middle, and right) were grown between two rows of trees. Sabiá trees grew higher than gliricidia trees. The difference in crown diameter between species depended on plant age. There was a linear relationship between plant age and plant height and between plant age and crown diameter for both sabiá and gliricidia trees. In the taungya system, left rows produced more green ears than middle and right rows, but grain yield was higher in middle rows. In the alley system, green ear yield was also higher in left rows than in middle and right rows, but grain yield was unaffected by row position. In both agroforestry systems, there were no differences in corn yield for corn grown between sabiá or gliricidia trees.
Keywords: Mimosa caesalpiniifolia. Gliricidia sepium. Zea mays. Taungya. Alleys.
EFEITOS DE PROXIMIDADE MILHO - ESPÉCIES ARBÓREAS EM EXPERIMENTOS
AGROFLORESTAIS
RESUMO - Nos sistemas agroflorestais as plantas anuais mais próximas às árvores podem apresentar comportamento diferente das plantas das fileiras mais distantes. O objetivo do trabalho foi avaliar os efeitos de proximidade das leguminosas Mimosa caesalpiniifolia (sabiá, S) e Gliricidia sepium (gliricídia, G) sobre os rendimentos do milho nos sistemas taungya e aléias. Em 2010 e 2011, as espécies foram avaliadas em blocos ao acaso com cinco repetições nos sistemas taungya e aleias, respectivamente. Três fileiras de milho (esquerda, central e direita) foram cultivadas entre cada duas fileiras de árvores. A sabiá foi superior à gliricídia quanto à altura de planta (AP). A sabiá foi superior à gliricídia, quanto ao diâmetro da copa (DC) nas últimas cinco avaliações, exceto na avaliação feita aos 240 dias após o plantio, em que as espécies não diferiram. As espécies não diferiram quanto ao DC nas demais avaliações. A resposta das duas espécies à idade da planta, em termos de AP e DC, foi linear. No sistema taungya, a fileira esquerda produziu mais massa de espigas verdes do que as outras fileiras, mas o rendimento de grãos foi maior na fileira central. Em aléias, a fileira esquerda apresentou maior rendimento de espigas verdes do que as outras fileiras, mas o rendimento de grãos não foi influenciado pela posição da fileira. Nos dois sistemas não existiram diferenças entre espécies quanto aos rendimentos de espigas verdes e de grãos do milho.
Palavras-chave: Mimosa caesalpiniifolia. Gliricidia sepium. Zea mays. Taungya. Aléias.
_____________________ *Corresponding author
1Received for publication in 03/11/2015; accepted in 02/19/2016.
2Department of Crop Science, Universidade Federal Rural do Semi-Árido, Mossoró, RN, Brazil; [email protected], [email protected], [email protected]; [email protected].
INTRODUCTION
Agroforestry systems are alternative land-use management systems that combine trees or shrubs with crops or livestock to increase diversity and to improve farm and forest production, while helping prevent land degradation (ARAUJO et al., 2012). The presence of perennial root systems in cultivated plots improves soil structure and creates macro-pores – increasing water infiltration, reducing surface runoff and erosion, and improving soil penetration by crop roots – and produces nutrient-rich biomass. On the other hand, active tree roots may compete with crops (SCHROTH; LEHMANN, 1995). In agroforestry systems, plant competitive ability for light is determined by leaf area, canopy structure, and root traits. Root traits related to belowground competitive ability include occupied soil space, morphological and physical elasticity, and spatial and temporal soil partitions (RONG; DEHUI, 2009).
Taungya is the most common agroforestry
system in Brazil (SILVA et al., 2001), and is based on a permanent forest component and a temporary agricultural component. The intercropping of forest species with annual crops aims to optimize yield and economic return per unit area. One of the main issues regarding the taungya system is the effect of tree distance on the behavior of annual species, i.e., proximity effects. Studies on proximity effects may help farmers determine the number of rows of annual crops that can be grown between the rows of trees to maximize yield. These studies may also be useful in assessing competition between species, the effects of the tree species on soil nutrients and microclimate (MARIN et al., 2006).
The closing of the tree canopy after one or more years of taungya hinders continued evaluation of the system. However, it provides an opportunity to study alley cropping, an agroforestry system in which trees or shrubs are grown in rows interspersed with annual crops. Before planting the annual crop, the trees are pruned, and the most tender leaves and branches are added to the soil, in a manner similar to green manure. In the alley cropping system, the “interface” effect is sometimes called “hedgerow -crop interface”, but should be best called “pruned tree-crop proximity effect” because of the lack of an actual hedge.
In agroforestry experiments, when several rows of one species (“A”) are grown between rows of another species (“B”), plants of species A experience more intense competition than (or benefit most from) those of species B, the closer the rows of species A are to the rows of species B and vice versa. In this study, this difference in behavior is called “tree-crop proximity effect”, an effect akin to the border effect, which is the difference in behavior between the inner and outer plants of a plot. In English, this proximity effect is sometimes called a “tree-crop interface” (SINGH et al., 2012;
UDAWATTA et al., 2014). In Portuguese, the word “interface” can mean a surface that separates two phases of a system. Thus, the word interface does not seem suitable for describing an effect that may extend beyond the limits of the closest two rows of species A and B. A greater proximity of pruned (alley cropping) or unpruned (taungya system) trees may increase (MARIN et al., 2006), decrease (KIDANU et al., 2005), or not affect (LEITE et al., 2009) the yield of annual crops. Changes in yield of annual crops depend on the tree species (MANCEUR et al., 2009; SALAZAR et al., 1993), on the annual crop species (KIDANU et al., 2005), and on various environmental factors, including distances from the tree-crop interface, plant spacing, and fertilizer type and rate (KIDANU et al., 2005; MARIN et al., 2007; PRASAD et al., 2010).
In this study, the proximity effects of two arboreal legume species, Mimosa caesalpiniifolia
Benth. (sabiá) and Gliricidia sepium (Jacq.) Kunth ex Walp. (gliricidia), on green ear and corn grain yields, were compared under taungya and alley agroforestry systems.
MATERIAL AND METHODS
The experiment was conducted in 2010 and 2011 at the "Rafael Fernandes" Experimental Farm (5°03’S, 37°24’ W, 87 m elevation), of the Universidade Federal Rural do Semi-Árido (UFERSA), 20 km away from the city of Mossoró, in the state of Rio Grande do Norte (RN), Brazil. The climate in the region is hot semi-arid (BSwh), according to the Köppen classification, with most of the rainfall in autumn. The average maximum temperature in the region ranges from 32.1 to 34.5 ° C, with June and July the coldest months, and an average annual rainfall of 825 mm (CARMO FILHO; OLIVEIRA, 1989). The soil wasclassified as red-yellow argisol according to the Brazilian System of Soil Classification (EMBRAPA, 2006) and as ferric lixisol according to the Soil Map of the World (FAO, 1988). Soil properties, from the analysis of a sample from the experimental area, were: pH = 7.6; Ca = 2.2 cmolc L-1; Mg = 0.0 cmolc
L-1; K = 223.1 mg L-1; Na = 99.7 mg L-1; Al = 0.00
cmolc L-1; P = 22.6 mg L-1; and organic matter =
15.86 g kg-1.
Taungya system (first year)
Rev. Caatinga
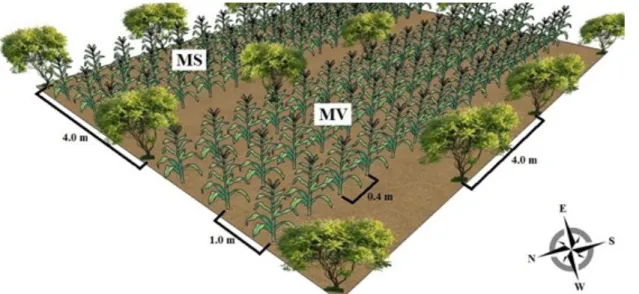
sowing, tree seedlings were transplanted to an area previously cultivated with corn, into 20 cm x 20 cm x 20 cm holes, in unfertilized three-row plots, each with four plants spaced 4.0 m apart (equivalent to a density of 625 plants ha-1). Corn seeds were sown in
three rows, between every two rows of trees (Figure 1). A randomised block design was used with split-plots and five replications. The two intercrops were considered as being applied to the plots, and the corn rows to the subplots.
Corn seeds of cultivar AG 1051 were sown on
May 18, 2010 at four seeds hole-1. At 20 days after
sowing (DAS), the plants were thinned, leaving two plants per hole. After thinning, the planting density for corn was 37,500 plants ha-1. Before sowing, 40
kg N ha-1 (ammonium sulphate), 60 kg P
2O5 ha-1
(single superphosphate), and 30 kg K2O ha-1
(potassium chloride) were applied in grooves adjacent to and below the seeding rows. The remaining nitrogen (80 kg N ha-1) was applied in
equal amounts at two different times after each weeding.
Figure 1. Schematic representation of a plot with corn intercropped with an arboreal species (MS = corn plants evaluated for grain yield; MV = corn plants evaluated for green ear yield). The numbers indicate the spacing between plants.
The experiment was conducted under rainfed conditions, but the plants received sprinkler irrigation when needed. The experimental plots were arranged parallel to the sprinkler lines. The depth of water required daily by corn (5.6 mm) was calculated taking 0.40 m as the effective depth of the root system, the time of irrigation was based on the water retained in the soil at a tension of 0.40 Mpa, and irrigation interval was two days with three weekly applications. Irrigation was started after planting and suspended 15 days before harvesting of dry corn.
The armyworm Spodoptera frugiperda
(Smith), the major pest of corn in the region, was controlled by spraying Lannat BR (600 ml ha-1) and
Rimon 100 EC (150 ml ha-1) at 14 and 30 DAS,
respectively, for each product. Weeds were controlled by hoeing at 20 and 40 DAS.
Plant height and crown diameter were measured from the two usable trees in each plot at the time of transplant and in each month thereafter. Plant height was measured from ground level to the highest part of the tree, whereas crown diameter was estimated as the average of two perpendicular measurements, one of which parallel to the row.
Yield, plant height, and ear insertion height were estimated for green corn and grain (dried corn).
One of the two sets of three rows of corn was randomly assigned for evaluation of green corn yield, and the other for the evaluation of grain yield and its components. Each of the three rows was harvested separately to evaluate the proximity effect of the trees on the corn. Green corn was harvested at 73, 76, and 79 DAS, and green corn yield was evaluated by counting and weighing total and marketable ears with and without husk. Ears ≥ 23 cm in length, with husks with good appearance and no marks or signs of pests or disease and ears ≥ 18cm in length, without husks but with healthy grains were considered marketable. These dimensions were based on the size of green corn ears sold in the study region.
After harvest of green ears, plant height and ear height were measured in 26 plants (every plant in the plot). Plant height was measured from ground level to the point of insertion of the highest leaf and ear height was measured from ground level to the insertion node of the highest ear.
The number of mature ears ha-1 was estimated
was corrected for a moisture content of 15.5% (wet weight).
Alley system (second year)
On March 4, 2011, trees from plots cultivated in 2010 were cut down 0.5 m above ground level and their branches and leaves were spread evenly over the two areas between the three harvested gliricidia and sabiá rows. The material was added to the soil using a disc harrow followed by corn sowing. The variables evaluated were the same as those evaluated in the previous year. The experiment was conducted under rainfed conditions, but emergency irrigation was conducted on March 23, 2011 due to the uneven distribution of rainfall at the beginning of the experimental period.
Data on plant height and crown diameter of the tree species were measured as in a split-plot design and analyzed with analysis of variance (ANOVA) and regression analysis. Data from green corn and grain yields were analyzed with ANOVA and treatment means were compared with Tukey’s test at p < 0.05. Analysis of variance was performed
using the SISVAR software, version 5.3, from Universidade Federal de Lavras (FERREIRA, 2010) and regression analysis was performed using SigmaStat software (JANDEL SCIENTIFIC SOFTWARE, 1992).
RESULTS AND DISCUSSION
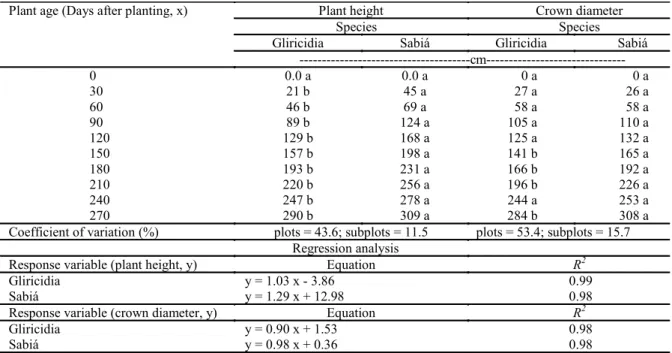
Taungya system (first year)Analysis of variance of tree heights indicated significant effects of species (S), plant age (P) and S x P interaction. Tree height was greater in sabiá than in gliricidia in all assessments from 30 days after planting (Table 1). The response of both crop species to plant age was linear (Table 1). The complete growth life cycle of the plants, i.e., from germination to senescence, could be described by sigmoidal curves. The linear response of forest species, in terms of tree height, may have been due to the short period (270 days) for evaluation of plant growth. Moreover, although a sigmoidal equation could have been fitted to the data, a linear equation was preferred because it is simpler and easier to interpret.
Table 1. Mean plant height and crown diameter of sabiá and gliricidia trees as a function of plant age in the intercropping with corn.1
Plant age (Days after planting, x) Plant height Crown diameter
Species Species
Gliricidia Sabiá Gliricidia Sabiá
---cm---
0 0.0 a 0.0 a 0 a 0 a
30 21 b 45 a 27 a 26 a
60 46 b 69 a 58 a 58 a
90 89 b 124 a 105 a 110 a
120 129 b 168 a 125 a 132 a
150 157 b 198 a 141 b 165 a
180 193 b 231 a 166 b 192 a
210 220 b 256 a 196 b 226 a
240 247 b 278 a 244 a 253 a
270 290 b 309 a 284 b 308 a
Coefficient of variation (%) plots = 43.6; subplots = 11.5 plots = 53.4; subplots = 15.7
Regression analysis
Response variable (plant height, y) Equation R2
Gliricidia y = 1.03 x - 3.86 0.99
Sabiá y = 1.29 x + 12.98 0.98
Response variable (crown diameter, y) Equation R2
Gliricidia y = 0.90 x + 1.53 0.98
Sabiá y = 0.98 x + 0.36 0.98
1Means followed by the same letter in a row are not significantly different by the Tukey’s test (p > 0.05). The regression
equation parameters are significant at p < 0.05 by the Student’s t-test.
Analysis of variance of crown diameters indicated effects of species (S), plant age (P) and S x P interaction. Crown diameters were larger for sabiá than for gliricidia in the last five evaluations, except at 240 days after planting, when no difference was observed between the species (Table 1). Crown diameters were not different between sabiá and gliricidia plants in the other assessments. The response of sabiá and gliricidia plants to plant age
was linear (Table 1). In general, plant growth was described by sigmoidal curves and the linear growth of crown diameter in sabiá and gliricidia plants may have been due to the short experimental period (270 days).
Rev. Caatinga
viewed as an integral component of the process of competition. This resource-independent response precedes and conditions the crop seedling for the onset of resource-dependent competition (PAGE et al., 2010). Plant responses to avoid competition for light include producing low root/aerial part ratios, thinner stems, and strong apical dominance with low branching intensity, characteristics that favor stem height growth that enable plants to grow above neighboring plant branches (KEGGE; PIERIK, 2009). For example, increases in plant density reduce branch size, increase lower branch mortality, cause branches to angle more acutely, and reduce stem diameter (ALCORN et al., 2007). The response of a plant to avoid shading by neighboring plants is initiated by the low red/far-red ratio (R/FR) of the nearby vegetation reflected light (BALLARE, 1999). There is also evidence of changes in biogenic volatile compound emissions produced by plants with neighboring plants, which can act as allelochemicals or as detection signals of neighboring plants (KEGGE; PIERIK, 2009).
Corn characteristics were unaffected by either
the tree species or the interaction between row position and tree species, for the cropping systems studied. Accordingly, only the mean values of the corn characteristics are presented. Thus, differences in plant height and crown diameter (Table 1) between the tree species, when they occurred, did not result in differences in corn characteristics (Tables 2 to 4). We did not compare root system characteristics between trees of the two species but, if there were any differences, they had no effect on corn variables. Likely, as age increases the differences between above- and belowground characteristics of the tree species may become more marked, thus affecting corn characteristics.
Plant and ear height were greater in the left and middle rows than in the right rows (Table 2). Similarly, husked green ear yield was significantly higher in plants from left rows (L) than in plants from right rows (R), whereas plants from middle rows (M) had an intermediate yield (Table 3). Grain yield in plants from middle rows was higher than that from side rows, i.e., rows that were closer to the leguminous trees (Table 4).
Table 2. Mean plant and ear insertion height at 75 days after sowing in corn cultivar AG 1051 grown in three rows between two rows of either Mimosa caesalpiniifolia or Gliricidia sepium under two agroforestry systems.1
1 For each variable in each year, means followed by the same letter are not significantly different by the Tukey’s test
(p > 0.05).
Alley system (second year)
In the alley system, as in the taungya system, plant height and ear height were greater in plants from the left and middle rows than in plants from the right rows (Table 2). Total green ear weight and total marketable green ear weight of both husked and unhusked ears, as well as the number of marketable husked ears, were significantly higher in left row plants than in middle and right row plants (Table 3). However, there was no effect of cropping system on grain yield and its components (Table 4).
In this study, corn row position had a significant effect on corn yield depending on harvest year and yield trait (Tables 3 and 4). Similarly, some
studies reported that a greater tree proximity may reduce (MARIN et al., 2007) corn yield in different rows, while others report no effect (LEITE et al., 2008). It was also observed that proximity effects depend on genotype (LEITE et al., 2008) and environmental factors, including the study year and type of organic fertilizer used (MARIN et al., 2006).
Plant height and ear insertion height (Table 2), and some green ear yield traits (marketable green ear weight in 2010, total green ear and marketable green ear weight of both husked and unhusked ears, and the number of marketable husked ears in 2011; Table 3) were significantly greater in left-row plants than in middle- and right-row plants. Since there is no reason to suppose that corn plants in the left rows
Treatment Plant height Ear height
--- cm ---
Taungya (2010) – trees at 105 days
Average for tree species 176 90
Corn row
Left 180 a 93 a
Middle 179 a 92 a
Right 168 b 85 b
Coefficient of variation (%) plots = 14.8; subplots = 2.7 plots = 19.6; subplots = 3.8
Alleys (2011) – trees cut down at 320 days
Averages for tree species 211 119
Corn row
Left 213 a 120 a
Middle 218 a 124 a
Right 203 b 113 b
suffered greater competition with the two legume species than corn plants from the right rows, the differences between rows in green ear yield traits must be associated with other environmental factors. The orientation of rows in relation to the sun, affecting the competition for light between plants, is one such effect, previously reported by Ding and Su (2010). The effects of row orientation on the yield of corn monocrops have been reported by several authors (KARLEN; KASPERBAUER, 1989; AKBAR; KHAN, 2002). Karlen and Kasperbauer (1989) found that rows planted in an east-west orientation had higher yields than those planted north -south in one year, but less in the following year, and the differences between years were attributed to differences in water deficit. According to those
authors, row orientation affects root and shoot development in corn. In agroforestry experiments, these effects have been demonstrated in a study with corn and Populus gansuensis C. H. Wang et L. Yang (DING; SU, 2010). In the current study, left rows may have received more solar radiation than middle rows, which in turn may have received more radiation than right rows. Left and right rows of corn were surrounded by leguminous plants (spaced 4.0 m apart) on one side and corn plants (spaced 0.4 m apart) on the other (Figure 1). Row orientation, however, may have allowed left rows to receive more light, resulting in more photosynthesis and greater plant height, ear insertion height, and greater weight of marketable husked ears.
Table3. Averages of green ear yield in the maize cultivar AG 1051, grown in three rows, between two rows of Mimosa caesalpiniifolia or Gliricidia sepium in two agroforestry systems.1
Treatments
Total ears ha-1 Marketable, unhusked ears
ha-1 Marketable, husked ears ha
-1
Tree species Number Weight (kg) Number Weight (kg) Number Weight
(kg) Year 2010: taungya (trees at 105 days)
Average 36.098 10.804 31.690 10.042 25.926 5.375
Maize Row
Left 36.326 a 11.257 a 32.445 a 10.568 a 26.879 a 5.736 a
Middle 36.221 a 10.924 a 31.706 a 10.193 a 26.709 a 5.662 ab
Right 35.748 a 10.232 a 30.918 a 9.365 a 24.190 a 4.728 b
Coefficient of variation (plots, %)
4.8 11.3 7.8 11.5 28.3 29.8
Coefficient of variation (subplots, %)
5.0 9.3 8.4 11.8 13.0 16.2
Year 2011: alleys (trees cut down at 320 days)
Average 36.913 9744 28.316 8.514 24.288 5.018
Maize Row
Left 37.433 a 10.596 a 29.894 a 9.323 a 25.746 a 5.520 a
Middle 36.317 a 9.468 ab 27.598 a 7.986 b 22.916 b 4.587 b
Right 36.988 a 9.168 b 27.454 a 8.233 b 24.021 ab 4.945 ab
Coefficient of variation (plots, %)
8.0 31.2 31.5 39.4 38.5 44.8
Coefficient of variation (subplots, %)
4.9 12.0 9.4 10.1 10.0 11.2
1For each characteristic, in each year, averages followed by the same letter do not differ between themselves at 0.05
Rev. Caatinga
The effects of row position on green ear yield traits (Table 3) were, however, different from the effects of row position on grain yield (Table 4). Several factors may explain these differences. First, competition of corn plants from the side rows with the leguminous plants may have intensified with the increased proximity of competing plants as their age increased. Green corn was harvested at 75 days, and dried corn 40 days later. During this period, plant height, canopy diameter (data not shown) of leguminous plants increased, and, very likely, their root systems as well. Second, green ears and dried grains are evaluated differently, especially when marketable husked ears are considered. Discarded green ears can be fully exploited when interest is directed to dry grains. Lastly, the sun path varies across the year. Even though green corn and dry grains were harvested with a difference of only 40 days, the variation in sun path during this period, combined with the former two aspects, can help explain the difference in the effects of row position on green corn yield and grain yield.
CONCLUSIONS
Plant height was greater in sabiá trees than in gliricidia trees. There was a linear relationship between plant age and plant height and between plant age and crown diameter for sabiá and gliricidia trees.
Under the taungya system, the weight of unhusked marketable green ears was higher in left rows than in middle and right rows, but grain yield was higher in middle rows.
Under alley cropping, green ear yield was higher in left rows than in middle and right rows, but
grain yield was not affected by row position.
There were no significant differences in green ear and dry corn yield for corn grown between sabiá or gliricidia plants in both agroforestry systems.
REFERENCES
AKBAR, M.; KHAN, M. I. Effect of row orientation on yield and yield components of corn. Pakistan Journal of Agricultural Research, Faisalabad, v. 17, n. 2, p. 186-189, 2002.
ALCORN, P. J. et al. Effects of initial planting density on branch development in 4-year-old plantation grown Eucalyptus pilularis and
Eucalyptus cloenziana trees. Forest Ecology and
Management, Amsterdam, v. 252, n. 1, p. 41-51, 2007.
ARAUJO, A. S. F. et al. Microbiological process in agroforestry systems. A review. Agronomy for Sustainable Development, Les Ulis, v. 32, n. 1, p. 215-226, 2012.
BALLARÉ, C. L. Keeping up with the neighbours: phytochrome sensing and other signaling mechanisms. Trends in plant science, Cambridge, v. 4, n. 3, p. 97-102, 1999.
CARMO FILHO, F.; OLIVEIRA, O. F. de. Mossoró: um município do semi-árido nordestino.
Mossoró: Fundação Guimarães Duque/ESAM, 1989. 62 p. (Coleção mossoroense, 672).
DING, S.; SU, P. Effects of three shading on corn crop within a poplar-corn compound system in Hexi
1For each variable in each year, means followed by the same letter are not significantly different by the Tukey’s test (p >
0.05).
Treatment Grain yield
(kg ha-1)
Number of ears ha-1
Number of grains ear-1
100-grain weight (g)
Tree species
Taungya (2010) – trees at 105 days
Mean 5.410 35.908 492 30.1
Corn row
Left 4.989 b 34.493 a 489 a 28.50 a
Middle 5.643 a 37.817 a 479 a 30.82 a
Right 5.596 ab 35.413 a 508 a 31.06 a
Coefficient of variation (plots, %) 32.4 18.3 5.6 17.0
Coefficient of variation (subplots, %) 10.3 8.1 5.9 8.3
Alleys (2011) – trees cut down at 320 days
Mean 3.562 38.111 499 21,.
Corn row
Left 3.546 a 39.043 a 500 a 21.5 a
Middle 3.487 a 36.781 a 492 a 22.2 a
Right 3.651 a 38.507 a 505 a 22.1 a
Coefficient of variation (plots, %) 34.3 5.2 10.9 16.3
Coefficient of variation (subplots, %) 7.1 6.4 5.7 8.6
Table 4. Mean grain yield and its components in the corn cultivar AG 1051 grown in three rows between two rows of either
Corridor oasis, northwestern China. Agroforestry Systems, New York, v. 80, n. 1, p. 117-129, 2010.
EMBRAPA, Empresa Brasileira de Pesquisa Agropecuária. Centro Nacional de Pesquisa do Solo. Sistema Brasileiro de classificação de solos. Brasília, DF: Serviço de Produção de Informação, 2006. 306 p.
FAO - Food and Agriculture Organization of the United Nations. Soil map of the world; revised legend. Rome: UNESCO, 1988. 119 p.
FERREIRA, D. F. SISVAR – programa estatístico. Versão 5.3 (Build 75). Lavras: Universidade Federal de Lavras, 2010.
JANDEL. Jandel TBLCURVE. Table Curve 3.0. Curve fitting software. Corte Madera: Jandel Scientific, 1992. 280 p.
KARLEN, D. L.; KASPERBAUER, M. J. Row orientation and configuration effects on canopy light spectra and corn growth. Applied Agricultural Research, New York, v. 4, n. 1, p. 51-56, 1989.
KEGGE, W.; PIERIK, R. Biogenic volatile organic compounds and plant competition. Trends in Plant Science, Cambridge, v. 15, n. 3, p. 126-132, 2009.
KIDANU, S.; MAMO, T.; STROOSNIJDER, L. Biomass production of Eucalyptus boundary plantations and their effect on crop productivity on Ethiopian highland Vertisols. Agroforestry Systems, New York, v. 63, n. 3, p. 281-290, 2005.
LEITE, A. A. L. et al. Comportamento de dois genótipos de milho cultivados em sistema de aléias preestabelecido com diferentes leguminosas arbóreas. Bragantia, Campinas, v. 67, n. 4, p. 875 -882, 2008.
MANCEUR, A. M. et al. Dry matter partitions and specific leaf weight of soybean change with tree competition in a intercropping system. Agroforestry Systems, New York, v. 76, n. 2, p. 295-301, 2009.
MARIN, A. M. P.; MENEZES, R. S. C.; SALCEDO, I. H. Produtividade de milho, solteiro ou em aleias de gliricídia adubado com duas fontes orgânicas. Pesquisa Agropecuária Brasileira, Brasília, v. 42, n. 5, p. 669-677, 2007.
MARIN, A. M. P. et al. Efeito da Gliricidia sepium
sobre nutrients do solo, microclima e produtividade do milho em sistema agroflorestal no Agreste Paraibano. Revista Brasileira de Ciência do Solo, Campinas, v. 30, n. 3, p. 555-564, 2006.
PAGE, E. R. et al. Shade avoidance: an integral
component of crop-weed competition. Weed Research, Doortwerth, v. 50, n. 4-5, p. 281-288, 2010.
PRASAD, J. V. N. S. et al. Tree row spacing affected agronomic and economic performance of
Eucalyptus-based agroforestry in Andhra Pradesh,
Southern India. Agroforestry Systems, New York, v. 78, n. 3, p. 253-267, 2010.
RONG, M.; DEHUI, Z. Research advances in plant competition in agroforestry systems. Zhongguo Shengtai Nongye Xuebao (Chinese Journal of Eco
-Agriculture), Pequin, v. 17, n. 2, p. 379-386, 2009.
SALAZAR, A.; SZOTT, L. T.; PALM, C. A. Crop-tree interactions in alley cropping systems on alluvial soils of the Upper Amazon Basin. Agroforestry Systems, New York, v. 22, n. 1, p. 67-82, 1993.
SCHROTH, G.; LEHMANN, J. Contrasting effects of roots and mulch from three agroforestry tree species on yields of alley cropped corn. Agriculture, Ecosystems and Environment, Amsterdam, v. 54, n. 1-2, p. 89-101, 1995.
SILVA, M. L. et al. Avaliação econômica de sistemas agroflorestais com eucalipto-arroz e eucalipto-feijão no município de Divinópolis – MG, Brasil. Revista Árvore, Viçosa, v. 25, n. 2, p. 209 -216, 2001.
SINGH, A. K. et al. Dynamics of tree-crop interface in relation to their influence on microclimatic changes - a review. HortFlora Research Spectrum, Meerut, v. 1, n. 3, p. 193-198, 2012.