A Quantitative Model for Decomposing & Assessing the
Value for the Customer
Susana Nicola1, Eduarda Pinto Ferreira1, J. J. Pinto Ferreira2
1 Instituto Superior de Engenharia do Porto, Instituto Politécnico do Porto, GECAD, Porto, Portugal
{sca, epf}@isep.ipp.pt
2 Universidade do Porto, Faculdade de Engenharia/DEIG, INESC TEC / UITT, Porto, Portugal [email protected]
Abstract. The research presented in this paper proposes a novel quantitative
model for decomposing and assessing the Value for the Customer. The proposed approach builds on the different dimensions of the Value Network analysis proposed by Verna Allee having as background the concept of Value for the Customer proposed by Woodall. In this context, the Value for the Customer is modelled as a relationship established between the exchanged deliverables and a combination of tangible and intangible assets projected into their endogenous or exogenous dimensions. The Value Network Analysis of the deliverables exchange enables an in-depth understanding of this frontier and the implicit modelling of co-creation scenarios. The proposed Conceptual Model for Decomposing Value for the Customer combines several concepts: from the marketing area we have the concept of Value for the Customer; from the area of intellectual capital the concept of Value Network Analysis; from the collaborative networks area we have the perspective of the enterprise life cycle and the endogenous and exogenous perspectives; at last, the proposed model is supported by a mathematical formal description that stems from the area of Multi-Criteria Decision Making. The whole concept is illustrated in the context of a case study of an enterprise in the footwear industry (Pontechem). The merits of this approach seem evident from the contact with Pontechem as it provides a structured approach for the enterprises to assess the adequacy of their value proposition to the client/customer needs and how these relate to their endogenous and/or exogenous tangible or intangible assets. The proposed model, as a tool, may therefore be a useful instrument in supporting the commercialisation of new products and/or services.
Keywords: Value for the Customer, Value Proposition, Asset Management,
Fuzzy AHP.
1
Introduction
Delivering and creating value for the customers is the foundation of any business enterprise, in fact, value has been “the fundamental basis for all marketing activity” (Holbrook, 1994). The Marketing Science Institute (MSI) (Institute., 2010) included in its list of the research priorities, the development of marketing capabilities for a customer focused organization - “research is required to develop ways to identify, develop, and deliver compelling value propositions that incorporate customers as collaborators”. For the majority of current Industrial Marketing research concerned with value creation, the focus is on Value for the Customer. The reasoning behind such concentration is, according to MSI, the “need to get better sense of what is on their minds” and the “need to know the construction of insights into why people buy and used products or services”.
Knowledge about customer’s perceived value and “knowledge used to anticipate what customer will value in the future play central roles in building and maintaining a sustainable advantage” (Blocker and Flint, 2007). To this end, the challenge in many enterprises is to “develop an offering that is both flexible and capable of being tailored to fit the specific requirements of customers” (Rahikka et al., 2011). This is what the value proposition is about. The value proposition often displays in practice a one-sided enterprise perspective (Woodruff and Flint, 2006). However, the Value Proposition (VP) “is an overall view of a company's bundle of products and services that are of value to the customer.” (Osterwalder, 2004). It is also a fact that customers do not perceive the enterprise offers to be equally important from their own point of view. As some authors say, “the value proposition defines the specific strategy to compete for new customers” (Jalili and Rezaie, 2010). So it is essential to determine which factors determine the perception on Value for the Customer (VC) and how this value is perceived, involving what the customer receives (e.g. benefits) and what he gives up to acquire and use a product (e.g.: costs and sacrifices), (Flint et al., 2002, Lapierre, 2001, Ulaga, 2003, Komulainen et al., 2007). Following that line of thinking it is required to have a clear knowledge of the nature of the interactions between enterprise members, customers, and suppliers (Kowalkowski, 2011). With these issues in mind, the research presented in this paper proposes a novel quantitative model for decomposing and assessing the Value for the Customer. The proposed approach builds on the different dimensions of the Value Network analysis proposed by Verna Allee (Allee, 2008a) having as background the concept of Value for the Customer proposed by Tony Woodall (Woodall, 2003). In this context, the Value for the Customer is modelled as a relationship established between the exchanged deliverables and a combination of tangible and intangible assets projected into their endogenous or exogenous dimensions. The Value Network Analysis of the deliverables exchange, enables an in-depth understanding of this frontier and the implicit modelling of co-creation scenarios. The proposed Conceptual Model for Decomposing Value for the Customer combines several concepts: from the marketing area we have the concept of Value for the Customer; from the area of intellectual capital the concept of Value Network Analysis; from the collaborative networks area we have the perspective of the enterprise life cycle and the endogenous and exogenous perspectives; at last, the proposed model is supported by a mathematical formal description that stems from the area of Multi-Criteria Decision Making. In this context, the contribution of this research to the body of knowledge may be structured along the following dimensions: 1) a novel Conceptual Model for Decomposing Value for the Customer listing the relationships between the different components of the model; 2) an approach for using the Conceptual Model by reducing the burden tasks demanded from the enterprise customer; 3) a method for assessing and integrating of both the enterprise and the customer perspectives of the perceived value; 4) the supporting of Fuzzy AHP (Chen, 2004b, Ertuğrul and Karakaşoğlu, 2008, Nukala and Gupta, 2005) quantitative formulation for this multi-criteria decision making problem; at last, 5), the actual computational implementation of the quantitative model that was developed using PHP and a MySQL database.
The proposed model is presented in the forthcoming chapters and finally discussed in the context of a case study in the footwear industry in Portugal (APICCAPS, 2008). The next paragraph introduces the literature review on the concept of the Value for the Customer. Then, the three steps of the proposed method to assess and decompose the Value for the Customer are presented, followed by the research questions and an overview of the research methodology. The framework for describing and analyzing the value creation in the context of a case study is then presented. At last are discussed the managerial implications, the limitations of the study, the future research and the final conclusions are presented.
2
Value for the Customer
The concept of customer value is one of the most overused concepts in the literature and several definitions of customer value as perceived and defined by the customer have been offered, such as: “customer value” (Woodruff, 1997b, Anderson et al., 2006); “consumer value” (Lai, 1995); “customer perceived value” (Lapierre, 2000); “value for the customer” (Woodall, 2003). Woodall (2003), proposed a definition of these related customer concept of value, by choosing the term Value for the Customer (VC):
“Value for the customer (VC) is any demand-side, personal perception of advantage arising out of a customer’s association with an organisation’s offering, and can occur as reduction in sacrifice; presence of benefit (perceived as either attributes or outcomes); the resultant of any weighed combination of sacrifice and benefit; or an aggregation, over time, of any or all these”, (Woodall, 2003 p.2)
Over many years much work has been made and discussed in the literature on the concept on Value for the Customer. Zeithmal has suggested customer perceived value as “what they get benefits relative to what they have to give up” (cost or sacrifices) (Zeithaml, 1988). Lay has suggested a framework for customer value focuses on the buyer’s evaluation of product purchase at the time of buying, integrating cultural value, personal values, consumption values and product benefits (Lai, 1995). Huber believed that benefits and costs are defined in terms of consumer’s perceptions in the activities of acquisition, consumption and maintenance (Huber et al., 1997). Flint creates a model to describe how customers’ perceptions of value change over time in industrial supply relationship. This model focuses in three forms of value: values, desired value and value judgment (Flint et al., 1997). Woodruff defines customer value as “a customer’s perceived preference for and evaluation of those product attributes, attribute performances and consequences arising from use that facilitate achieving the customer’s goals and purposes in use situations” (Woodruff, 1997). This author develops a model to customer value oriented marketing information system (CVOMIS). In industrial context, Lapierre develop a scale to measure customer perceived value: called the “key drivers” - benefits and sacrifices (Lapierre, 2000). Also emphasized that customer perceived value can be defined as the “difference between the benefits and sacrifices perceived by the customers in response to their expectations, that is their needs and wants” (Lapierre, 2001). Simpson created a framework for supplier market-orientation, where market orientated behaviours are conceptualized (Simpson et al., 2001). The authors (Kothandaraman and Wilson, 2001) had developed a model based on three concepts of value creation: superior customer value, core capabilities and relationship. Woodall has developed a framework for Value for the a longitudinal perspective and different forms of value, (Woodall, 2003). Ulaga developed a model for buyer-seller relationship and integrate the relationship value into the network relationship marketing, (Ulaga and Eggert, 2006). Smith and Colgate adopt the term customer value and define this term “as a summative or ratio based evaluation or whether it is made with compensatory or non-compensatory rules”. These authors had presented a conceptual framework for marketers incorporating four major types of value that can be created by the organization and five major sources value (Smith and Colgate, 2007).
Two theories have been developed by Vargo & Lusch (2004) and by Gönroos (2008) to assess exchange. They combine the value-in-exchange and value-in-use based on the service perspective. The “service logic” within marketing identified by (Grönroos, 2008) makes explicit the value creation that emerges from the interaction between enterprise and customer. This theory has a two-sided perspective. On the
firms role we have the value creation process, and sometimes under certain circumstances the enterprise has the opportunity to create value together with the customer that becomes a co-creator of value. In the “service dominant logic” identified by (Vargo and Lusch, 2004), the service is the fundamental base of exchange. This point of view is based on the definition of service “the process of using one’s competences (knowledge and skills) for the benefits of the other party” (Vargo and Lusch, 2004 p374). These authors viewed the customer’s as co-creators of value:
”the value creation is always a collaborative and interactive process that takes place in the context of a unique set of multiple exchange relationship, when service is provided though goods” (Vargo and Lusch, 2004 p372).
“The determination of value in the process of exchange remains an important component of value creation” (Kowalkowski, 2011). In order to understand the enterprise capability to create value one should go beyond the individual enterprise examine the value creation network formed by the key enterprises in the value chain and how that delivers value to the end customer. “The value network defines the reality of the business network” (Kothandaraman and Wilson, 2001). In this context it should be further understood that the “dynamics of value conversion requires expanding beyond the asset view of intangibles to understand the function of intangibles as negotiable goods and as deliverables” (Allee, 2008a). According to Allee value is “(...) an emergent property of the network, so, understanding the functioning of the network as a whole is essential to understand how and why value is created. (...)” (Allee, 2008a).
According to this literature review, it is clear that the concept of value has been defined in many theoretical contexts by focusing for example in “beliefs, competitive advantage, goal attainment, preferences and attitudes”, and this suggests that value may be a “multi-dimensional construct that merits multiple measurement approaches” (Hogan, 2001).
The research presented in this work builds on the different dimensions of the value creation analysis proposed by (Allee, 2008a), comprising the asset utilization, value conversion, value enhancements, the transaction’s perceived value and the social value. These constructs, used to model the value creation analysis, enable the implicit modelling of the “service logic” concept proposed by (Grönroos, 2008), however, this paper will not explicitly tackle this topic. The authors are therefore not only aware of the value co-creation but also that different customer segments will have different perceived values for offer (Ulaga and Eggert, 2006). The same way, members of the organization involved in the sales activities will have different perceptions of the perceived value of enterprise offer. Time also has a direct impact in the perceived value, from the pre-purchase to the post-purchase phases (Woodall, 2003, Huber et al., 1997). This approach provides the means to explain how customers perceived the value of the exchanged deliverables (both tangible and intangible) implied the product/service and how these are related to the enterprise endogenous/exogenous assets, and helps the firm formulate a clear statement of its VP in contrast with its competitors.
3
Research Questions and Methodology
3.1 Design Science Approach and Research Questions
Along this project we followed the Design Science approach (Hevner et al., 2004) to the development of the proposed model. This approach enabled the identification of an adequate match between the business need and the literature gap (Nicola et al.,
2010, Nicola et al., 2012). The validation followed the Case Study approach with an early exploratory case study that enabled the early design and assessment of the following research questions, having as background the definition of Value for the Customer proposed by (Woodall, 2003):
1. How can the Value for the Customer be modelled on top of the organization endogenous and exogenous assets?
1.1 How is this value built on top of assets endogenous and exogenous to the organization?
1.2 How do endogenous and exogenous assets influence the Value for the Customer?
2. Can we derive a formal mathematical model that provides for the quantitative handling of the proposed model?
According to the article of Dubé and Paré (2003), the “key criteria for the appropriate use of the case study method is the type of the research questions posed”. The work of (Eisenhardt and Graebner, 2007) argue that cases studies typically answers to the “research questions that address ‘how’ and ‘why’ in unexplored research areas”, helping researchers to clarify why the research questions are significant. Furthermore “in-depth case investigations open the way to new ideas and new lines of reasoning” (Dubé and Paré, 2003). In this context, we use the case study approach, as useful tool, to develop new insights and to support deeper and more detailed investigation that is necessary to answer the research questions. This also means that literature review is a continuous process that also helps paving the way to the building of “informed arguments” in the support of research results (Hevner et al., 2004).
3.2 Methodology
Case Study Selection
This paper consolidates the previous research in two other case studies by bringing a third case to the discussion. All cases were made in SMEs in Portugal in three different sectors, one in the sector of Occupational Safety and Health Services, the other Textile Industry sector, and the one discussed in this paper in the Footwear Industry sector. It has been clear that Portugal is facing one of the worsening employment crises. Increasingly, attention has turned to the micro-enterprises sector as a provider of employment. According to Eurostat 5% percent of microenterprises in European Union (EU) are located in Portugal, where they represent 95.4 percent of the sector of Small and Medium Enterprises and employ 41% of workers. According to data from the statistics office of the EU, the share of the sector of Small and Medium Enterprises (SMEs) in employment is in Portugal, 80.9 percent and 66.9 percent in the EU. "Microenterprises are much more dominant in the SME sector in Portugal than in almost all other Member States," reads the study on the essential contribution of the same for job creation presented by the European Commission (EC) (Lusa, 2012). Also, according to the National Statistics Institute, in 2011, “84.7% of non-financial corporations were microenterprises, while medium-sized firms accounted for 2% and large companies were only 0.4% of the total" (Santos, 2014). The enterprise where we are conducting this case study is, therefore representative of an important group of microenterprise for the Portuguese Economy. The case study was conducted in the footwear industry, that has been the largest contributor to the external accounts since it is the sector with the largest trade surplus, revealed the database in Bank of Portugal (BdP 2012). The year of 2012 (BdP 2012) exceeded 1,3 billion euros in international sales (more than in 2011) and is expected to growth in 2013 with the strategy of the entrance in new markets such as United States, China and Chorea (Santos Pereira, 2013). Pontechem is an import/export enterprise with more than 20 years of experience. They are suppliers to
the footwear industry. In response to the customer needs they realized they had look for new products to offer their clients and became suppliers of other companies namely for the leather goods section, decoration, clothing and accessories. Pontechem key partners are the Company A, producing synthetic fabrics for various applications with a great capacity for innovation and adaptation on the growing market demand. At this moment, they have also as a key partnership a representation of prefabricated soles (Company B). Company A and B are aliases for existing companies that the authors are not allowed to disclose.
Approach to data collection and processing
Two personal semi-structured recorded interviews of two enterprise members were conducted, the Pontechem CEO, which is also the owner and the responsible of the synthetic-fabrics leather and soles sales department, and the person responsible for the Purchasing/Sales and Operations Planning (Figure 5). There was also one important meeting with the Pontechem CEO to position and clarify the research objectives and to provide a detailed explanation of the on-going research. Right after the interviews and after an in-depth analysis of the recorded interview, a first version of the Pontechem Value Network (PVN) was made. Figure 5 illustrates this value network identifying roles and exchanged deliverables, both tangible and intangible. Both interviewees were later asked to analyze the PVN and, together with the research team, improve and validate it. In the analysis of the case study the so-called Business Narrative Modelling Language (BNML) (Oliveira and Pinto Ferreira, 2011) was applied. The motivation for narrative analysis stems from the fact that “people use narratives to order their experience as they make sense of it.” (Rhodes and Brown, 2005).The Narrative Analysis allows the analyst to understand and discover the intervening characters, the related facts and place of action, assisted by the plot structure given by the way how things were done and the time line of the occurred facts (Pentland, 1999, Costa and Ferreira, 2012). This was the motivation for the development of BNML (Oliveira and Pinto Ferreira, 2011).
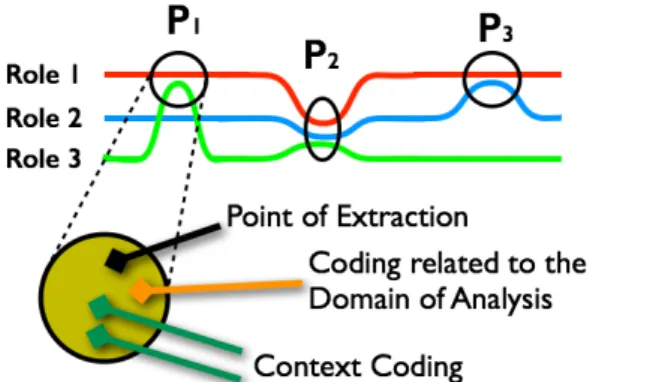
Fig. 1. The BNML Approach to Narrative Analysis
The BNML approach, illustrated in Figure 1 builds on semi-structured interviews from where we identify the so-called Points of Extraction. These are chunks of text that define a relevant segment of the story. The coding of each point of extraction involves two components: 1) the coding of the domain of analysis where we use keywords from existing Ontologies/Taxonomies provided by frameworks such as ARCON and authors such as (Woodall, 2003) and (Lapierre, 2001); 2) the coding of the business context where we use the "Business Model Ontology" (Osterwalder and Pigneur, 2010) and "Enterprise Ontology" (Uschold et al., 1998). The interview was segmented into different Points of Extraction, each modelled as one (or more) Microsoft Excel line establishing the relationship among the different terms of
coding scheme for both context and domain of analysis. Each line also includes text from the interview, thus providing the evidence that supports the rationale for those relationships. These terms are then connected and the Excel worksheet is then further processed using “pivot tables” in order to extract the desired perspectives on the data model. Further processing transforms these relationships into graphs using Graphviz (http://www.graphviz.org). The whole process is automated using excel macros, pivot tables and the open source Graphviz software. The final result is the visualization of graphs picturing the relationships among the keywords in the coding scheme for a particular context. This analysis was made for an Ex-Ante Phase (Pre-purchase phase).
4
A Conceptual Model for Decomposing Value for the
Customer
The proposed Conceptual Model for Decomposing Value for the Customer builds on the combination of the following concepts: 1) the concept of Forms of value and Value temporal positions (Woodall, 2003); 2) the concept of Value Network and on the network exchange of tangible and intangible deliverables among the network roles, building on both tangible and intangible enterprise assets (Allee, 2000b, Allee, 2000a, Allee, 2002b), Allee, 2002a), Allee, 2008a); 3) the concept of Enterprise Endogenous and Exogenous assets, extracted from the Reference Model for
Collaborative Network Organizations (ARCON) (Camarinha-Matos and
Afasarmanesh, 2008b, Camarinha-Matos and Afasarmanesh, 2008a); and at last 4) on the concept of Perceived Benefits(PBi)/Sacrifices (PSi) (Lapierre, 2000, Lapierre, 2001, Woodall, 2003). The combination of these perspectives in the proposed Conceptual Model for Decomposing Value for the Customer, are then formalized in a quantitative model that uses techniques that stem from the area Multi-Criteria Decision Making. The concept of triangular fuzzy numbers was further introduced in the model in order to handle the implied uncertainty and subjectivity of the assessed perceptions. The following three pictures illustrate the proposed model and its usage as a sequence of three steps towards the final assessment of the enterprise Value Proposition (VP) and how this VP is supported by enterprise tangible and intangible Assets (endogenous/exogenous).
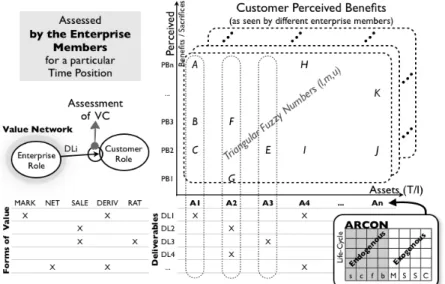
STEP 1: Figure 2 pictures the first step. The objective is to understand how value for the customer could be broken down into simpler constituents, integrating the value perceived by the enterprise members for a particular time position. The construction of the enterprise Value Network (through an interview with enterprise members), provides the identification of each tangible and intangible deliverable (DL) exchanged with the customer, as well as the assets (endogenous and exogenous) built and/or used in the provision of that deliverable. This analysis further relates each deliverable (DL) with the forms of value. Some authors (De Toni and Tonchia, 2003) argue for a need to integrate the traditional “outside-in (which analyses the source of competitive analysis outside the enterprise)” and “inside-out (which analyses the source of competitive analysis inside the enterprise)” views of the enterprise into a competence theory. In this context we apply the concepts proposed by the Reference Model for Collaborative Organizations, to classify the assets built and/or used as endogenous or exogenous to the enterprise.
Fig. 2. Customer Perceived Value assessed by the Enterprise Members for a particular Time
Position
The proposed model, at this stage, pictures the perspective of the enterprise members. This shows: 1) how does the people inside the enterprise perceive the relative relevance of the assets involved in the process; and 2) how these assets relate to the Perceived Benefits (PBi)/Sacrifices (PSi) using the Saaty’s scale (Saaty, 1990). These two components are modeled as a comparison matrix of the triangular fuzzy numbers resulting from: i) each enterprise member assesses each asset relative relevance; and ii) assesses the relevance of each asset to each Perceived Benefit (PBi)/ Sacrifice (PSi). The combination of these comparison matrixes provides the input to a process that leads to the construction of the final matrix where we will be able to extract the most relevant assets and Perceived Benefits and Sacrifices.
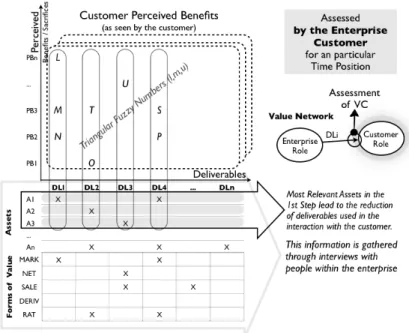
STEP 2: In the 2nd step of this process, Figure 3, the objective is to obtain further
information from the enterprise client/customer for a particular Time Position and regarding his perception of benefits and sacrifices. In this step and following the conclusions of the previous analysis, one takes the most relevant assets to select which deliverables will be used to assess how the customer perceives the enterprise value proposition. This step is taken in order to reduce the burden on the customer on the number of comparison tables that he/she will have to fill. However, and to ensure that we do not eliminate any relevant deliverable, a brief interview with the customer helps ensuring that we get the most relevant set of deliverables analyzed. In this step, the customer assesses the relevance of each deliverable to each PBi/PSi using the Saaty’s scale (Saaty, 1990).
Fig. 3. Customer Perceived Value assessed by the Enterprise Customers for a particular Time
Position
STEP 3: Figure 4 pictures the last step of the assessment of the enterprise Value Proposition and of its supporting assets. This analysis combines the two described streams, the Enterprise perspective on the left and the Customer perspective on right. Let us analyze each of the steps in more detail in the following paragraphs.
The Enterprise Perspective (1st Step)
For the enterprise we have a several and conflicting criteria (Assets and Deliverables) and alternatives (Perceived Benefits/Sacrifices) where an assessment is not easily determined. The input information containing the enterprise members’ subjective judgements relating criteria and alternatives, is uncertain and imprecise. In this context, the fuzzy theory is usually applied to handle uncertain and subjective problems in the decision-making process. Therefore we apply the fuzzy Analytical Hierarchical Process (AHP) to solve this multi-criteria decision-making (MCDM) problem (Chen, 2004b, Chen et al., 2005, Deng, 1999, Fu et al., 2007). The process unfolds as follows. Each enterprise member is performs an individual pair-wise comparison using the Saaty’s scale. Then a comprehensive pair-wise comparison
matrix (eq. 3) is built by integrating the enterprise member’s grades (𝑏!"#) through
the equations (1-2) (Chen, 2004a), where enterprise members pair-wise comparison value is transformed into triangular fuzzy numbers.
𝑙!"= 𝑚𝑖𝑛 𝑏!"# , 𝑚!"= 𝑏!"# ! !!! 𝑝 , 𝑢!"= 𝑚𝑎𝑥 𝑏!"# , 𝑝 = 1,2, … , 𝑡; 𝑗 = 1,2, … , 𝑚; 𝑒 = 1,2, … , 𝑚 (1) 𝑏!"= 𝑙!"; 𝑚!"; 𝑢!" , 𝑗 = 1,2, … , 𝑚; 𝑒 = 1,2, … , 𝑚 (2) Then we apply the approach of Chang (Chang, 1996) for handling fuzzy AHP, by using the “extent analysis method” for the synthetic extent values, which derives crisp weights for fuzzy comparison matrix. Consider a triangular fuzzy comparison matrix (eq.3) obtained by the steps of Chen (2004):
𝐷!= 𝑏!" !×!= 𝑏!! 𝑏!" ⋯ 𝑏!! 𝑏!" 𝑏!! ⋯ 𝑏!! ⋮ ⋮ ⋱ ⋮ 𝑏!! 𝑏!! ⋯ 𝑏!! = 1,1,1 𝑙!", 𝑚!", 𝑢!" ⋯ 𝑙!!, 𝑚!!, 𝑢!! 𝑙!", 𝑚!", 𝑢!" 1,1,1 ⋯ 𝑙!!, 𝑚!!, 𝑢!! ⋮ ⋮ ⋱ ⋮ 𝑙!!, 𝑚!!, 𝑢!! 𝑙!!, 𝑚!!, 𝑢!! ⋯ 1,1,1 (3)
where
𝑏!"
=
𝑙!", 𝑚!", 𝑢!" = 𝑏!"!!= !!!",!!!",!!!" for 𝑖, 𝑗 = 1, … . , 𝑛 and 𝑖 ≠ 𝑗.To calculate a priority vector of the above triangular fuzzy comparison matrix 𝐷! ,
the steps of Chang’s extent analysis can be given as in the following:
1) First, sum up each row of the fuzzy comparison matrix 𝐷!, by applying the fuzzy
arithmetic operations: 𝑏!"= 𝑙!" ! !!! , 𝑚!" ! !!! , 𝑢!" ! !!! ! !!! , 𝑖, 𝑗 = 1,2, … , 𝑛 (4)
𝑏!" ! !!! !! = 1/ 𝑢!" ! !!! , 1/ 𝑚!" ! !!! , 1/ 𝑙!" ! !!! (5) 2) Second we normalize the rows sums (eq.5) by:
𝑆
!=
𝑏𝑖𝑗× 𝑏𝑖𝑗 𝑛 𝑗=1 −1 ! !!! (6)3) Third, compute the degree of possibility for 𝑆!≥ 𝑆! of two TFNs 𝑆!= 𝑙!, 𝑚!, 𝑢!
and 𝑆! = 𝑙!, 𝑚!, 𝑢! by the following equation (7):
𝑉 𝑆!≥ 𝑆! = 1, 𝑖𝑓 𝑚!≥ 𝑚! 0, 𝑖𝑓 𝑙!≥ 𝑢! 𝑙!− 𝑢! 𝑚!− 𝑢! − 𝑚!− 𝑙! , 𝑜𝑡ℎ𝑒𝑟𝑤𝑖𝑠𝑒 (7)
a) In general, the priority weights are calculated by using the equation 8:
𝑑′ 𝐴! = 𝑚𝑖𝑛 𝑉 𝑆!≥ 𝑆! 𝑘 = 1,2, … , 𝑛; 𝑘 ≠ 𝑖 (8)
are the pair wise comparison of the 𝑆 TFNs.
b) Then the weight vector is given by the equation 9:
𝑊′= 𝑑′ 𝐴
! ; 𝑑′ 𝐴! ; … ; 𝑑′ 𝐴!
! (9)
c) Finally we normalized the weight vector (eq.10)
𝑊 = 𝑑 𝐴!; 𝑑 𝐴!; … ; 𝑑 𝐴! ! (10)
where W is a non-fuzzy number.
By applying the fuzzy AHP method we obtain a matrix of overall results of the enterprise member perception of the relevant assets and the relevant PBi/PSi.
The Customer Perspective (2nd Step)
To obtain the matrix of the overall results for the enterprise customer perception relating relevant deliverables as well as the relevant PBi/PSi, the customer will have to make their pair-wise comparison using the Saaty’s scale for the deliverables and for the perceived benefits and sacrifices. We then transform the customer perceptions using the Saaty’s scale, by converting them into triangular fuzzy numbers using a comparison scale (Herrera Umaña and Osorio Gómez, 2006). As we have the comprehensive pair-wise comparison matrix (eq.1-2), we applied the “extent analysis method” for the synthetic extent values (eq.4-10).
Integrating the two Perspectives (3rd Step)
With these two matrixes we have the degree of priority one criterion or alternative against all others in a fuzzy comparison matrix, (Wang et al., 2008). On the left we have the degree of priority (relevance) as seen by the enterprise of an Asset and its relation to a PBi/PSi, whereas on the right we have the degree of priority (relevance) as seen by the customer of deliverable and its relation to a PBi/PSi. The relationship between the assets and the deliverables is known, which means that one now should
be able to understand how the enterprise assets (endogenous or exogenous) relate to PBi/PSi, thus enabling the tuning of the enterprise offer Value Proposition.
4.1 Applying the Conceptual Model Decomposing Value for the Customer in the
footwear industry
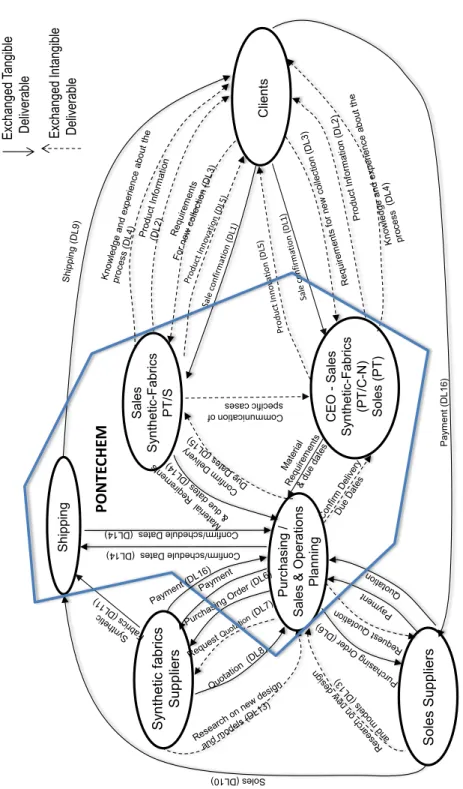
Figure 5 shows the outcome of a value network analysis performed at Pontechem, picturing roles or actors in the value network, including the four functional departments, as well as other two external entities (suppliers). The dashed lines show that an intangible deliverable has been exchanged (e.g “Requirements for new collection” (DL3) and “Product Information” (DL2) whereas the solid lines show the tangible deliverable exchanges (such as payment, sale confirmation)) (Allee, 2008a). This study will focus on four roles:
• The Pontechem CEO is responsible for the role Sales Synthetic-Fabrics PT/N
and Soles (PT). This role assures the sales fabric and synthetic leather in north and centre of Portugal and also soles for the whole country. He creates the environment in which the client decides to buy, in learning what people want and need trying to persuade them to buy. In this context, the information about their products (“Product Information” – DL2) is critical to their client, and must clearly identify the diversity and specifications of their raw material, as well as their certifications and the minimum quantities of the product the client could acquire. This role also comprises the continuous search on “Products Innovation” (DL5) among both current and potential suppliers. This involves the participation in fairs, visits to suppliers, understanding fashion trends and reporting the “Requirements for new collections” (DL3). In their sales and promotion activities they build on with their “Knowledge and experience about the process” (DL4) provided by their suppliers and also on many years of experience in this market.
• The Sales Synthetic-Fabrics PT/S develops the same activities as above (except
for the soles) in centre and south of Portugal.
• The Shipping role is responsible for managing the delivery of Synthetic-Fabrics
and Soles to the clients. Soles are in fact shipped directly from the producer, whereas the Synthetic-Fabrics and received by Pontechem and then shipped to the clients.
• The Purchasing/Sales & Operations Planning role is responsible for the financial
area and the management of daily operations between suppliers and clients, namely:
a) Acquiring material from suppliers, by requesting: “Quotation” (DL7), “Purchasing Order” (DL6);
b) “Material requirements & due dates” (DL14) as well their confirmation (“Confirm Delivery due dates” (DL15)), ensuring the clients’ orders will be shipped right on time;
c) “Payment” (DL16) for the suppliers;
d) Receiving from the suppliers’ new designs and models for both Sales Synthetic-Fabrics and Soles: “Research on new design and models” (DL13).
Fi g . 5 . Po n te ch em V al u e N et w o rk P urchasi ng / S al es & O pe ratio ns P lan ni ng CE O -S al es S ynthet ic -Fa brics (P T /C -N) S ol es ( P T ) S al es S ynthet ic -Fa brics PT /S C lien ts S yn th e tic fa b rics S u p p lie rs S o les S u p p lie rs Soles (D L10 ) Com mu nic ation of spe cific ca ses Pa ym en t ( D L1 6) Con firm /sc hed ule Dat es (D L14 ) S hi pp ing
PON
TE
CHEM
Exch an ge d Ta ng ible Deliverab le Exch an ge d In ta ng ible Deliverab le Con firm /sc hed ule Dat es (D L14 )4.2 Value for the Customer vs. Endogenous and Exogenous Assets
In this paragraph we discuss fundamentally the first research question:
1. How can the Value for the Customer be modeled on top of the organization endogenous and exogenous assets?
1.1 How is this value built on top of assets endogenous and exogenous to the organization?
1.2 How do endogenous and exogenous assets influence the Value for the Customer?
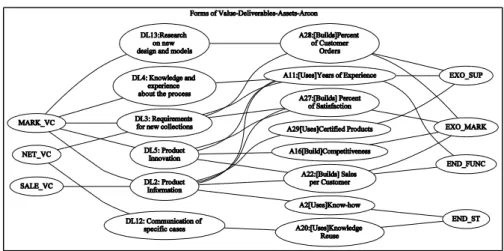
The analysis of this research questions, will enable the assessment that the relationships that we have proposed in our model are verified and confirmed in real world. We limited the discussion at a particular time position, an Ex-Ante phase, corresponding to the period before the handing of the contract proposal to the customer, as it relates to the perceived Value for the Customer “whenever they contemplate the purchase” (Woodall 2003, p10). In an Ex-Ante (EXA_VC) value temporal position, the customer will make some judgments and predictions to maximize the value of the product/service to be acquired. In this phase, the customer starts to think what can be expected (such as “expected value” (Huber et al., 1997, Parasuraman, 1997) from their products/services and what is desirable (such as “desired value” (Flint et al., 1997)) of the value proposition of the enterprise. These expectations are related to both benefits expect from the product/service as well as sacrifices the customer is prepared to make upon its acquisition (Komulainen et al., 2005). Also, as a desired value is what the customer wants to happen and the benefits is seeking for. So this phase seems most interesting to study, because this will reduce the uncertainty the enterprise has in understanding the customer needs and in trying to maximise the ex-post happiness (Woodall, 2003). The next sections will illustrate the relationship between forms of value with endogenous and exogenous assets. This is shown in the form of graphs, using pictures to support the explanation of their relationship rational in an Ex-Ante phase: 1) the relationship between the exchanged deliverables and how different forms of value emerge in this phase; 2) the connections between deliverables, assets and ARCON Endogenous and Exogenous Components.
Forms of Value and deliverables
In the Figure 6, three forms of value emerged for this phase: Marketing (MARK_VC), Net (NET_VC) and Sale (SALE_VC).
Types of endogenous and exogenous components (Ex-Ante Phase)
Marketing VC
From the literature, MARK_VC is related with a “pre-experience zone and can be best associated with an Ex-Ante temporal position” (Woodall, 2003 p17). MARK_VC is seen as a “perceived component”, because “suppliers can never predict how each consumer will perceive and react to specific service” (Woodall, 2003 p17), that´s why MARK_VC is the form of value related with almost all deliverables. This is about combining the supply side and the demand side interpretations of the enterprise offering.
1. “Product Information” (DL2). The client needs to be confident that the information of the product is correct and up to date. They inform the customers of all kind of products for making the footwear and for all new innovations in each collection;
“(…) we provide information about our products including minimum quantities, product certification, complete product portfolio and innovative products. We have to ensure [through product certification by our suppliers] that our products do not contain PVC, acids, acetone or enzymes. (…) This is an advantage for our clients that will also in having their products certified, instead having to make tests with raw material bought in other countries that do not have the European specification requirements. (…) We also have no child labour. (…)” (Interview excerpts)
2. “Knowledge and experience about the process”(DL4) it is an important deliverable since according to the interview “(...) the client knows very little about raw materials and even about the process applying and combining these raw materials (…)”. The Knowledge of the raw material “(…) is vital to a salesperson’s effectiveness, because we must always be attentive to ever-changings client needs, other market trends, competitors’ products or services as well as new products to answer the questions of our clients” (interview excerpt). Without it the company will have lack of credibility and confidence;
3. “Product Innovation” (DL5) it is about search for new products;
“(…) in the footwear industry we must constantly innovate and search for new products. According to the product innovation they know we have a multiple sources of new products and we are constantly innovating” (interview excerpt).
4. “Research on new design and models” (DL13) (suppliers). Suppliers must constantly improve the manufacturing processes, must be proactive and anticipate client needs.
NET VC
In the NET_VC the client is focusing purely “on the balance of benefits/sacrifices” (Woodall, 2003 p7). By looking at the “Requirements for new collections” (DL3), the customer will make a balance of benefits/sacrifices as a utilitarian perspective on purchase and consumption. DL3 is related with a particular characteristics and specifications of a product/service made by the customer.
“An example of a requirement is when a clients wants a specified material, for instance, a fabric mounted on cork.” (Interview excerpts)
This relates the benefit of the innovation and its value perception by the end-consumer, versus the difficulty of having a fabric properly mounted on cork. As an outcome perspective the evaluation of the benefits and sacrifices “(…) has to be done by the client (…)” (interview excerpt).
involved benefit and sacrifices. This implies a consistent and in-depth knowledge of all materials and how they can, or not, be used together. This assistance is important and valued by the enterprise clients that will, along the process, buy innovative materials for footwear.
Quoting the interviewee:
“(…) if we contributed to clients gains they can come again and buy our products [Building percent of Client orders]. From the point of view of the client we can advise them if it is feasible or not [to use or combine particular raw materials], contributing for their satisfaction” (interview excerpt).
SALE VC
SALE_VC, as a concept, relates only to the reduction of sacrifice “(…) predicted purely upon units of exchange (…) and influence perceptions of VC at EX-Ante (…)” phase (Woodall, 2003 p19). In this form of value, the client perceives the price, the quality of products, the services, according to the information of the enterprise products (“Product Information” - DL2).
Deliverables vs. Endogenous/Exogenous Assets
The previous discussion related forms of value and their relationship with each deliverable for the Ex-Ante time position and is illustrated in Figure 6. This picture also shows the relationship between each deliverable, the enterprise assets being used or built and the projection of each asset into the types of endogenous and exogenous components. The following discussion will use the deliverable “Product Information” (DL2) as an example to illustrate this relationship. The same exercise was extended to the other deliverables thus further demonstrating the answer to research question 1.1 and 1.2. The authors, however, refrained from including here all this description in order to make this document shorter and more convenient to read.
Deliverable DL2 is about providing information about Pontechem products and services: 1) relates to certified products by [Using] Certified Products (A29); 2) and to the diversity of their product portfolio and to their ability to suggest improvements the client’s products by [Using] Years of Experience (A11), and Know-how (A2) (using their knowledge) to help clients achieve their goals. Pontechem wants to increase sales [Building] asset A22 (Sales per Customer) and [Build] Percentage of Satisfaction (A27) among their clients.
[Building] Sales per Customer (A22)
The asset [Building] Sales per Customer (A22) will be projected into: 1) Endogenous Functional (END_FUNC), reflecting on the competency of their human resources, such as CEO and the personal of the enterprise, in their procedures and methodologies to sale their raw material; 2) Exogenous Market (EXO_MARK) related with the interaction with clients by giving them information about the competence of their services and products in acquiring potential sales and new clients.
[Use] Certified Products (A29)
The asset [Using] Certified Products (A29) will be projected into Exogenous Support (EXO_SUP), reflecting both the suppliers role and their certification provided by those entities that are entitled to issue certificates confirming compliance with regulations and norms.
[Use] Know-how(A2)
The asset [Use] Know-how will be projected into Endogenous Structural (END_ST), reflecting a direct participation in the main business process, responsible for operation and collaboration among its actors, (Camarinha-Matos and Afasarmanesh, 2008b). The CEO is responsible for the daily general support activities to their clients
by helping them solving all different problems that arise from the usage of supplied materials. The CEO [Uses] know-how to perform these enterprise activities.
Discussion
The focus of this section was answer the 1st research question, to understand how we
could model the Value for the Customer. At this stage we aimed at understanding how value was built on top of assets endogenous and exogenous to the organization and how do those assets influence or relate the Value for the Customer. This brief illustration using DL2, “Product Information” helped demonstrating the relevance of both endogenous and exogenous assets, of different types (e.g.: Endogenous Functional, Exogenous Support and Exogenous Market) to the construction of the value for the customer. Our objective, however, is to build on a quantitative model that may help us in the decision making process. This will be discussed in the following sections.
5
Value For the Customer Quantitative Model, Application
and Discussion
Now that the relevance of both endogenous and exogenous assets for the Value for the Customer was demonstrated, we want to address the second research question:
1. Can we derive a formal mathematical model that provides for the quantitative handling of the proposed model?
Moreover, as illustrated in the proposed model presentation we would like to use this quantitative model to support the tuning of the enterprise Value Proposition. To this end the client or end-customer perceived benefits and sacrifices have to be understood and included in the equation. As a result, this section is organized as follows. We start by introducing the list of relevant perceived benefits and sacrifices derived from the interview at the enterprise. We then use the Fuzzy AHP method to assess the two “sides”, that is, the enterprise perspective and the client perspective. Finally we integrate both results in a final analysis of the value proposition.
5.1 Perceived Benefits and Sacrifices
The detail of the Perceived Benefits (PBi) and Sacrifices (PSi) related to the previously identified exchanged deliverables and enterprise assets at an EX-Ante time position were derived from the interview at Pontechem and listed in a table that contains the whole set of PB/PS identified in the existing deliverable exchange. This table may be found in annex in Table A.1.
5.2 Using the Fuzzy AHP extent analysis on the enterprise perspective
One of the most common Multi-Criteria Decision Making (MCDM) techniques is Analytical Hierarchy Process (AHP) (Ahmad et al., 2006, Ahmad and Laplante, 2009, Peng et al., 2011). As the direct application of AHP cannot reflect the human thinking (Nukala and Gupta, 2005, Vahidnia et al., 2008), in this study AHP will be used together with fuzzy theory. The authors believe this approach is better in dealing with ambiguous and self-defined situations (Aggarwal and Singh, 2013). The so-called Fuzzy AHP method uses the Saaty’s scale for each decision maker, individually carrying out each pair wise-comparison for the criteria/alternatives. In our case study, a comprehensive pair-wise comparison matrix (eq.3) is built, integrating the three perceptions of the two decision makers and client (as perceived by the company). Using equation (eq.1-2), these values are transformed into
triangular fuzzy numbers (b!"). Then, the extent analysis is used to obtain the synthetic extent value (Chang, 1996) of the pair-wise comparison.
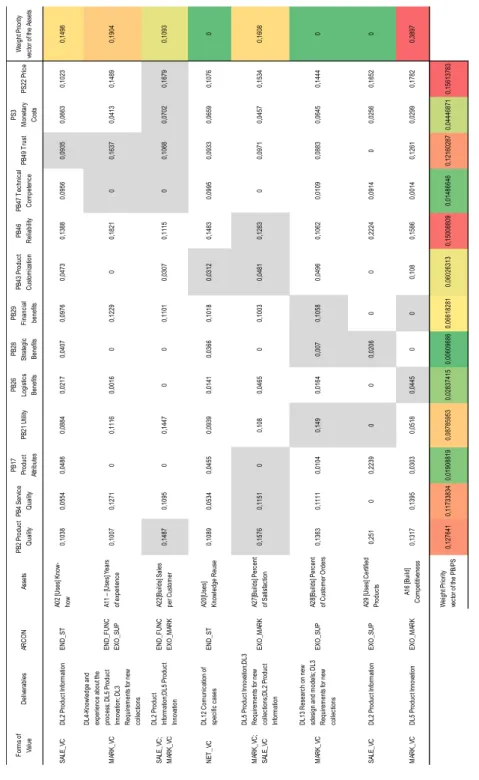
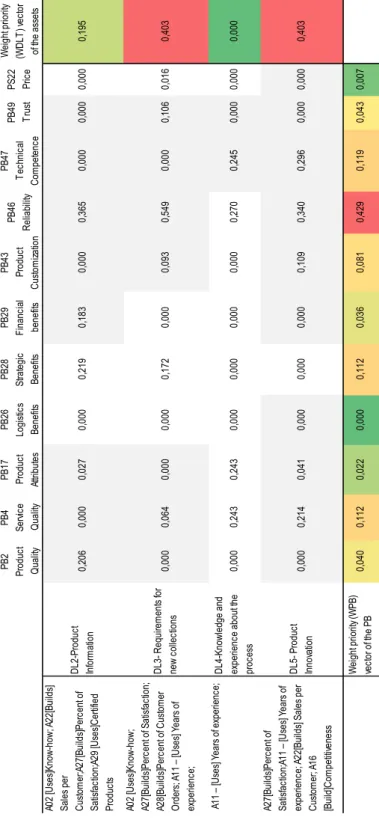
In this context, in order to evaluate the criteria and the alternatives, the interviewees in the enterprise graded the pair-wise comparison by using the Saaty’s scale giving: 1) the relative importance between each Criterion (8 Assets); 2) for each Criterion (Asset), the relative importance of each and every Alternative (13 PB/PS). The overall calculations by using the fuzzy AHP method, through the equations (3-10), are depicted in the Table 1, showing: a) the relative relevance of the enterprise assets involved (colour grading column); b) the ranking of alternatives obtained for the Perceived Benefits/Sacrifices (colour grading in the bottom row); c) the relationship between Assets and Benefits that were not identified during the interview; d) the deliverables identified with each asset (endogenous/exogenous); e) the form of value related with each deliverable.
Relative importance between each Criterion
According to the pair-wise comparison of the company and after the calculation by using the AHP Fuzzy Method, Table 1, the higher value emerges for the exogenous market (EXO_MARK) asset [Builds] Competitiveness (A16). Pontechem must identify opportunities for achieving sustainable competitive advantage (Camarinha-Matos and Afasarmanesh, 2008, p105), which means the enterprise must focus on partnerships to achieve its goals, “showing the best potential value within their chosen marketplace” (Woodall, 2003) by delivering adequate “Product Innovation” (DL5) in the communication of their value proposition. The interview comments to this result make this clear:
“(…)due to the fact of our collection changes from to season to season it is necessary to look for our client needs. We have a high variety of articles. The client is going to find whatever he wants and the prices are not high. This saves the client the need to undergo further developments and increases competitiveness. Basically we provide reliable products that our clients trust. Our products are also trendy and innovative, thus meeting their needs for the new season collections.” (interview excerpt).
The relevance of A16 emerges firstly from the price (PS22). Then we have the Reliability (PB46), the quality of their Products and Services (PB2, PB4) and Trust (PB49). These PB and PS were indeed mentioned in the interview but not related with A16. This is an interesting result. Indeed, during the interview the whole list of PB/PS was analyzed one at a time, however, as result of the pair-wise comparison, these new relationships emerged. The discussion of these results with the interviewee confirm the rational for those relationships:
“(...) Our advantage is the diversification and the quality of our products, service and innovation. (…)There is an amount of different and innovative products each year in each collection. Also, the client may come to us and get everything to make shoes.“ (Interview excerpts)
The asset [Uses] Years of experience (A11) was ranked second. The perceived benefits with higher values on using this asset were Reliability (PB46) and Trust (PB49). The client perceived Reliability as “the ability of the supplier to do things right at the first time” (Lapierre, 2001 p255) and perceived Trust, as the ability to honour his promises capturing the client confidence that the enterprise is telling the truth about the products. The interview testimonials confirm the rational for those relationships:
“(…) we need to know if the product is technically feasible and this knowledge results from our years of experience in the footwear market. Indeed, the reliability more than trust is very important in our business.” (Interview excerpts)
Ranking of alternatives obtained for the Perceived Benefits
For the ranked alternatives, the highest priority vector of the PB/PS was PS22 – Price. Thus, it is the most important alternative that the enterprise may take into account in the decision making process, followed by PB46-Reliability, PB2–Product quality and PB4–Service quality. These results were confirmed by the enterprise and emphasized by some authors, whose words can be summarize as: “price is always a part of the client’s value calculation (…) and is one of the elements which is given up to obtain a product or a service” (Woodall, 2003, Zeithaml, 1988). PB46-Reliability is ranked second and is defined “as the ability of the supplier’s to keep his promises and the accuracy of the transactions” (Lapierre, 2001). In this context, [Using] Years of experience (A11), Certified Products (A29) and Knowledge Reuse (A20) are contributing for PB46-Reliability. The relationship between assets and benefits that were not identified during the interview are the cells in white background. It is interesting to see that A16 is a very important asset, although the PB associated with it (as mentioned in the interview) has not the highest value in the whole set of PBs/PSs. The results revealed that four perceived benefits emerged with a fuzzy weight vector bigger than those mentioned in the interview, namely: PB46-Reliability, PB4-Service quality; PB2-Product quality and PB49-Trust. These relationships are explained by the Saaty’s scale ranking of alternatives, thus leading to the analysis of previously disregarded relationships.
Ta b le 1 . O ve ra ll R es ul ts of P ont ec he m ( eq. 10) Re m a rk : sh a d ed s q u a re s in t h e m a tr ix p ic tu re t h e PB/ PS a ss o ci a te d t o e a ch d el iv er a b le d u ri n g t h e in te rv ie w a n d t h e co n st ru ct ion of t he Va lu e Ne two rk . T h e o th er r el a ti o n sh ip s em er g e u p o n t h e p a ir -wi se c o m p a ri so n o f th e d if fe re n t cr it er ia /a lt er n a ti ve s. Fo rm s of Va lu e De liv er ab le s AR C O N As se ts PB2 Pr od uc t Qu al ity PB4 Se rv ic e Qu al ity PB1 7 Pr od uc t At tri bu te s PB2 1 U til ity PB2 6 Logi st ic s Be ne fit s PB2 8 St ra te gi c Be ne fit s PB2 9 Fi na nc ia l benef its PB4 3 Pr od uc t Cu st om iza tio n PB4 6 Re lia bi lit y PB4 7 T ec hn ic al Co m pe te nc e PB4 9 T ru st PS3 Mo ne ta ry Co st s PS2 2 Pr ic e We ig ht P rio rit y ve ct or o f t he A ss et s SA LE_ VC DL 2 Pr od uc t I nf or m at io n EN D _ST A0 2 [U se s] K no w -how 0, 1038 0, 0554 0, 0486 0, 0884 0, 0217 0, 0407 0, 0976 0, 0473 0, 1388 0, 0956 0, 0935 0, 0663 0, 1023 0, 1498 MA R K_ VC DL 4-Kn owl ed ge a nd ex per ienc e about the pr oc es s; D L5 Pr oduc t In no va tio n; D L3 Re qu ire m en ts fo r n ew co lle ct io ns EN D _F U N C EXO _SU P A1 1 – [U se s] Ye ar s of ex per ienc e 0, 1007 0, 1271 0 0, 1116 0, 0016 0 0, 1229 0 0, 1821 0 0, 1637 0, 0413 0, 1489 0, 1904 SA LE_ VC ; MA R K_ VC DL 2 Pr od uc t In fo rm ati on ;D L5 P ro du ct In no va tio n EN D _F U N C EXO _M AR K A2 2[ Bu ild s] S al es per C us tom er 0, 1487 0, 1095 0 0, 1447 0 0 0, 1101 0, 0307 0, 1115 0 0, 1068 0, 0702 0, 1679 0, 1093 NE T _V C DL 12 Co m un ic at io n of sp ec ifi c ca se s EN D _ST A2 0[ U se s] Kn ow le dg e R eu se 0, 1089 0, 0534 0, 0455 0, 0939 0, 0141 0, 0366 0, 1018 0, 0312 0, 1483 0, 0995 0, 0933 0, 0659 0, 1076 0 MA R K_ VC ; SA LE_ VC DL 5 Pr od uc t I nn ov at io n; DL 3 Re qu ire m en ts fo r n ew co lle ct io ns ;D L2 P ro du ct In fo rm ati on EXO _M AR K A2 7[ Bu ild s] P er ce nt of S at is fac tion 0, 1576 0, 1151 0 0, 108 0, 0465 0 0, 1003 0, 0481 0, 1283 0 0, 0971 0, 0457 0, 1534 0, 1608 MA R K_ VC DL 13 Re se ar ch o n ne w sd esi gn a nd m od el s; D L3 Re qu ire m en ts fo r n ew co lle ct io ns EXO _SU P A2 8[ Bu ild s] P er ce nt of C us tom er O rder s 0, 1363 0, 1111 0, 0104 0, 149 0, 0164 0, 007 0, 1058 0, 0496 0, 1062 0, 0109 0, 0883 0, 0645 0, 1444 0 SA LE_ VC DL 2 Pr od uc t I nf or m at io n EXO _SU P A2 9 [U se s] C er tif ie d Pr od uc ts 0, 251 0 0, 2239 0 0 0, 0206 0 0 0, 2224 0, 0914 0 0, 0256 0, 1652 0 MA R K_ VC DL 5 Pr od uc t I nn ov at io n EXO _M AR K A1 6 [B ui ld ] Co m pe tit ive ne ss 0, 1317 0, 1395 0, 0303 0, 0518 0, 0445 0 0 0, 108 0, 1586 0, 0014 0, 1261 0, 0299 0, 1782 0, 3897 We ig ht P rio rit y ve ct or o f t he P B/ PS 0, 127641 0, 11733834 0, 01908819 0, 08785953 0, 02837415 0, 00609686 0, 06618281 0, 06026313 0, 15008809 0, 01486646 0, 12160287 0, 04446871 0, 15613783
5.3 Results from the integration on the customer perception
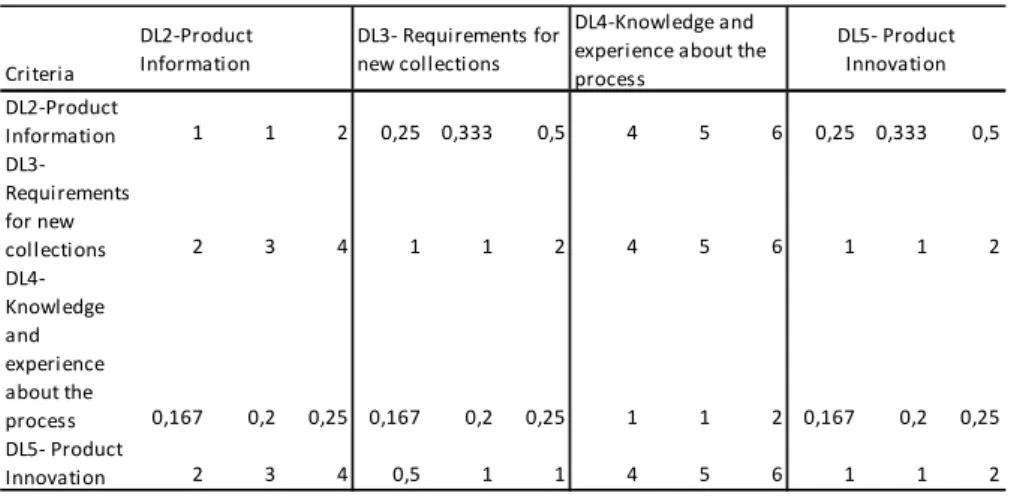
Upon the attempt to get information from the client, regarding his perception of benefits and sacrifices, and their relationship with the Pontechem deliverables, the research team along with Pontechem members, decided to concentrate only on the assets with higher relevance to identify which deliverables would have to be analyzed by the client. The results of the matrix of the Table 1, led to the use of the the following deliverables, for evaluation the criteria with the client: “Product Information” (DL2); “Requirements for new collections” (DL3); “Knowledge and experience about the process” (DL4) and “Product Innovation” (DL5). The client made the pair-wise comparison using the Saaty’s scale for these deliverables and then, because we have only one client, we transformed the client perceptions set into triangular fuzzy numbers using the comparison scale proposed by (Herrera Umaña and Osorio Gómez, 2006). The calculated the results are in Table 2. After this calculation and by applying the extent analysis method on fuzzy AHP method we obtain the priority weight vector (eq.10) for the deliverables:
𝑊!" = 0,1949 0,4025 0 0,4025.
Table 2. The fuzzy comparison matrix over different criteria
To assess the alternatives, we used all PB/PS except PB21 (Utility) and PS3 (Monetary Costs). Table 3 illustrates two of the four matrixes resulting from this process. Criteria DL2-‐Product Information 1 1 2 0,25 0,333 0,5 4 5 6 0,25 0,333 0,5 DL3-‐ Requirements for new collections 2 3 4 1 1 2 4 5 6 1 1 2 DL4-‐ Knowledge and experience about the process 0,167 0,2 0,25 0,167 0,2 0,25 1 1 2 0,167 0,2 0,25 DL5-‐ Product Innovation 2 3 4 0,5 1 1 4 5 6 1 1 2 DL2-‐Product Information DL3-‐ Requirements for new collections DL4-‐Knowledge and experience about the process
DL5-‐ Product Innovation
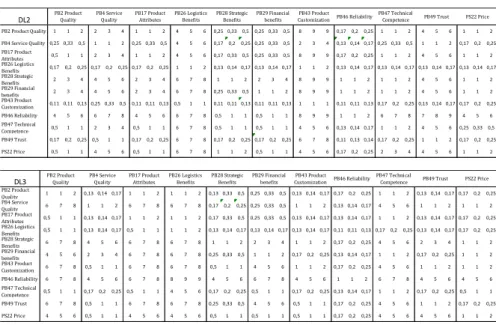
Table 3. Fuzzy comparison matrix with respect to DL2 and DL3
The authors had then to go through the evaluation criteria obtained by multiplying
the matrix 𝐌𝐏𝐁𝐃𝐋 Table 4 by applying eq3-10) obtained by the weights of each
alternative (PB/PS) with respect to main criteria (deliverables) with the normalized
vector obtained by the weights of the criteria (eq10) 𝐖𝐃𝐋𝐓. The summary of the
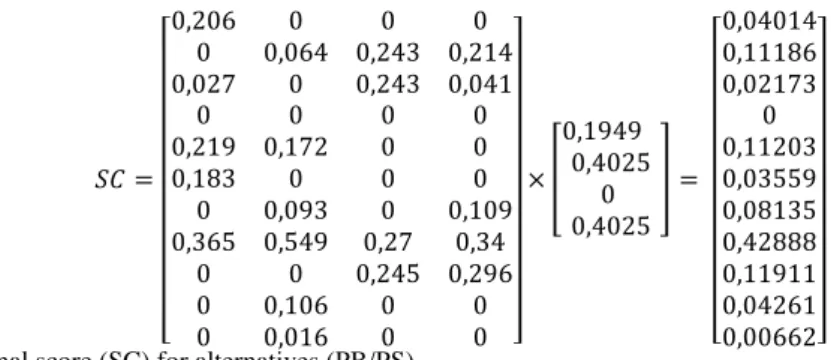
results of the fuzzy comparison of each PB/PS to each deliverables was a matrix and thus the resulting of the final score (SC) for the alternatives (PB/PS) is given by the
𝐒𝐂 = 𝐌𝐏𝐁𝐃𝐋×𝐖!𝐋𝐓 (Figure 7).
Table 4. Matrix MPBDL: Importance weightings, of all alternatives, with respect to each
deliverable DL2 DL3 DL4 DL5 PB2 0,21 0 0 0 PB4 0 0,06 0,24 0,21 PB17 0,03 0 0,24 0,04 PB26 0 0 0 0 PB28 0,22 0,17 0 0 PB29 0,18 0 0 0 PB43 0 0,09 0 0,11 PB46 0,37 0,55 0,27 0,34 PB47 0 0 0,25 0,3 PB49 0 0,11 0 0 PS22 0 0,02 0 0
DL2 PB2 Product Quality 1 1 2 2 3 4 1 1 2 4 5 6 0,25 0,33 0,5 0,25 0,33 0,5 8 9 9 0,17 0,2 0,25 1 1 2 4 5 6 1 1 2 PB4 Service Quality 0,25 0,330,5 1 1 2 0,25 0,33 0,5 4 5 6 0,17 0,2 0,25 0,25 0,33 0,5 2 3 4 0,13 0,14 0,17 0,25 0,33 0,5 1 1 2 0,17 0,2 0,25 PB17 Product Attributes 0,5 1 1 2 3 4 1 1 2 4 5 6 0,17 0,33 0,5 0,25 0,33 0,5 8 9 9 0,17 0,2 0,25 1 1 2 4 5 6 1 1 2 PB26 Logistics Benefits 0,17 0,2 0,25 0,17 0,2 0,25 0,17 0,2 0,25 1 1 2 0,13 0,14 0,17 0,13 0,14 0,17 1 1 2 0,13 0,14 0,17 0,13 0,14 0,17 0,13 0,14 0,17 0,13 0,14 0,17 PB28 Strategic Benefits 2 3 4 4 5 6 2 3 4 6 7 8 1 1 2 2 3 4 8 9 9 1 1 2 1 1 2 4 5 6 1 1 2 PB29 Financial benefits 2 3 4 4 5 6 2 3 4 6 7 8 0,25 0,33 0,5 1 1 2 8 9 9 1 1 2 1 1 2 4 5 6 1 1 2 PB43 Product Customization 0,11 0,110,13 0,25 0,33 0,5 0,11 0,11 0,13 0,5 1 1 0,11 0,11 0,13 0,11 0,11 0,13 1 1 1 0,11 0,11 0,13 0,17 0,2 0,25 0,13 0,14 0,17 0,17 0,2 0,25 PB46 Reliability 4 5 6 6 7 8 4 5 6 6 7 8 0,5 1 1 0,5 1 1 8 9 9 1 1 2 6 7 8 7 8 9 4 5 6 PB47 Technical Competence 0,5 1 1 2 3 4 0,5 1 1 6 7 8 0,5 1 1 0,5 1 1 4 5 6 0,13 0,14 0,17 1 1 2 4 5 6 0,25 0,33 0,5 PB49 Trust 0,17 0,2 0,25 0,5 1 1 0,17 0,2 0,25 6 7 8 0,17 0,2 0,25 0,17 0,2 0,25 6 7 8 0,11 0,13 0,14 0,17 0,2 0,25 1 1 2 0,17 0,2 0,25 PS22 Price 0,5 1 1 4 5 6 0,5 1 1 6 7 8 1 1 2 0,5 1 1 4 5 6 0,17 0,2 0,25 2 3 4 4 5 6 1 1 2 PB29 Financial benefits PB2 Product Quality PB4 Service Quality PB17 Product Attributes PB26 Logistics Benefits PB28 Strategic Benefits PB43 Product Customization PB46 Reliability PB47 Technical
Competence PB49 Trust PS22 Price
DL3 PB2 Product Quality 1 1 2 0,13 0,14 0,17 1 1 2 1 1 2 0,13 0,33 0,5 0,25 0,33 0,5 0,13 0,14 0,17 0,17 0,2 0,25 1 1 2 0,13 0,14 0,17 0,17 0,2 0,25 PB4 Service Quality 6 7 8 1 1 2 6 7 8 6 7 8 0,17 0,2 0,25 0,25 0,33 0,5 1 1 2 0,13 0,14 0,17 4 5 6 1 1 2 1 1 2 PB17 Product Attributes 0,5 1 1 0,13 0,14 0,17 1 1 2 1 1 2 0,17 0,33 0,5 0,25 0,33 0,5 0,13 0,14 0,17 0,13 0,14 0,17 1 1 2 0,13 0,14 0,17 0,17 0,2 0,25 PB26 Logistics Benefits 0,5 1 1 0,13 0,14 0,17 0,5 1 1 1 1 2 0,13 0,14 0,17 0,13 0,14 0,17 0,13 0,14 0,17 0,11 0,11 0,13 0,17 0,2 0,25 0,13 0,14 0,17 0,17 0,2 0,25 PB28 Strategic Benefits 6 7 8 4 5 6 6 7 8 6 7 8 1 1 2 2 3 4 1 1 2 0,17 0,2 0,25 4 5 6 2 3 4 1 1 2 PB29 Financial benefits 4 5 6 2 3 4 6 7 8 6 7 8 0,25 0,33 0,5 1 1 2 0,17 0,2 0,25 0,13 0,14 0,17 1 1 2 0,17 0,2 0,25 1 1 2 PB43 Product Customization 6 7 8 0,5 1 1 6 7 8 6 7 8 0,5 1 1 4 5 6 1 1 2 0,17 0,2 0,25 4 5 6 1 1 2 1 1 2 PB46 Reliability 6 7 8 4 5 6 6 7 8 8 9 9 4 5 6 6 7 8 4 5 6 1 1 2 6 7 8 4 5 6 4 5 6 PB47 Technical Competence 0,5 1 1 0,17 0,2 0,25 0,5 1 1 4 5 6 0,17 0,2 0,25 0,5 1 1 0,17 0,2 0,25 0,13 0,14 0,17 1 1 2 0,17 0,2 0,25 0,5 1 1 PB49 Trust 6 7 8 0,5 1 1 6 7 8 6 7 8 0,25 0,33 0,5 4 5 6 0,5 1 1 0,17 0,2 0,25 4 5 6 1 1 2 0,17 0,2 0,25 PS22 Price 4 5 6 0,5 1 1 4 5 6 4 5 6 0,5 1 1 0,5 1 1 0,5 1 1 0,17 0,2 0,25 4 5 6 4 5 6 1 1 2 PB29 Financial benefits PB2 Product Quality PB4 Service Quality PB17 Product Attributes PB26 Logistics Benefits PB28 Strategic Benefits PB43 Product Customization PB46 Reliability PB47 Technical
𝑆𝐶 = 0,206 0 0 0 0 0,064 0,243 0,214 0,027 0 0,243 0,041 0 0 0 0 0,219 0,172 0 0 0,183 0 0 0 0 0,093 0 0,109 0,365 0,549 0,27 0,34 0 0 0,245 0,296 0 0,106 0 0 0 0,016 0 0 × 0,1949 0,4025 0 0,4025 = 0,04014 0,11186 0,02173 0 0,11203 0,03559 0,08135 0,42888 0,11911 0,04261 0,00662
Fig. 7. Final score (SC) for alternatives (PB/PS)
The overall result integrating the client perspective is presented in the Table 5, giving us: a) the priority weights of each deliverable as well as their correspondence to each endogenous/exogenous or used/built assets; b) the priority weights of each PB/PS; c) and the relationship between the deliverables and PB/PS.
Relative importance between each Criterion (deliverables)
Based on the overall composite value in Table 5, we can comment the priority weights of each criterion:
“Requirements for new collection” (DL3) and “Product Innovation” (DL5) are the best ranked deliverable (criteria) with 0,403 followed by the “Product Information” (DL2) with 0,195. The interview testimonial of the client, confirm the rational for those relationships:
(…) the enterprise has a huge assortment of products and they innovate constantly for each season (related with DL5) . This implies, we don’t need to develop a specific product, for example a new textile or new soles. Also we have reliability on this enterprise, since they have certified products reflecting in their service quality and in their technical competence. (…)“(Client interview excerpts).
“(…) When we think in DL3, we related this component with the fact we can take the product catalogues with us and with it we can more easily create our collection (…).” (Client interview excerpts).
The deliverable “Knowledge and Experience about the process” (DL4) is irrelevant for this client, because this deliverable is embedded in DL3, and this zero make sense according to the interview at the client:
“(...) I know very little about the raw material. For example, we don’t know if fabrics are with good quality, i.e, if they had the U.E. tests, if it is possible to make a detail in a certain product without having the risk of the fabric doesn’t rip, etc. In this context, we depend on the reliability that we have on the company and with their technical competence to advise us of those characteristics. I think this is more related with DL3” (Client interview excerpts).
Ta b le 5 . Fi n al r es u lt s, i n te g ra ti n g o f th e C li en t p er ce p ti o n