Phosphite and phosphate in the accumulation
and translocation of nutrients in common bean
1Josinaldo Lopes Araujo2, Fabrício William de Ávila3, Valdemar Faquin4
INTRODUCTION
Among the products registered by the Brazilian Ministry of Agriculture, Livestock and Supply and marketed as foliar or soil fertilizers, phosphite-based formulations have been increasingly used in recent years (Araujo 2008). In Brazil, phosphites (H2PO3-, HPO3-2) are recommended mainly as a source of phosphorus and sometimes as fungicides (Schröetter
ABSTRACT
RESUMO
et al. 2006, Moor et al. 2009, Gómez-Merino & Trejo-Téllez 2015).
Many beneficial effects of phosphites on crops
have been reported in some studies. Tambascio et al. (2014) observed that phosphite provided an increase in the emergence of tubers, leaf area and mycorrhizal colonization in potatoes. Estrada-Ortiz et al. (2013) reported that the use of phosphite in the nutrient solution increased the concentration of free amino
1. Manuscript received in Apr./2016 and accepted for publication in Oct./2016 (http://dx.doi.org/10.1590/1983-40632016v4640810). 2. Universidade Federal de Campina Grande, Centro de Ciências e Tecnologia Agroalimentar, Pombal, PB, Brazil.
E-mail: [email protected].
3. Universidade Estadual do Centro-Oeste, Departamento de Agronomia, Guarapuava, PR, Brazil.
E-mail: [email protected]. Although used as an additional nutritional source of
phosphorus in agriculture, little is known about the effects of phosphites on plants. In order to evaluate the influence of phosphite and phosphate on the accumulation and translocation of phosphorus and cationic nutrients, in common bean, three experiments were conducted. In the first experiment, five concentrations (0.5 mg L-1, 10 mg L-1, 20 mg L-1, 30 mg L-1 and
60 mg L-1) were studied in a nutrient solution combined with two
forms of phosphorus [phosphate (Pi) and phosphite (Phi)]. In the second one, five Phi/Pi ratios were tested (0/100, 25/75, 50/50, 75/25 and 100/0). In the third experiment, two phosphate levels (1.5 mg L-1 = limiting and 20 mg L-1 = adequate phosphorus) and
three treatments related to foliar fertilization (KH2PO3, KH2PO4 and KCl solutions) were combined in the nutrient solution. Phosphite via roots caused a decrease in the accumulation of phosphorus and cationic nutrients, under phosphate deficiency. P-Phi decreased the Zn/P ratio more than P-Pi, increased the translocation of P and decreased the translocation of Fe. The foliar supply of P-Phi did not affect the phosphorus nutrition of bean plants or the translocation of nutrients, but decreased the accumulation of K, Ca, Mg, Fe and Mn. Foliar P-Pi, at an adequate P supply in the nutrient solution, increased the accumulation of this nutrient.
KEYWORDS: Phaseolus vulgaris; phosphorus nutrition; cationic nutrients.
Fosfito e fosfato no acúmulo e
translocação de nutrientes em feijoeiro
Apesar de ser utilizado como fonte nutricional suplementar de fósforo, na agricultura, pouco se conhece sobre os efeitos dos fosfitos nas plantas. Objetivou-se avaliar a influência do fosfito e do fosfato sobre o acúmulo e a translocação de fósforo e nutrientes catiônicos, em feijoeiro comum. Para isso, foram instalados três experimentos. No primeiro, foram estudadas cinco concentrações (0,5 mg L-1; 10 mg L-1; 20 mg L-1; 30 mg L-1;
60 mg L-1), combinadas com duas formas de fósforo [fosfato (Pi) e fosfito (Phi)], em solução nutritiva. No segundo experimento, foram testadas cinco proporções de Phi/Pi (0/100, 25/75, 50/50, 75/25 e 100/0). No terceiro, foram combinados dois níveis de fosfato, na solução nutritiva (1,5 mg L-1 = limitante e 20 mg L-1 =
fósforo adequado), e três tratamentos referentes à adubação foliar (soluções de KH2PO3, KH2PO4 e KCl). Sob carência de fosfato, o fosfito via radicular causou diminuição no acúmulo de fósforo e nutrientes catiônicos. O P-Phi diminuiu a razão Zn/P mais que o P-Pi, aumentou a translocação de P e diminuiu a de Fe. O fornecimento de P-Phi via foliar não afetou a nutrição fosfatada do feijoeiro e nem a translocação de nutrientes, mas diminuiu o acúmulo de K, Ca, Mg, Fe e Mn. O P-Pi via foliar, sob suprimento adequado de P na solução, elevou o acúmulo deste nutriente.
acids, protein and sugar contents and anthocyanins in strawberries. Bertsch et al. (2009) found that phosphite, supplied with phosphate in the nutrient solution and with a proportion of 50 % of each form of P, provided an increase in the production of dry mass, leaf area and accumulation of P in lettuce, tomato and banana. Rickard (2000) reported that phosphite increased sugar contents and soluble solids
in pears and increased the firmness and the intensity
of red in raspberries.
In relation to the effects of phosphite on plant nutrition, except for phosphorus, there is
little scientific information available (Ávila et al.
2012). For phosphorus, the results obtained by several authors show that phosphite does not replace phosphates (H2PO4-, HPO
4
2- and PO 4
3-) in the plant
metabolism (Araujo 2008, Thao & Yamakawa 2009,
Moor et al. 2009, Ávila et al. 2011 and 2012, Araújo
et al. 2013 and 2014). This is because phosphite has one less oxygen atom, which is substituted by a hydrogen atom, if compared to phosphate. This change in the molecular structure results in changes in the metabolism of phosphorus by plants, causing physiological disorders (Gómez-Merino & Trejo-Téllez 2015). One aspect little explored in such studies is the effect of phosphite on the accumulation and transport of nutrients and on the Zn/P ratio.
Araújo et al. (2014) observed that, in the absence
of phosphate, or when the proportions of phosphite were higher than the proportions of phosphate in the nutrient solution, there was a drastic reduction in bean growth, both in shoots and roots.
Considering the influence of phosphite on
the plant metabolism, it is presumed that phosphite interferes not only with the phosphorus nutrition of bean plants, but also with the accumulation and translocation of other nutrients. In this sense, Ávila et al. (2012) observed that the foliar application of phosphite increased K, Ca, Mg, Cu, Mn and Fe contents in common bean grown in soil with a low phosphate availability. However, this increase was attributed to the concentration effect, because phosphite promoted a decrease in the production of
dry mass. On the other hand, Orbović et al. (2008)
found no consistent effects of phosphite on the mineral nutrition of citrus sweet orange seedlings (Citrus sinensis L. Osbeck). Araújo et al. (2013) observed that P provided in the form of phosphite in the nutrient solution was translocated at a higher quantity to shoots of bean plants, if compared to
phosphate. This was probably due to the smaller size of the phosphite ion. In addition, the authors found,
after 10 days of cultivation, typical iron deficiency
symptoms in young leaves of bean plants under phosphite phytotoxicity.
The present study aimed at evaluating the effects of phosphite, applied via roots and leaves, on the accumulation and translocation of phosphorus and cationic nutrients in common bean grown in a nutrient solution.
MATERIAL AND METHODS
Three experiments were conducted in a nutrient solution, at a greenhouse of the Universidade Federal de Lavras, in Lavras, Minas Gerais State, Brazil, from January to March 2008, using common bean (Phaseolus vulgaris L. cv. BRS Radiante). This cultivar was chosen because of its short cycle,
defined and upright growth, and also because it is
well accepted by consumers.
Common bean seeds were germinated in standard vermiculite, in expanded polystyrene trays. Three days after emergence, uniform plants were chosen and transferred to pots containing 3 L of the
nutrient solution described in Araújo et al. (2013),
with 50 % of its original concentration. The nutrient solution composition was adjusted according to the treatments with phosphorus levels and forms. After 5 days of cultivation, the concentration of the nutrient solution was increased to 100 %. This concentration was kept until the end of the experiment. The initial volume of solution in the pots was daily corrected with deionized water and replaced every 5 days. The pH was kept between 5.5 and 6.0, by adding NaOH or HCl at 1.0 mol L-1. In the three experiments, potassium phosphite (KH2PO3) was used. It was obtained by a neutralization reaction between phosphorous acid p.a. (H3PO3) with potassium hydroxide p.a. (KOH). Before this procedure, the phosphorous acid was standardized with sodium hydroxide. As a phosphate source, the monobasic potassium phosphate p.a. (KH2PO4) was used.
In the three experiments, the design was
completely randomized. The first and the second
experiments consisted of providing phosphite via
roots. In the first experiment, a 5 x 2 factorial design,
replications, was used. Each experimental unit had three plants per pot. The concentration of 0.5 mg L-1 of P intended to provide a minimum amount of phosphorus capable of producing plant material for the evaluations. The other concentrations were established based on the recommended dose of P for common
bean in nutrient solution, as described by Araújo et
al. (2013). In the second experiment, the aim was to verify the possibility of phosphate being replaced by
phosphite. Therefore, the treatments consisted of five Phi/Pi ratios (0/100, 25/75, 50/50, 75/25 and 100/0) and five replications. Each replication was represented
by one pot with two plants.
For the third experiment, the treatments were arranged in a 2 x 3 factorial design, combining two levels of phosphate in the nutrient solution [representing limiting levels (1.5 mg L-1) and adequate levels (20 mg L-1)] with three solutions, for foliar application (KH2PO3, KH2PO4 and KCl as a control). There were six replicates. Each experimental unit was represented by two plants per pot.
The P (KH2PO3 and KH2PO4) and KCl solutions were applied at 40 mmol L-1 (Araújo et al. 2013). Two applications were conducted: one in the
emergence of the first trifoliate (V3 stage) and another during pre-flowering (R5 stage). The P concentration
used was equivalent to a dose of approximately 3 L of commercial potassium phosphite containing 131 g L-1 of P as phosphite for 400 L of solution, which is usually recommended for crops such as bean. To optimize the effect of foliar applications, the adhesive spreader ADESIL® (Agripec) was added to all solutions, at a dose of 0.2 mL L-1.
In all experiments, plants were harvested
at flowering (32 days after the installation of the
experiment). The collected material was divided into roots and shoots, to obtain the dry mass (60-65 ºC) of these tissues. Then, each part was individually milled in a Wiley mill, in order to determine the levels of P, K, Ca, Mg, Fe, Mn and Cu, and mass, root dry matter and nutrient content data, total accumulation of each nutrient in the plant and the respective translocation index for shoots [translocation = (nutrient accumulation in shoots)/(total accumulation) × 100] were calculated. Considering the negative interaction which generally occurs between Zn and P, when the form of P is phosphate (Mai 2011), the Zn/P and Znt/Pt ratios were obtained considering the foliar Zn and P contents and the total accumulation of Zn (Znt) and P (Pt), respectively.
The statistical analysis consisted of analysis of variance, regression analysis and Tukey test, when appropriate, at 5 %, using the software Saeg, version 9.1. In the experiment with proportions of phosphite and phosphate in the nutrient solution, a polynomial regression analysis was conducted, considering the proportions of phosphite as the independent variable.
RESULTS AND DISCUSSION
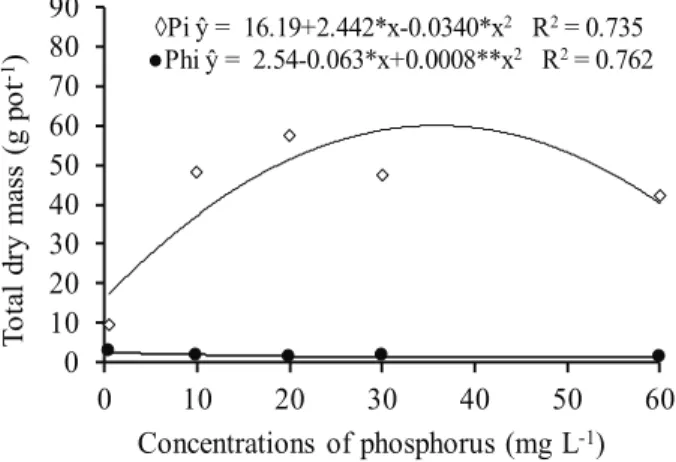
The total dry mass of the plants was significantly
influenced by the concentrations and forms of phosphorus (P) in the nutrient solution (Figure 1). It was observed that providing P exclusively in the form of phosphite (Phi) decreases the dry mass of common bean by about 95 %. One possible explanation for the phytotoxicity could be the fact that phosphite, when
phosphate is deficient, increases the concentration
of poly and pyrophosphates and inhibits several enzymes of the glycolysis and pentose phosphate pathway, thus interfering with the metabolism of P (Varadarajan et al. 2002).
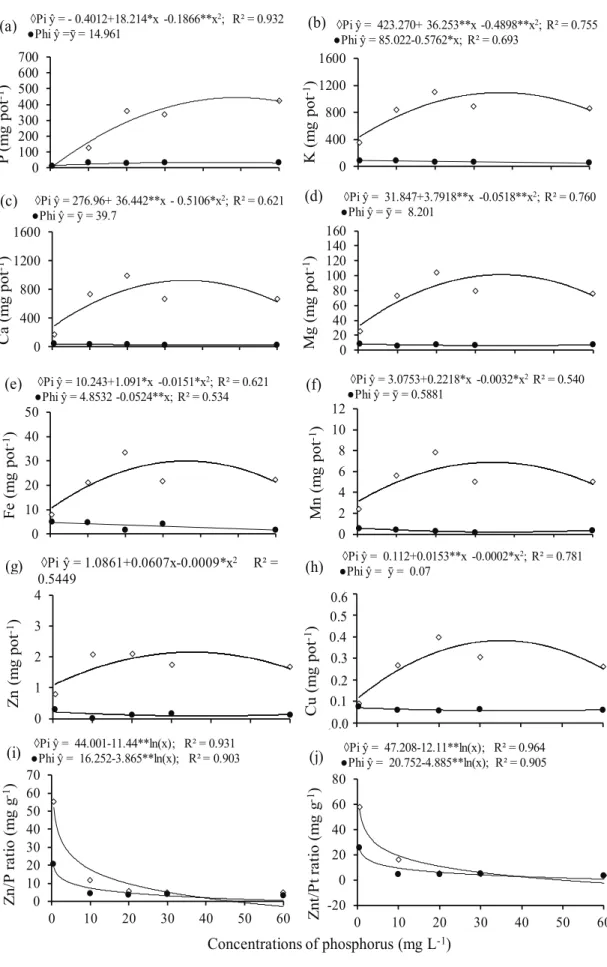
There was interaction between concentrations and forms of P for the variables evaluated, except for the translocation rates of K, Ca, Mn, Zn and Cu. When phosphite (Phi) was the exclusive source of phosphorus (P), the accumulation of P and cationic nutrients were lower, if compared to the application of phosphate as a source of P (Figure 2). Since the accumulation of a given element by the plant depends on its concentration in tissues and the produced dry matter, this effect was probably due
Figure 1. Total dry mass of common bean grown in nutrient solution under concentrations of phosphate (Pi) and phosphite (Phi). ** and *: significant at 1 % and 5 % by the F test, respectively.
0 10 20 30 40 50 60 70 80 90
0 10 20 30 40 50 60
T
o
ta
l dr
y
m
as
s
(g po
t
-1)
◊Pi ŷ = 16.19+2.442*x-0.0340*x2 R2= 0.735
●Phi ŷ = 2.54-0.063*x+0.0008**x2 R2= 0.762
Figure 2. Accumulation of macro and micronutrients and zinc/phosphorus ratio in common bean grown in nutrient solution under concentrations of phosphate (Pi) and phosphite (Phi). ** and *: significant at 1 % and 5 % by the F test, respectively.
60 5,029 0,384 60 1,689 0,120 60 67,560 54,085 30 62,250
Q(1%) ns Q(1%) NS Q(1%) ns 60 68,990
ns
0 100 200 300 400 500 600
700
0 10 20 30 40 50 60
P
(m
g
pot
-1)
0 400 800 1200 1600
0 10 20 30 40 50 60
K
(m
g
pot
-1)
◊Pi ŷ = 31.847+3.7918**x -0.0518**x2; R² = 0.760 ●Phi ŷ = ȳ = 8.201
0 400 800 1200 1600
0 10 20 30 40 50 60
Ca
(m
g
pot
-1)
0 20 40 60 80 100 120 140 160
0 10 20 30 40 50 60
M
g
(m
g
pot
-1)
0,00 0,10 0,20 0,30 0,40 0,50 0,60
0 10 20 30 40 50 60
Cu (m
g
pot
-1)
0 10 20 30 40 50
0 10 20 30 40 50 60
F
e
(m
g
pot
-1)
0 1 2 3 4
0 10 20 30 40 50 60
Z
n (m
g
pot
-1)
-20 0 20 40 60 80
0 10 20 30 40 50 60
Z
nt
/P
t ra
ti
o
(m
g
g
-1)
0 2 4 6 8 10 12
0 10 20 30 40 50 60
M
n (m
g
pot
-1)
0 10 20 30 40 50 60
70
0 10 20 30 40 50 60
Z
n/
P
ra
ti
o (m
g
g
-1)
◊Pi ŷ = -0.4012+18.214*x -0.1866**x2; R² = 0.932
●Phi ŷ =ȳ = 14.961 ●Phi ŷ = 85.022◊Pi ŷ = 423.270+ 36.253**x -0.5762*x; R² = 0.693-0.4898**x2; R² = 0.755
◊Pi ŷ = 276.96+ 36.442**x - 0.5106*x2; R² = 0.621 ●Phi ŷ = ȳ = 39.7
◊Pi ŷ = 10.243+1.091*x -0.0151*x2; R² = 0.621 ●Phi ŷ = 4.8532 -0.0524**x; R² = 0.534
◊Pi ŷ = 3.0753+0.2218*x -0.0032*x2R² = 0.540 ●Phi ŷ = ȳ = 0.5881
◊Pi ŷ = 1.0861+0.0607x-0.0009*x2 R² =
0.5449
◊Pi ŷ = 0.112+0.0153**x -0.0002*x2; R² = 0.781 ●Phi ŷ = ȳ = 0.07
◊Pi ŷ = 44.001-11.44**ln(x); R² = 0.931
●Phi ŷ = 16.252-3.865**ln(x); R² = 0.903 ●Phi ŷ = 20.752◊Pi ŷ = 47.208-12.11**ln(x); R² = 0.964-4.885**ln(x); R² = 0.905
(a)
(c) (d)
(b)
(g)
(f) (e)
(h)
(i) (j)
Concentrations of phosphorus (mg L-1)
0.6
0.3 0.2 0.4 0.5
to the phytotoxicity caused by the application of phosphite as the sole source of P for bean plants. This resulted in a lower growth of shoots and roots
(Araujo 2008). Araújo et al. (2013 and 2014) found
a decrease in the growth of the shoot and root system of common bean, when phosphite was provided in the absence of phosphate, or when phosphite ratios were higher than 25 % of the phosphorus supplied to the crop, or even when phosphite was provided via leaves to bean plants grown with a low availability of P. This explains the sharp decrease in the nutrient accumulation obtained in this study, provided by the supply of P as phosphite.
Differently from what happened with the application of phosphite, when P was provided in the
form of phosphate, there was a quadratic fit for the
accumulation of all analyzed nutrients, as a function of P concentrations in the nutrient solution (Figure 2). The maximum value of P accumulation (Figure 2a) occurred at 48.8 mg L-1 of P in the form of phosphate, in the nutrient solution. For the other nutrients, the highest values were obtained with concentrations
ranging from 33.7 mg L-1 (accumulation values for Zn) to 38.3 mg L-1 (accumulation values for Cu). This was also observed in other studies (Wissuwa et al. 2005, Ávila et al. 2013) and is due to the role of phosphorus in the plant metabolism, such as energy transfer and cell division, which is directly related to the growth and accumulation of nutrients by the plant (Clarkson 1985).
The Zn/P (Figure 2i) and Znt/Pt (Figure 2j) ratios decreased exponentially with the increase in the P concentration of the solution. When P was provided as phosphite, there was a sharp decrease in the Zn/P and Znt/Pt ratios, as a function of P concentrations in the nutrient solution. According to Mousavi (2011) and Mai (2011), the decrease in the Zn/P ratio may occur because of a decreased absorption and translocation of Zn, due to the high P concentration in the growth medium, possibly due to precipitation of poorly soluble forms of Zn2+ with phosphate ions, which occur both externally and internally to root tissues. In addition, it can also be a consequence of the “dilution effect” caused by the higher production of dry mass in response to a proper availability of P in the growth medium, as observed for common bean by Ávila et al. (2013). However, when the form of P was Phi, the dilution effect did not happen, because there was a decrease in growth with the increase in
the concentrations of this anion (Araújo et al. 2013).
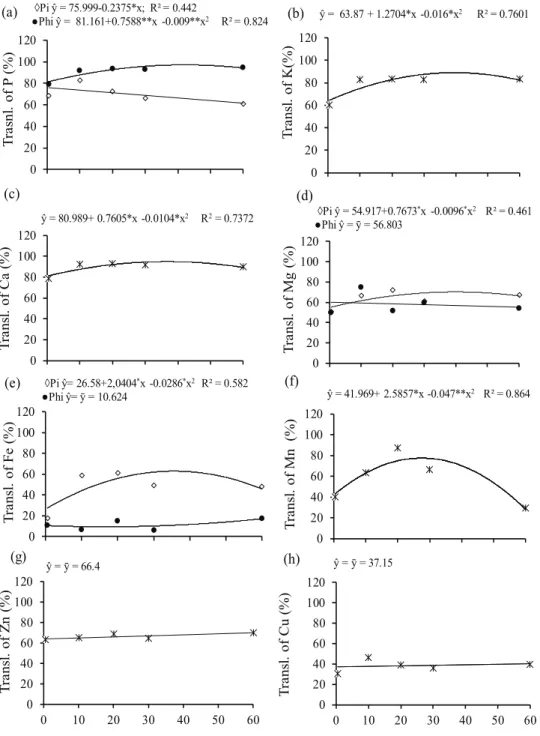
Translocation rates of nutrients to the plant shoot, as a function of P concentrations in the solution, responded variably depending on the nutrient evaluated and the form of P provided (Figure 3). The application of P as phosphite promoted the highest translocation of P (Figure 3a), indicating that this anion is possibly more mobile than the phosphate anion in plants. This increased mobility of phosphite, in relation to phosphate, may be because phosphite has one less atom of oxygen in its molecular structure
(White & Metcalf 2007), what presumably facilitates
its movement in the xylem and phloem vessels. However, there are no studies proving this.
For the nutrients K (Figure 3b), Ca (Figure 3c)
and Mn (Figure 3f), there was a quadratic fit for
the concentrations of P, independently of the form applied. For Zn (Figure 3g) and Cu (Figure 3h),
translocation was not influenced by P concentration
and form applied. This indicates that P interacts positively with Ca, K and Mn, facilitating their translocation to plant shoots. This does not occur with Zn and Cu, and explanations for this fact were not found in the literature. The translocation of Mg and mainly of Fe decreased with the application of phosphite. One of the symptoms of phytotoxicity by phosphite in bean plants is internerval chlorosis,
with a fine reticulation in young leaves, similar to Fe deficiency, accompanied by a “shriveling”
in the shape of a canoe (Araujo 2008). Possibly,
phosphite anions have higher affinity to Fe2+ than
phosphate anions, forming insoluble complexes with Fe2+ on the root surface, reducing its accumulation and translocation to shoots. Although no reports of this effect were found in the literature, there was formation of iron precipitates in the bottom of the pots in which phosphite was the only form of P and in those in which this anion was in proportions above 50%. This precipitation of iron in the presence of
phosphite confirms that hypothesis.
The phosphite ratios significantly influenced
Figure 3. Translocation (Transl.) of macro and micronutrients in common bean grown in nutrient solution under concentrations of phosphate (Pi) and phosphite (Phi). ** and *: significant at 1 % and 5 % by the F test, respectively.
0 20 40 60 80 100 120
0 10 20 30 40 50 60
T
ra
snl
.
of P
(%)
0 20 40 60 80 100 120
0 10 20 30 40 50 60
T
ra
ns
l.
of K
(%)
0 20 40 60 80 100 120
0 10 20 30 40 50 60
T
ra
ns
l.
of Ca
(%)
0 20 40 60 80 100 120
0 10 20 30 40 50 60
T
ra
ns
l.
of M
g
(%)
0 20 40 60 80 100 120
0 10 20 30 40 50 60
T
ra
ns
l.
of Cu (%)
0 20 40 60 80 100 120
0 10 20 30 40 50 60
T
ra
ns
l.
of F
e
(%)
0 20 40 60 80 100 120
0 10 20 30 40 50 60
T
ra
ns
l.
of M
n (%)
0 20 40 60 80 100 120
0 10 20 30 40 50 60
T
ra
ns
l. of
Z
n (%)
◊Pi ŷ = 75.999-0.2375*x; R² = 0.442
●Phi ŷ = 81.161+0.7588**x -0.009**x2 R² = 0.824 ŷ = 63.87 + 1.2704*x -0.016*x2 R² = 0.7601
ŷ = 80.989+ 0.7605*x -0.0104*x2 R2= 0.7372 ◊Pi ŷ = 54.917+0.7673*x -0.0096*x2 R² = 0.461 ●Phi ŷ = ȳ = 56.803
◊Pi ŷ= 26.58+2,0404*x -0.0286*x2 R² = 0.582
●Phi ŷ= ȳ = 10.624 ŷ = 41.969+ 2.5857*x -0.047**x2 R² = 0.864
ŷ = ȳ = 66.4 ŷ = ȳ = 37.15
Concentrations of phosphorus (mg L-1)
(a) (b)
(d) (c)
(e) (f)
(g) (h)
while, for the other nutrients, the effect was quadratic. The maximum values were obtained with phosphite proportions (Phi) ranging from 6.9 % (Fe) to 26.3 % (Mn). These results show that it is not possible to completely replace phosphate by phosphite in the nutrient solution, but that concentrations of P-Phi
between 1.7 mg L-1 and 6.3 mg L-1 may increase the absorption of certain nutrients, provided that the plant
is supplied with phosphate concentrations between 22.3 mg L-1 and 17.7 mg L-1, respectively.
Figure 4. Accumulation of macro and micronutrients in common bean grown in nutrient solution under proportions of phosphite (Phi). ** and *: significant at 1 % and 5 % by the F test, respectively.
0 100 200 300 400 500
0 20 40 60 80 100
P ( m g pot -1) 0 400 800 1200
0 20 40 60 80 100
K ( m g pot -1) 0 400 800 1200 1600
0 20 40 60 80 100
C a (m g pot -1) 0 50 100 150 200
0 20 40 60 80 100
M g (m g p o t -1) 0,0 0,2 0,4 0,6 0,8 1,0
0 20 40 60 80 100
C u (m g p o t -1) 0 10 20 30
0 20 40 60 80 100
F e (m g pot -1) 0 5 10 15 20
0 20 40 60 80 100
M n (m g p o t -1) 0 1 2 3 4 5
0 20 40 60 80 100
Z n ( m g p o t -1) 0 5 10 15 20
0 20 40 60 80 100
Z n/ P ( m g g -1)
ŷ = 886.96+4.695*x -0.1274**x2
R² = 0.984
ŷ = 956.48+8.070*x -0.1807**x2
R² = 0.901
ŷ = 118.03+1.208**x -0.0239*x2
R² = 0.952 ŷ = 22.37+0.0317**x -0.0023**x
2
R² = 0.980
ŷ = 7.338+0.0842*x-0.0016**x2
R² = 0.973
ŷ = 2.2523+0.0196**x-0.0004*x2
R² = 0.942
ŷ = 0.5811+ 0.0015**x -7.10-5*x2
R² = 0.935
ŷ = 14.917 -0.0982**x R² = 0.732
Phosphite (%) 1.0 0.2 0.4 0.6 0.8 0.0
(a) (b) (c)
(e) (f)
(d)
(g) (h) (i)
ŷ = 383.42-3.5984**x R² = 0.891
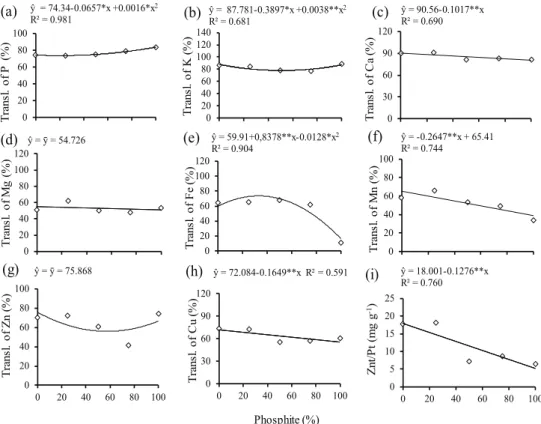
Figure 5. Translocation (Transl.) of macro and micronutrients and Znt/Pt ratio in common bean grown in nutrient solution with varying proportions of phosphate (Pi) and phosphite (Phi). ** and *: significant at 1 % and 5 % by the F test, respectively. Znt/Pt: ratio between total zinc accumulation and total phosphorus accumulation in the whole plant.
0 20 40 60 80 100
0 20 40 60 80 100
T ra n sl . o f P (% ) 0 20 40 60 80 100 120 140
0 20 40 60 80 100
T ra n sl . o f K (% ) 0 30 60 90 120
0 20 40 60 80 100
T ra n sl . o f C a (% ) 0 20 40 60 80 100 120
0 20 40 60 80 100
T ra n sl . o f M g (% ) 0 30 60 90 120
0 20 40 60 80 100
T ra n sl . o f C u (% ) 0 20 40 60 80 100 120
0 20 40 60 80 100
T ra n sl . o f F e (% ) 0 20 40 60 80 100
0 20 40 60 80 100
T ra n sl . o f M n (% ) 0 20 40 60 80 100
0 20 40 60 80 100
T ra n sl . o f Z n (% ) 0 5 10 15 20 25
0 20 40 60 80 100
Z n t/P t ( m g g -1)
ŷ = 74.34-0.0657*x +0.0016*x2
R² = 0.981 ŷ = 87.781
-0.3897*x +0.0038**x2
R² = 0.681
ŷ = 90.56-0.1017**x R² = 0.690
ŷ = ȳ = 54.726 ŷ = 59.91+0,8378**x-0.0128*x2
R² = 0.904
ŷ = -0.2647**x + 65.41 R² = 0.744
ŷ = ȳ = 75.868 ŷ = 72.084-0.1649**x R² = 0.591 ŷ = 18.001-0.1276**x R² = 0.760
proportions higher than 25 % in the solution were toxic to bean plants, as demonstrated visually by the shortening and thickening of roots and by the chlorosis in young leaves, as also observed for other crops (Varadarajan et al. 2002, Thao & Yamakawa 2009).
This results in a lower production of dry matter (Araújo
et al. 2013), which explains the lower accumulation of nutrients. The Zn/P ratio in shoots also decreased linearly according to Phi ratios in the solution. This indicates a negative interference of phosphite in the absorption and translocation of Zn in bean, as observed
in the first experiment (Figures 2i and 2j).
The translocation of P (Figure 5a) and K (Figure 5b), although moderately, tended to increase with the increase in phosphite proportions. This was also observed for P in the previous experiment (Figure 3a), where phosphite favored the translocation of P. On the other hand, there were decreases in the translocations of Ca, Fe, Mn, Cu and especially Fe, which, with 100 % of Phi, had its translocation
almost ceased. As pointed before, higher proportions of phosphite cause the precipitation of Fe in the nutrient solution. For the other nutrients, however, no explanations for this effect were found in the literature. It is possible that this decrease occurred due to the depressing effects of phosphite on plant roots, reducing its absorption and hence its transport to shoots, or due to a phosphate precipitation process of these nutrients in roots.
There was interaction between the factors P concentration in the solution and foliar application treatments for the P accumulated in tissues and its translocation from roots to shoots, as well as for Zn/P and Znt/Pt ratios (Table 1). For other nutrients, there was an effect of factors only in isolation (Table 2). Under appropriate supply of P in the hydroponic solution, Phi provided an accumulation of P in beans similar to the treatment with KCl. Pi possibly stimulated plant growth and hence increased the
accumulation of P. Under P deficiency (1.5 mg L-1),
Means followed by the same lower case letter, in the column, and capital case, in the row, do not differ by the Tukey test (p < 0.05). Znt/Pt: ratio between total zinc and total phosphorus accumulation in the whole plant. Phi, Pi and KCl: 40 mmol L-1 of KH
2PO3, KH2PO4 and KCl, respectively.
Treatment
Accumulated P Translocated P
Shoot Zn/P ratio Znt/Pt 1.5 mg L-1 20 mg L-1 1,5 mg L-1 20 mg L-1
____________ mg pot-1 ____________ _________________ % _________________ ___________________________ mg g-1___________________________
Phi 30.3 aB 254.8 bA 86.0 aA 83.8 aA 21.1 c A 6.06 aB 25.2 bA 5.9 aB
Pi 32.9 aB 308.2 aA 72.8 bA 85.9 aA 25.6 bA 5.69 aB 27.4 bA 6.1 aB
KCl 27.3 aB 294.9 bA 72.9 bB 85.1 aA 37.2 aA 6.05 aB 36.9 aA 6.1 aB
Table 1. Phosphorus accumulation and translocation and Zn/P ratio in common bean under foliar application treatments (Phi, Pi and KCl) and phosphate (Pi) concentrations in the nutrient solution [low (1.5 mg L-1) and adequate (20 mg L-1)].
Means followed by the same letter, in the column, comparing concentrations of P or the product applied (Phi, Pi and KCl), do not differ by the Tukey test (p < 0.05). Phi, Pi and KCl: 40 mmol L-1 of KH
2PO3, KH2PO4 and KCl, respectively.
Treatment K Ca Mg Fe Mn Zn Cu
Accumulation (mg pot-1)
1.5 mg L-1 of P 456.0 b 384.0 b 45.0 b 16.0 b 4.0 b 0.9 b 0.39 b
20 mg L-1 ofP 913.0 a 1,162.0 a 167.0 a 21.0 a 5.6 a 1.7 a 0.75 a
Translocation (%)
1.5 mg L-1 of P 76.1 b 89.9 b 64.0 a 11.6 b 26.3 b 71.4 b 76.3 b
20 mg L-1 of P 86.3 a 95.7 a 57.6 a 26.5 a 53.9 a 83.6 a 85.1 a
Accumulation (mg pot-1)
Phi 586.9 b 612.2 b 92.6 b 15.6 b 4.2 b 1.2 a 0.49 a
Pi 752.2 a 873.1 a 113.2 a 20.2 a 5.4 a 1.3 a 0.57 ab
KCl 714.8 ab 835.7 a 113.7 a 20.4 a 4.8 ab 1.4 a 0.65 a
Translocation (%)
Phi 83.5 a 92.7 a 63.1 a 19.2 a 44.3 a 77.6 a 78.7 a
Pi 80.6 a 93.2 a 60.9 a 19.6 a 36.2 a 75.8 a 84.0 a
KCl 79.6 a 92.4 a 58.4 a 18.3 a 34.8 a 78.9 a 79.4 a
there were no differences among foliar application products (Table 1). In turn, when the level of P in the
solution was deficient, the translocation of P in bean
plants was greater with a foliar application of Phi. This may be a consequence of the negative effect of phosphite on the root system of the plant, reducing the accumulation of P in roots and accumulating a greater amount in shoots, due to its foliar application. However, when the P level of the solution was adequate, the translocation of P was not affected by foliar application treatments. The Zn/P and Znt/Pt ratios were lower with the foliar application of Phi
or Pi in plants grown in a nutrient solution deficient
in P (1.5 mg L-1), similarly to the first and second experiments.
Due to the lack of P, there was a lower translocation and a decreased accumulation of all analyzed nutrients (Table 2), as a result of the combined effect of the less absorbed quantity of these nutrients and of the decreased dry matter production, in view of the important role of P on the development of the root system (Wissuwa et al. 2005). The lower translocation of nutrients to shoots
in P-deficient plants is probably due to an increased
root production over the production of dry matter
(Araújo et al. 2014), as a mechanism to overcome this deficiency (Clarkson 1985). In this sense, the
micronutrients Fe and Mn had proportionally most of its translocation hindered due to the lack of P.
Similarly to the first experiment, except for Zn, Phi
provided via leaf also decreased the accumulation of cationic nutrients in bean plants (Table 2). However,
similarly to the results of the first experiment, except
for Fe (Figure 3e), the translocation of these nutrients was not affected by this anion.
The results from the three experiments indicate that phosphites should not be applied via roots or leaves, as a way to overcome occasional phosphorus deficiencies. This is because this anion, in this situation, besides not meeting the needs of the plant, could also be toxic. However, it should be noted that this study was conducted in a nutrient solution, where the P-Phi ratio is not subjected to phosphate oxidation or to adsorption processes that may occur in the soil
(White & Metcalf 2007).
CONCLUSIONS
1. Under phosphate deficiency, phosphite applied
via nutrient solution to the roots decreases the
accumulation of phosphorus and cationic nutrients in bean plants. P-Phi decreases the Zn/P ratio, increases the translocation of P and decreases the translocation of Fe;
2. The application of P-Phi to leaves do not affect the phosphorus nutrition of bean plants or the translocation of nutrients. However, it decreases the accumulation of K, Ca, Mg, Fe and Mn. The application of P-Pi to leaves, under adequate P supply in the nutrient solution, increases the accumulation of this nutrient in the plant.
REFERENCES
ARAUJO, J. L. Crescimento e nutrição fosfatada do feijoeiro em função da aplicação via radicular e foliar de
fosfito. 77 f. 2008. Tese (Doutorado em Ciência do Solo) -
Universidade Federal de Lavras, Lavras, 2008.
ARAÚJO, J. L. et al. Crescimento e acúmulo de fósforo pelo feijoeiro tratado com fosfato e fosfito via foliar. Semina: Ciências Agrárias, v. 35, n. 4, p. 1425-1437, 2014.
ARAÚJO, J. L. et al. Interação fosfito e fosfato no crescimento e na nutrição fosfatada do feijoeiro em solução nutritiva. Revista Brasileira de Ciência do Solo, v. 37, n. 2, p. 482-490, 2013.
ÁVILA, F. W. et al. Effect of phosphite supply in nutrient solution on yield, phosphorus nutrition and enzymatic behavior in common bean (Phaseolus vulgaris L.) plants. Australian Journal of Crop Science, v. 7, n. 5, p. 713-722, 2013.
ÁVILA, F. W. et al. Growth, phosphorus status, and nutritional aspect in common bean exposed to different soil phosphate levels and foliar-applied phosphorus forms. Scientific Research and Essays, v. 7, n. 25, p. 2195-2204, 2012.
ÁVILA, F. W. et al. Phosphite supply affects phosphorus nutrition and biochemical responses in maize plants. Australian Journal of Crop Science, v. 5, n. 5, p. 646-653, 2011.
BERTSCH, F.; RAMÍREZ, F.; HENRÍQUEZ, C.
Evaluación del fosfito como fuente fertilizante de fósforo
vía radical y foliar. Agronomia Costarricense, v. 33, n. 2, p. 249-265, 2009.
CLARKSON, D. T. Factors affecting mineral nutrient acquisition by plants. Annual Review of Plant Physiology,
v. 36, n. 1, p. 77-115, 1985.
ESTRADA-ORTIZ, E. et al. The effects of phosphite on strawberry yield and fruit quality. Journal of Soil Science and Plant Nutrition, v. 13, n. 3, p. 612-620, 2013.
MAI, W. X. Tolerance to Zn deficiency and P-Zn interaction
in wheat seedlings cultured in chelator-buffered solutions. Journal of Arid Land, v. 3, n. 3, p. 206-213, 2011.
MALAVOLTA, E.; VITTI, G. C.; OLIVEIRA, S. A. Avaliação do estado nutricional das plantas: princípios e aplicações. 2. ed. Piracicaba: Associação Brasileira para
Pesquisa da Potassa e do Fosfato, 1997.
MOOR, U. et al. Effect of phosphite fertilization on growth, yield and fruit composition. Scientiae Horticulturae, v. 119, n. 3, p. 264-269, 2009.
MOUSAVI, R. S. Zinc in crop production and interaction with phosphorus. Australian Journal of Basic and Applied Science, v. 9, n. 3, p. 1503-1509, 2011.
ORBOVIĆ, V. et al. Citrus seedling growth and susceptibility
to root rot as affected by phosphite and phosphate. Journal of Plant Nutrition, v. 31, n. 4, p. 774-787, 2008.
RICKARD, D. A. Review of phosphorus acid and its salts as fertilizer materials. Journal of Plant Nutrition, v. 23, n. 2, p. 61-180, 2000.
SCHRÖETTER, S. Effects of phosphite on phosphorus supply and growth of corn (Zea mays). Landbauforschung
Volkenrodxe, Fal Agricultural Research, v. 56, n. 3/4,
p. 87-99, 2006.
TAMBASCIO, C. et al. The application of K phosphites to seed tubers enhanced emergence, early growth and mycorrhizal colonization in potato (Solanum tuberosum). American Journal of Plant Science, v. 5, n. 1, p. 132-137, 2014.
THAO, H. T. B.; YAMAKAWA, T. Phosphite (phosphorus acid): fungicide, fertilizer or bio-stimulator? Soil Science and Plant Nutrition, v. 55, n. 2, p. 228-234, 2009.
VARADARAJAN, D. K. et al. Phosphite, an analog of phosphate suppresses the coordinated expression of genes under phosphate starvation. Plant Physiology, v. 129, n. 3, p. 1-9, 2002.
WHITE, A. K.; METCALF, W. W. Microbial metabolism of reduced phosphorus compounds. Annual Review of Microbiology, v. 61, n. 1, p. 379-400, 2007.
WISSUWA, M.; GAMAT, G.; SMAIL, A. M. Is root
growth under phosphorus deficiency affected by source
or sink limitations? Journal of Experimental Botany,
![Table 2. Accumulation and translocation of cationic nutrient in common bean under phosphate (Pi) concentrations in the nutrient solution [low (1.5 mg L -1 ) and adequate (20 mg L -1 )].](https://thumb-eu.123doks.com/thumbv2/123dok_br/15904142.672184/8.850.64.767.799.1061/accumulation-translocation-cationic-nutrient-phosphate-concentrations-nutrient-solution.webp)
