Received October 23, 2008 and accepted December 2, 2009. Corresponding author: [email protected]
www.sbz.org.br
A meta-analysis of dry matter intake in Nellore and Zebu-crosses cattle
José Augusto Gomes Azevêdo
1, Sebastião de Campos Valadares Filho
2, Douglas dos Santos
Pina
3, Mario Luiz Chizzotti
3, Rilene Ferreira Diniz Valadares
41DCAA/Universidade Estadual de Santa Cruz. Membro do INCT em Ciência Animal.
2DZO/Universidade Federal de Viçosa. Pesquisador do CNPq e Coordenador do INCT em Ciência Animal. 3DZO/Pós-graduação em Zootecnia - UFV.
4DVT/Universidade Federal de Viçosa. Pesquisadora do CNPq e membro do INCT em Ciência Animal.
ABSTRACT - The study was carried out to develop and to evaluate new equations to predict dry matter intake (DMI) of Nellore and Zebu-crosses cattle using meta-analysis procedure. The data used to estimate the parameters were collected from independent performance experiments using growing and fattening Nellore and Zebu-crosses cattle, and they were compiled from 561 experimental units. Before proposing an equation to predict DMI, it was observed that the genetic group was a source of statisticaly significant variation. Therefore, equations to predict dry matter intake in the Zebu-Crosses and Nellore cattle were independently developed. The regression equations for Zebu-crosses cattle were: DMI = -2.6098 + 0.08844BW0.75 + 4.4672ADG – 1.3579ADG2 and DMI = -1.0094 + 0.01608BW + 4.4363ADG -1.2548ADG2. The regression equations for Nellore cattle were: DMI = -2.7878 + 0.08789BW0.75 + 5.0487ADG – 1.6835ADG2 and DMI = -1.3559 + 0.0159BW + 5.6397ADG – 1.8494ADG2. In order to evaluate fitted equations, it was utilized data from independent experiments published from 2005 to 2008 in the Revista Brasileira de Zootecnia. The equations (DMI) for Nellore overpredicted dry matter intake for estimates lower than 7 and higher than 10 kg·d-1. For Zebu-crosses cattle, dispersions of 3 kg d-1 were observed when extreme intakes were evaluated, however, when the equation included BW 0.75, the intercept did not differ from zero and the slope did not differ from 1. It is not possible to fit only one equation for preditcting DMI for beef cattle in tropical conditions, because there are differences between Zebu and Zebu-crosses. Fitted equations that include ADG and BW 0.75 should be used as an alternative method to predict dry matter intake of Zebu-crosses and Nellore beef cattle in tropical conditions.
Key Words: beef cattle, feed intake, prediction equations
Meta-análise do consumo de matéria seca em bovinos Nelore e mestiços
RESUMO - Objetivou-se desenvolver e avaliar novas equações para predição do consumo de matéria seca (CMS) em
bovinos Nelore e mestiço, utilizando-se meta-análise. Os dados utilizados para estimar os parâmetros foram coletados em experimentos de desempenho independentes com bovinos Nelore e mestiço nas fases de recria e engorda, compilados a partir de 561 unidades experimentais. Antes de propor uma equação para predizer o CMS, observou-se que o grupo genético foi uma fonte de variação estatisticamente significativa. Neste sentido, equações para predizer o CMS em bovinos Nelores e mestiços foram desenvolvidas de forma independente. As equações de regressão para bovinos mestiços foram: CMS = -2,6098 + 0,08844PV0,75 + 4,4672GMD – 1,3579GMD2 e CMS = -1,0094 + 0,01608PV + 4,4363GMD -1.2548GMD2. As equações de regressão para bovinos Nelore foram: CMS = -2,7878 + 0,08789PV0,75 + 5,0487GMD – 1,6835GMD2 e CMS = -1,3559 + 0,0159PV + 5,6397GMD - 1,8494GMD2. Para avaliar as equações ajustadas, utilizaram-se dados de experimentos independentes publicados entre 2005 e 2008 na Revista Brasileira de Zootecnia. As equações (CMS) para Nelore superestimaram o CMS para estimativas menores que 7 e maiores que 10 kg d-1. Para bovinos mestiços, as dispersões de 3 kg·d-1 foram observadas quando pontos extremos foram avaliados, no entanto, quando a equação incluiu PV0,75, o intercepto não diferiu de zero e a inclinação não diferiu de 1. Não é possível ajustar uma única equação para predizer o CMS para bovinos de corte em condições tropicais, porque há diferenças entre Nelores e mestiços. Equações ajustadas que incluem GMD e PV0,75 devem ser usadas como um método alternativo para predizer o CMS em bovinos Nelores e mestiços em condições tropicais.
Introduction
Numerous quantitative intake prediction models have
been developed, nevertheless, none has achieved
widespread acceptance and none uses a universally
applicable and robust prediction model (Pittroff &
Kothmann, 2001). Optimally, beef cattle producers should
develop intake prediction equations that are specific to
give production situations; such equations should
account for a greater percentage of the variation in intake
than would be possible with a generalized equation
(NRC, 2000).
The National Research Council guidelines for beef
cattle production (NRC, 2000) have been used in Brazil to
formulate diets and evaluate feeding programs. However,
these equations were developed mostly with
Bos taurus
cattle, with a size scaling procedure that is used to adjust
differences in mature animal size. In addition, although
anabolic stimulants are prohibited in Brazil, they were used
in some of the cattle in the database employed to generate
the dry matter intake model proposed by the NRC (2000).
When the main purpose of predictive models of dry
matter intake is to p redict the concentration of each nutrient
in total dry matter intake, the concentration of net energy
for maintenance (NEm) in the diet should not be an input
variable of model. In order to estimate the content of
energy and other nutrients in the diet, it is necessary to
initially predict the DMI. Moreover, the nutritional
requirements of the animal are primarily determined by the
body weight (BW; Plegge et al., 1984), and this, in turn, is
dependent on its performance (NRC, 1987). Thus, the
residual feed intake, used in the genetic improvement of
feed efficiency, is used to predict the feed intake of each
animal using an equation with BW
0.75and average daily
gain (ADG)
(Kolath et al., 2006).
Researchers have gathered data from multiple published
studies and attempted to formulate a quantitative model
that best explains the reported observations. Generally,
there are significant differences among studies; if these
differences are not taken into account, they can result in a
bias in the estimation of parameters (slopes and intercept)
of regression models. Therefore, a meta-analysis, which
incorporates the Study effect and its interaction as random
components of a mixed model, must be used. This should
result in better prediction equations of biological systems
and a more accurate description of their prediction errors
(St-Pierre, 2001).
This study was carried out to develop and evaluate new
equations for dry matter intake prediction in Nellore cattle
and Zebu-crosses using a meta-analysis procedure.
Material and Methods
The data used to estimate the parameter were collected
from independent performance experiments that evaluated
growing and fattening Nellore and Zebu-crosses (Nellore ×
Bos taurus
) cattle. The data recorded for each observation
included sex (SEX), initial body weight (iBW), final body
weight, days on feeding (DOF), dry matter intake, and
average daily gain (ADG). All data were obtained from
feedlot Nellore and Zebu-crosses cattle that were
individually fed
ad libitum
. Only data of bulls and steers
were used.
The initial dataset had 32 theses (studies) with 845
experimental units (n, individual cattle). Five thesis (study)
with 284 observations were rejected due to data duplication
or because they did not meet the initially criteria for selection
established for the meta-analyses. This dataset that met the
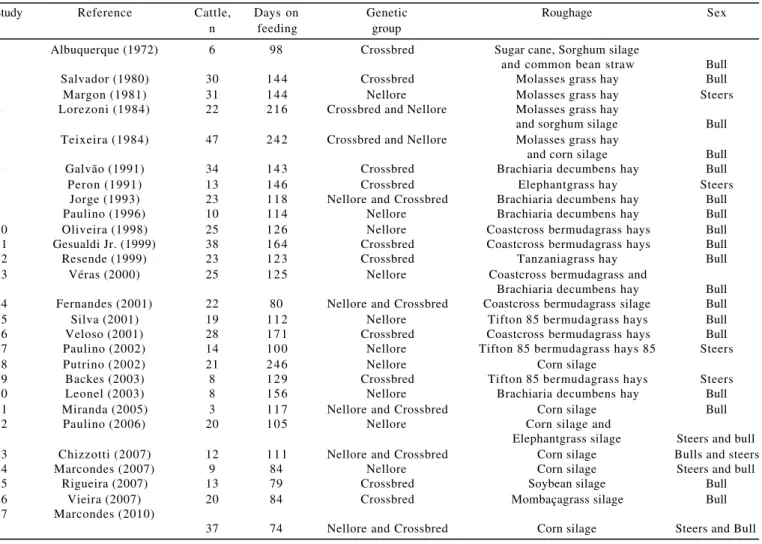
criteria for inclusion in this study was compiled from 27
theses (Table 1) and resulted in 561 observations.
Initially, the significance of the effects of genetic group
(GG) and its interactions were calculated and tested
statistically by ANOVA, using either body weight (BW)
and metabolic body weight (BW
0.75) as dependent variable
of dry matter intake. The model used included terms for
body weight (BW and
BW
0.75), average daily gain (ADG)
and average daily gain quadratic (ADG
2) and the interactions
with genetic group. The effects of independent variables
were considered significant (P<0.15).
An equation development was conducted in PROC
MIXED by using mixed-model regression techniques
(St-Pierre, 2001). The study was defined as the subject of
the random effect term. Independent variables were initially
fitted to a model that included a fixed intercept and slopes
and random effects of study in the intercepts and slopes,
using an unstructured variance-(co)variance matrix (UN
option). When the random slope-intercept covariance term
was not significant (P>0.10) or when the models that
included slope-intercept covariance did not converge,
option VC (variance components structure) in PROC MIXED
was used. Akaike’s information criteria (AIC) and Bayesian
information criteria (BIC) were used to define the best
variance-(co)variance matrix.
The evaluation of the model was performed by linear
regression analysis between the observed and the predicted
values of dry matter intake, which is a statistical test widely
used in model evaluation, and through the analysis of
residual or prediction errors (difference between observed
dry matter intake and predicted dry matter intake) vs. dry
matter intake observed plots (Draper & Smith, 1981). Mayer
& Butler (1993) recommended to plot observed vs. predicted
data, since they can be directly and easily visualized from
the graph. Therefore, both types of plots were used for
visual evaluation.
The observed data was used as the ordinate and model
predictions as the abscissa. In addition, the intercept and
the slope were calculated by regression of residues
(observed - predicted DMI) on mean-centered predicted
DMI. For this evaluation purpose, the tested null hypothesis
was the one in which the intercept and the slope,
simultaneously, did not differ from zero and unity,
respectively (Mayer et al., 1994). In the models, when slope
and intercept values were equal to unity and zero,
respectively, the model was deemed statistically similar to
the data observed (P<10).
Mean proportional bias was calculated as the slope of
the regression of the predicted data on the observed data
with a zero intercept (Shah & Murphy, 2006). A mean
proportional bias <1 indicates an under-prediction across
the range of observed values, and a value > 1 indicates
over-prediction (Roseler et al., 1997).
To evaluate model precision, a number of commonly
used deviance measures were employed, including root
mean square error (RMSE), mean absolute error (MAE) and
mean square prediction error (MSPE), as proposed by
Picard & Cook (1984).
The concordance correlation coefficient (CCC; Lin, 1989),
also known as the reproducibility index, was used because it
has been suggested to simultaneously account for accuracy
and precision. It can be expanded into two components, the
first one is the correlation coefficient estimate (r), which
measures precision, and the second (Cb) is the bias
correction factor, which indicates how far the regression
Study Reference Cattle, Days on Genetic Roughage Sex
n feeding group
1 Albuquerque (1972) 6 98 Crossbred Sugar cane, Sorghum silage
and common bean straw Bull 2 Salvador (1980) 30 144 Crossbred Molasses grass hay Bull 3 Margon (1981) 31 144 Nellore Molasses grass hay Steers 4 Lorezoni (1984) 22 216 Crossbred and Nellore Molasses grass hay
and sorghum silage Bull 5 Teixeira (1984) 47 242 Crossbred and Nellore Molasses grass hay
and corn silage Bull 6 Galvão (1991) 34 143 Crossbred Brachiaria decumbens hay Bull 7 Peron (1991) 13 146 Crossbred Elephantgrass hay Steers 8 Jorge (1993) 23 118 Nellore and Crossbred Brachiaria decumbens hay Bull 9 Paulino (1996) 10 114 Nellore Brachiaria decumbens hay Bull 10 Oliveira (1998) 25 126 Nellore Coastcross bermudagrass hays Bull 11 Gesualdi Jr. (1999) 38 164 Crossbred Coastcross bermudagrass hays Bull 12 Resende (1999) 23 123 Crossbred Tanzaniagrass hay Bull 13 Véras (2000) 25 125 Nellore Coastcross bermudagrass and
Brachiaria decumbens hay Bull 14 Fernandes (2001) 22 80 Nellore and Crossbred Coastcross bermudagrass silage Bull 15 Silva (2001) 19 112 Nellore Tifton 85 bermudagrass hays Bull 16 Veloso (2001) 28 171 Crossbred Coastcross bermudagrass hays Bull 17 Paulino (2002) 14 100 Nellore Tifton 85 bermudagrass hays 85 Steers
18 Putrino (2002) 21 246 Nellore Corn silage
19 Backes (2003) 8 129 Crossbred Tifton 85 bermudagrass hays Steers 20 Leonel (2003) 8 156 Nellore Brachiaria decumbens hay Bull 21 Miranda (2005) 3 117 Nellore and Crossbred Corn silage Bull 22 Paulino (2006) 20 105 Nellore Corn silage and
Elephantgrass silage Steers and bull 23 Chizzotti (2007) 12 111 Nellore and Crossbred Corn silage Bulls and steers 24 Marcondes (2007) 9 84 Nellore Corn silage Steers and bull 25 Rigueira (2007) 13 79 Crossbred Soybean silage Bull 26 Vieira (2007) 20 84 Crossbred Mombaçagrass silage Bull 27 Marcondes (2010)
37 74 Nellore and Crossbred Corn silage Steers and Bull
line deviates from the slope of unity. The location shift (u)
relative to the scale is the squared difference of the means
relative to the product of two standard deviations.
All statistical analyses were carried out by using SAS
(version 9.1, SAS).
Results and Discussion
The results of the ANOVA indicated that the GG was a
significant source of variation for all of the traits of interest
(Table 2). Therefore, different equations to predict DMI for
Zebu-crosses and Nellore cattle should increase the
accuracy. In addition to possible breed-specific effects,
NRC (1987) reported that genetic selection for feed efficiency
could produce animals with increased feed intake potential,
suggesting that genetic potential for growth may affect
feed intake.
Over the years, research in Brazil has suggested that
Zebu-Crosses have greater DMI than Nellore cattle
(Menezes & Restle, 2005). Furthermore, it is well established
that Holstein steers have a greater DMI than beef steers of
similar initial weight; therefore, the NRC (2000) recommended
that DMI would be increased 4% for Holstein vs. beef
crosses, and 8% for Holsteins relative to other beef breeds.
The higher DMI by Holstein steers compared to beef breeding
steers may be due to a high maintenance energy demand.
Holstein cattle have a higher proportion of organ and gut,
which increases its metabolic rate (Jones, 1985).
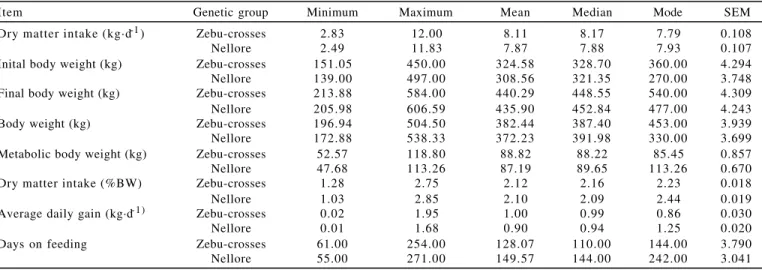
All data used (Table 3) were from experiments that had
a minimum duration of 50 days; an adaptation period was
insured to minimize the impact of compensatory growth on
DMI. Fox et al. (1972) found that compensating steers
consumed 16% more feed than continuous growth steers
when re-fed on a corn-based diet.
All the fitted equations exhibited a negative
coefficient for the variable ADG
2(kg·d
-1); this indicates
that the DMI reaches a plateau (Table 4), which might be
directly related to the energy concentration of the diet.
Starting from the gains that occur at maximum DMI, the
energy demand will be supplied by a low fiber/high energy
diet which will reduce the DMI, as it was suggested by the
theory of intake regulation for the energy demand
(Mertens, 1994). Because of the importance of this effect,
NRC (2000) included the variables NEm and NEm
2for the
adjustment of equations for DMI.
However, because of the inherent difficulty in accurately
determining the net energy content of the diet, Thornton et
al. (1985) developed an equation to predict dry matter intake
throughout the feeding period, which includes initial body
weight and days on feeding. The dry matter intake predicted
Item F P-value F P-value
Metabolic body Body weight (BW0.75) weight (BW) Metabolic body
weight (BW0.75) 377.53 <.0001
Body weight (BW) 393.70 <.0002 Average daily gain (ADG) 84.59 <.0001 128.04 <.0001 ADG1 30.07 <.0001 38.44 <.0001 Interaction with GG
Metabolic body
weight (BW0.75) 4.76 0.0297
Body weight (BW) 4.95 0.0266 Average daily gain (ADG) 4.49 0.0347 4.78 0.0293 ADG1 2.14 0.1443 2.43 0.1198
Table 2 - Summary of ANOVA: significance of the variables and the interaction effects of genetic group (GG)
Item Genetic group Minimum Maximum Mean Median Mode SEM
Dry matter intake (kg·d-1) Zebu-crosses 2.83 12.00 8.11 8.17 7.79 0.108
Nellore 2.49 11.83 7.87 7.88 7.93 0.107
Inital body weight (kg) Zebu-crosses 151.05 450.00 324.58 328.70 360.00 4.294 Nellore 139.00 497.00 308.56 321.35 270.00 3.748 Final body weight (kg) Zebu-crosses 213.88 584.00 440.29 448.55 540.00 4.309 Nellore 205.98 606.59 435.90 452.84 477.00 4.243 Body weight (kg) Zebu-crosses 196.94 504.50 382.44 387.40 453.00 3.939 Nellore 172.88 538.33 372.23 391.98 330.00 3.699 Metabolic body weight (kg) Zebu-crosses 52.57 118.80 88.82 88.22 85.45 0.857 Nellore 47.68 113.26 87.19 89.65 113.26 0.670 Dry matter intake (%BW) Zebu-crosses 1.28 2.75 2.12 2.16 2.23 0.018
Nellore 1.03 2.85 2.10 2.09 2.44 0.019
Average daily gain (kg·d-1) Zebu-crosses 0.02 1.95 1.00 0.99 0.86 0.030
Nellore 0.01 1.68 0.90 0.94 1.25 0.020
Days on feeding Zebu-crosses 61.00 254.00 128.07 110.00 144.00 3.790 Nellore 55.00 271.00 149.57 144.00 242.00 3.041
Table 3 - Descriptive statistics of the dataset used on the development of dry matter intake prediction equations to Zebu-crosses (n = 201) and Nellore (n = 360)
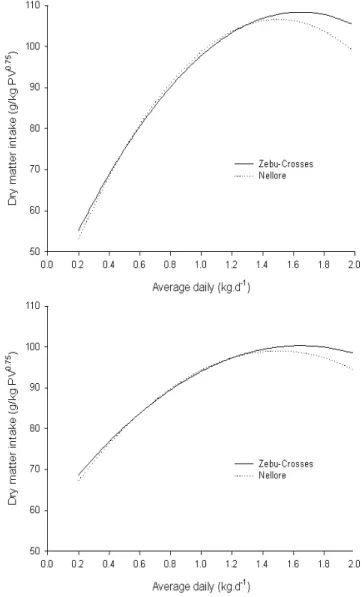
Figure 1 - Simulation of the prediction of dry matter intake for steers with average body weight of 200 (above) and 400 kg (down), and different average daily gain (kg·d-1),
using the adjusted equations 1.1 and 2.1 (Table 4).
by this equation accounts for 50% of the variation observed
in dry matter intake. The feed intake is typically represented
in the overall shape of a dry matter delivery curve for a
feedlot pen, with dry matter intake initially increasing to a
peak and then decreasing as days on feeding increases due
to the increase in body fat content of animals in the feedlot
pen.
A simulation of dry matter intake behavior based on the
fitted equations was performed (Figure 1), and the
relationship of average daily gain and dry matter intake
(g/ kg PV
0.75) can be observed. When dry matter intake is
expressed in g/kg BW
0.75, the fitted equations with respect
to average daily gain exhibit a dry matter intake curve with
three distinct segments: adaptation; plateau; and decline
phases, which correspond to adaptation to the feedlot
environment, increasing body weight, and increasing body
fat content.
However, given the shape of the dry matter intake
curve, nutrient requirements during different phases of the
finishing period may differ greatly for cattle in tropical
conditions. The intake plateau was predicted by the equations
1.1 and 2.1, when average daily gain was in the range from 1.64
to 1.50 kg·d
-1, corresponding to 108.4 e 100.3 g/kg BW
0.75(equation 1.1) and 106.64 e 99.04 g/kg BW
0.75(equation 2.1)
for steer of 200 and 400 kg, respectively.
The three phases of dry matter intake (Figure 1) support
the concept that quadratic equations allow better fitting of
dry matter intake prediction. When dry matter intake reaches
plateau, it is likely that the demanded level of energy in the
diet results in metabolic mechanisms that inhibit additional
dry matter intake.
Residual feed intake is an index that can be used to
calculate the efficiency of an animal (Archer et al., 1999). The
residual feed intake value for each animal was calculated as
the difference between the actual and the expected intake.
The expected feed intake used by several researchers was
calculated by the regression of the actual intake on average
daily gain and metabolic weight (Kolath et al., 2006).
Therefore, when the energy concentration of the diet is not
available for dry matter intake prediction, it could be replaced
by the average daily gain. Despite of being a characteristic
of the animal that affects the dry matter intake, the average
Number Equation AIC BIC R2 Genetic group
1.11.2 DMI = -2.6098 + 0.08844BW0.75 + 4.4672ADG – 1.3579ADG2DMI =
-1.0094 + 0.01608BW + 4.4363ADG -1.2548ADG2 399.7395.6 402.5397.7 0.740.75 Zebu-crosses
2.12.2 DMI = -2.7878 + 0.08789BW0.75 + 5.0487ADG – 1.6835ADG2DMI =
-1.3559 + 0.0159BW + 5.6397ADG – 1.8494ADG2 792.7787.7 796.7791.7 0.760.79 Nellore
Table 4 - Solution of the fixed effects of the regression equations obtained to Nellore cattle, purebred and Zebu-crosses
AIC = Akaike information criterion; BIC = Bayesian information criterion.
daily gain accounts for direct effects of diet that can limit
intake by simplifying the model and avoiding the use o f
variables with practical difficulties and with cumulative
mistakes in its determination such as NEm.
simplify dry matter intake predictions in practical
conditions.
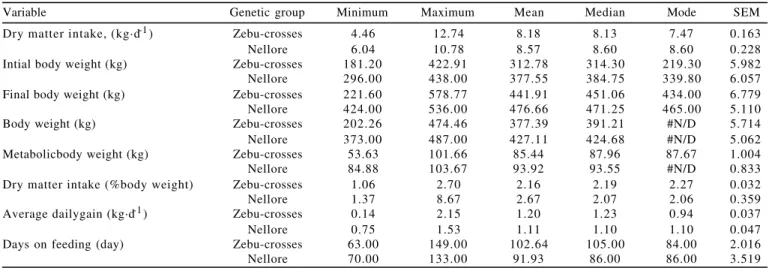
To evaluate the equations to dry matter intake
prediction proposed in this study, it was used an
independent dataset obtained from experiments conducted
with Zebu-crosses and Nellore cattle (Table 5).
The analysis of residuals (Figure 2) is important in
order to identify data points that cause departures of the
assumptions considered in linear regression (Tedeschi,
2006). The predictions for Nellore cattle overestimated dry
matter intake when it was smaller than 7 or greater than
10 kg·d
-1; nonetheless, the predicted dry matter intake for
both equations were close to the equality line (Figure 2).
For Zebu-crosses cattle, dispersions of 3 kg·d
-1were
observed when extreme intakes were considered.
Yungblut et al. (1981) suggested that overestimation
of dry matter intake has more serious consequences for
ration formulation than does underestimation. If beef
cattle eat less than what was predicted, their total nutrient
intake could be lesser than the amount required to reach
its potential performance. However, dry matter intake
underestimation could be worse when feed costs are
considered by decision support models; this is because
feed costs would be underestimated, and predictions for
profitability would be erroneously high. In contrast,
overestimation of feed cost could result in more
conservative decisions, and alternatives evaluated as
profitable could be more favorable than expected.
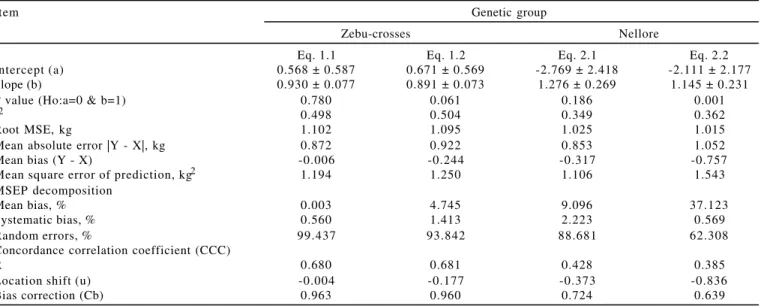
The slope and intercept of the regression of observed
and predicted by the equation that does not include
metabolic body weight were significantly different than
Variable Genetic group Minimum Maximum Mean Median Mode SEM Dry matter intake, (kg·d-1) Zebu-crosses 4.46 12.74 8.18 8.13 7.47 0.163
Nellore 6.04 10.78 8.57 8.60 8.60 0.228 Intial body weight (kg) Zebu-crosses 181.20 422.91 312.78 314.30 219.30 5.982 Nellore 296.00 438.00 377.55 384.75 339.80 6.057 Final body weight (kg) Zebu-crosses 221.60 578.77 441.91 451.06 434.00 6.779 Nellore 424.00 536.00 476.66 471.25 465.00 5.110 Body weight (kg) Zebu-crosses 202.26 474.46 377.39 391.21 #N/D 5.714 Nellore 373.00 487.00 427.11 424.68 #N/D 5.062 Metabolicbody weight (kg) Zebu-crosses 53.63 101.66 85.44 87.96 87.67 1.004 Nellore 84.88 103.67 93.92 93.55 #N/D 0.833 Dry matter intake (%body weight) Zebu-crosses 1.06 2.70 2.16 2.19 2.27 0.032 Nellore 1.37 8.67 2.67 2.07 2.06 0.359 Average dailygain (kg·d-1) Zebu-crosses 0.14 2.15 1.20 1.23 0.94 0.037
Nellore 0.75 1.53 1.11 1.10 1.10 0.047 Days on feeding (day) Zebu-crosses 63.00 149.00 102.64 105.00 84.00 2.016 Nellore 70.00 133.00 91.93 86.00 86.00 3.519
Table 5 - Descriptive statistics of dataset used on the evaluation of DMI prediction for Zebu-crosses (n = 90)1 and Nellore (n = 30)2
#N/D, not defined.
1 Zebu-crosses: Aferri et al. (2005); Chizzotti et al. (2005); Mendes et al. (2005); Pacheco et al. (2005); Silva et al. (2005); Alleoni et al.( 2006); Faturi et al. (2006);
Gesualdi et al.( 2006); Paixão et al. (2006); Restle et al. (2006); Souza et al. (2006a); Souza et al. (2006b); Fernandes et al. (2007); Henrique et al. (2007); Macitelli et al. (2007); Maldonado et al. (2007); Neumann et al. (2007); Pereira et al. (2007); Restle et al. (2007); Ribeiro et al. (2007); Rodrigues et al. (2007); Goulart et al. (2008)
2 Nellore: Chizzotti et al. (2005); Ezequiel et al. (2006a); Ezequiel et al.(2006b); Gesualdi Junior et al. (2006); Obeid et al. (2006); Silva et al. (2007); Coan et al. (2008);
Goulart et al. (2008).
unity and zero, respectively (P>.10), indicating that these
equations are not appropriate to predict dry matter intake
in tropical conditions. However, for the equation that
included metabolic body weight, the intercept did not differ
from zero and the slope did not differ from 1 (Table 6).
All equations resulted in an overprediction of dry matter
intake mean due to negative mean bias and location shift (u).
For both Zebu-Crosses and Nellore cattle, the prediction
equations that included metabolic body weight were more
precise. These equations had a slight advantage over the
equation using body weight if mean square prediction error,
mean absolute error, and mean bias were evaluated.
The partition of mean square prediction error into
three-components revealed that random errors appear to be the
major cause of inaccuracy in the dry matter intake prediction.
Additionally, equation 2.2 for Nellore cattle, which did not
include metabolic body weight, had a mean bias value larger
than 37% of the observed dry matter intake mean . Yungblut
et al. (1981) considered a mean bias smaller than 10% of the
actual dry matter intake mean as acceptable; this condition
was in agreement for equations 1.1; 1.2 and 2.1, which had
values of, 0.003; 4.745 and 9.096% respectively.
When the correlation concordance coefficient (r, u and
Cb), which consists of a measure of precision and accuracy,
was analyzed, the best fitting equation to dry matter intake
prediction was those including metabolic body weight in
the model. The equation used for dry matter intake prediction
of Zebu-crosses beef cattle had a location shift (u) close to
zero, and a bias correction (Cb) very close to 1, as well as
a high r, indicating that this was the most precise and
accurate model.
Conclusions
A single equation should not be used to predict dry
matter intake for beef cattle in tropical conditions, because
there are differences between Zebu and Zebu-crosses.
Equations that include average daily gain and metabolic
body weight should be used as an alternative method to
predict dry matter intake of Zebu-crosses and Nellore beef
cattle in tropical conditions.
References
AFERRI, G.; LEME, P.R.; SILVA, S.L. et al. Desempenho e características de carcaça de novilhos alimentados com dietas contendo diferentes fontes de lipídios. Revista Brasileira de Zootecnia, v.34, n.5, p.1651-1658, 2005.
ALBUQUERQUE, S.G. C a n a - d e - a ç ú c a r , p a l h a d e f e i j ã o e silagem de sorgo em associação com melaço-uréia para novilhos em confinamento. 1972. 41f. Dissertação (Mestrado em Zootecnia) - Universidade Federal de Viçosa, Viçosa, MG. ALLEONI, G.F.; BOIN, C.; BEISMAN, D.A. Utilização de diferentes
suplementos no desempenho de bovinos alimentados com dietas básicas de cana-de-açúcar. Boletim de Indústria Animal, v.63,
p.165-175, 2006.
ARCHER, J.A.; RICHARDSON, E.C.; HERD, R.M. et al. Potential for selection to improve efficiency of feed use in beef cattle: a review. Australian Journal of Agricultural Research, v.50, n.2, p.147-162, 1999.
BACKES, A.A. Composição corporal e exigências de energia, p r o t e í n a e m a c r o e l e m e n t o s m i n e r a i s , p a r a b o v i n o s mestiços leiteiros e zebu, castrados, em fase de recria e e n g o r d a , e m c o n f i n a m e n t o. 2003. 100f. Tese (Doutorado em Zootecnia) - Universidade Federal de Viçosa, Viçosa, MG. CHIZZOTTI, F.H.M.; PEREIRA, O.G.; VALADARES FILHO, S.C.
et al. Consumo, digestibilidade total e desempenho de novilhos Nelore recebendo dietas contendo diferentes proporções de silagens de Brachiaria b rizantha cv. Marandu e de sorgo. Revista Brasileira de Zootecnia, v.34, n.6, p.2427-2436, 2005.
Item Genetic group
Zebu-crosses Nellore
Eq. 1.1 Eq. 1.2 Eq. 2.1 Eq. 2.2
Intercept (a) 0.568 ± 0.587 0.671 ± 0.569 -2.769 ± 2.418 -2.111 ± 2.177 Slope (b) 0.930 ± 0.077 0.891 ± 0.073 1.276 ± 0.269 1.145 ± 0.231
P value (Ho:a=0 & b=1) 0.780 0.061 0.186 0.001
r2 0.498 0.504 0.349 0.362
Root MSE, kg 1.102 1.095 1.025 1.015
Mean absolute error |Y - X|, kg 0.872 0.922 0.853 1.052
Mean bias (Y - X) -0.006 -0.244 -0.317 -0.757
Mean square error of prediction, kg2 1.194 1.250 1.106 1.543 MSEP decomposition
Mean bias, % 0.003 4.745 9.096 37.123
Systematic bias, % 0.560 1.413 2.223 0.569
Random errors, % 99.437 93.842 88.681 62.308
Concordance correlation coefficient (CCC)
R 0.680 0.681 0.428 0.385
Location shift (u) -0.004 -0.177 -0.373 -0.836
Bias correction (Cb) 0.963 0.960 0.724 0.639
CHIZZOTTI, M.L. Exigências nutricionais de bovinos nelore, puros e cruzados, de diferentes classes sexuais. 2007.
118f. Tese (Doutorado em Zootecnia) - Universidade Federal de Viçosa, Viçosa, MG.
COAN, R.M.; REIS, R.A.; RESENDE, F.D. et al. Viabilidade econômica, desempenho e características de carcaça de garrotes em confinamento alimentados com dietas contendo silagem de capins tanzânia ou marandu ou silagem de milho. R e v i s t a Brasileira de Zootecnia, v.37, p.311-318, 2008.
DRAPER, N.R.; SMITH, H. Applied regression analysis. 2.ed.
New York: John Wiley & Sons Co., 1981. 709p.
EZEQUIEL, J.M.B.; SILVA, L.D.F.; AZEVEDO, P.S. et al. Uso da cutina na estimativa das digestões total e parcial de alguns componentes de rações contendo diferentes fontes de nitrogenio, em bovinos. Revista Brasileira de Zootecnia, v.35, n.2, p.600-606, 2006a.
EZEQUIEL, J.M.B.; SILVA, O.G.C.; GALATI, R.L. et al. Desempenho de novilhos Nelore alimentados com casca de soja ou farelo de gérmen de milho em substituição parcial ao milho moído. Revista Brasileira de Zootecnia, v.35, n.2, p.569-575, 2006b.
FATURI, C.; EZEQUIEL, J.M.B.; FONTES, N.A. et al. Fibra solúvel e amido como fontes de carboidratos para terminação de novilhos em confinamento. Revista Brasileira de Zootecnia, v.35, n.5, p.2110-2117, 2006.
FERNANDES, A.R.M.; HENRIQUE, W.; SAMPAIO, A.A.M. et al. Avaliação econômica e desempenho de machos e fêmeas Canchim confinados, recebendo dietas com silagem de milho ou com cana-de-açúcar e grãos de girassol. Revista Brasileira de Zootecnia, v.34, n.4, p.855-864, 2007.
FERNANDES, H.J. Desempenho produtivo, digestibilidade e composição corporal de bovinos de três grupos genéticos na recria e na terminação. 2001. 72f. Dissertação (Mestrado
em Zootecnia) - Universidade Federal de Viçosa, Viçosa, MG. FOX, D.G.; JOHNSON, R.R.; PRESTON, R.L. et al. Protein and
energy utilization during compensatory growth in beef cattle.
Journal of Animal Science, v.34, p.310-318, 1972. GALVÃO, J.G.C. Estudo da eficiência nutritiva, características
e composição física da carcaça de bovinos de três grupos raciais, abatidos em três estágios de maturidade. 1991. 82f. Dissertação (Mestrado em Zootecnia) - Universidade Federal de Viçosa, Viçosa, MG.
GESUALDI JR., A. Níveis de concentrado na dieta de novilhos F 1 L i m o u s i n x N e l o r e e m c o n f i n a m e n t o: desempenho produtivo e características de carcaça. 1999. 62f. Dissertação (Mestrado em Zootecnia) - Universidade Federal de Viçosa, Viçosa, MG.
GESUALDI JR., A.; QUEIROZ, A.C.; RESENDE, F.D. et al. Desempenho produtivo e eficiência bioeconômica de bovinos Nelore e Caracu selecionados para peso aos 378 dias de idade recebendo alimentação à vontade ou restrita. R e v i s t a B r a s i l e i r a d e Z o o t e c n i a, v.35, n.2, p.576-583, 2006. G O U L A R T , R . S . ; A L E N C A R , M . M . ; P O T T , E . B . e t a l .
Composição corporal e exigências líquidas de proteína e energia de bovinos de quatro grupos genéticos terminados em confinamento. Revista Brasileira de Zootecnia, v.37, n.5,
p.926-935, 2008.
HENRIQUE, W.; BELTRAME FILHO, J.A.; LEME, P.R. et al. Avaliação da silagem de grãos de milho úmido com diferentes volumosos para tourinhos em terminação . Desempenho e características da carcaça. Revista Brasileira de Zootecnia, v.36, n.1, p.183-190, 2007.
JONES, S.D.M. Carcass tissue yield and distribution in three biological types of cattle fed grain or forage based diets.
Canadian Journal of Animal Science, v.65, p.363-372, 1985.
JORGE, A.M. G a n h o d e p e s o , c o n v e r s ã o a l i m e n t a r e características da carcaça de bovinos e bubalinos. 1993. 97f. Dissertação (Mestrado em Zootecnia) - Universidade Federal de Viçosa, Viçosa, MG.
KOLATH, W.H.; KERLEY, M.S.; GOLDEN, J.W. et al. The relationship between mitochondrial function and residual feed intake in Angus steers. Journal of Animal Science, v.84, p.861-865, 2006.
LEONEL, F.P. Exigências nutricionais em macronutrientes minerais (Ca, P, Mg, Na e K) para novilhos de diferentes grupos zootécnicos. 2003. 53f. Dissertação (Mestrado em Zootecnia) - Universidade Federal de Viçosa, Viçosa, MG. LIN, L.I.K. A concordance correlation coefficient to evaluate
reproducibility. Biometrics, v.45, p.255-268, 1989. LORENZONI, W.R. E s t u d o s s o b r e e f i c i ê n c i a n u t r i t i v a e
qualidade da carcaça de diverso genéticos de bovídeos. 1984. 51f. Dissertação (Mestrado em Zootecnia) - Universidade Federal de Viçosa, Viçosa, MG.
MACITELLI, F.; BERCHIELLI, T.T.; MORAIS, J.A.S. et al. Desempenho e rendimento de carcaça de bovinos mestiços alimentados com diferentes volumosos e fontes protéicas.
Revista Brasileira de Zootecnia, v.36, n.6, p.1917-1926, 2007
MALDONADO, F.; QUEIROZ, A.C.; ALLEONI, G.F. et al. Desempenho e características da carcaça de bovinos de dois grupos genéticos, terminados em confinamento e abatidos com diferentes pesos. Boletim de Indústria Animal, v.64, p.9-18, 2007.
MARCONDES, M.I. D e s e m p e n h o d e b o v i n o s n e l o r e alimentados individualmente ou em grupo, exigências n u t r i c i o n a i s e a v a l i a ç ã o p r o t é i c a d e a l i m e n t o s p a r a ruminantes. 2007. 152f. Dissertação (Mestrado em Zootecnia)
- Universidade Federal de Viçosa, Viçosa, MG.
MARCONDES, M.I. E x i g ê n c i a n u t r i c i o n a i s e a v a l i a ç ã o econômica de bovinos Nelore, Angus e Nelore-S i m e n t a l e m d i e t a s c o m a l t o o u b a i x o n í v e l d e c o n c e n t r a d o. 2010. Tese (Doutorado em Zootecnia) -Universidade Federal de Viçosa, Viçosa, MG.
MARGON, A.L. Requerimento de macrominerais (Ca, P, Mg, Na e K) para engorda de novilhos Zebu. 1981. 74f. Dissertação (Mestrado em Zootecnia) - Universidade Federal de Viçosa, Viçosa, MG.
MAYER, D.G.; BUTLER, D.G. Statistical validation. Ecological m o d e l l i n g, v.68, p.21-32, 1993.
MAYER, D.G.; STUART, M.A.; SWAIN, A.J., 1994. Regression of real-world data on model output: an appropriate overall test of validity. Agricultural Systems, v.45, p.93-104, 1994.
MENDES, A.R.; EZEQUIEL, J.M.B.; GALATI, R.L. et al. Desempenho, parâmetros plasmáticos e características de carcaça de novilhos alimentados com farelo de girassol e diferentes fontes energéticas, em confinamento. R e v i s t a Brasileira de Zootecnia, v.34, n.2, p.692-702, 2005. MENEZES, L.F.G.; RESTLE, J. Desempenho de novilhos de gerações
avançadas do cruzamento alternado entre as raças charolês e nelore, terminados em confinamento. Revista Brasileira de Zootecnia, v.34, n.6, p.1927-1937, 2005.
MERTENS, D.R. Regulation of forage intake. In: FAHEY JR., G.C.; COLLINS, M.; MERTENS, D.R. et al. (Eds.) Forage quality, e v a l u a t i o n a n d u t i l i z a t i o n. Madison: American Society of Agronomy, Crop Science of America, Soil Science of America, p.450-493, 1994.
MIRANDA. E.N. C o m p o s i ç ã o c o r p o r a l e e x i g ê n c i a s d e macroelementos minerais (Ca, P, Mg, Na, e K) de bovinos Nerole e Caracu selecionados para peso aos 378 dias de idade. 2005. 86f. Dissertação (Mestrado em Zootecnia) -Universidade Federal de Viçosa, Viçosa, MG.
NEUMANN, M.; MUHLBACH, P.R.F.; NORNBERG, J.L. Efeito do tamanho de partícula e da altura de colheita das plantas de milho (Zea mays L.) para ensilagem na produção do novilho superprecoce. Revista Brasileira de Zootecnia, v.36, n.5, p.1614-1623, 2007 (supl.).
NATIONAL RESEARCH COUNCIL - NRC. Beef cattle. In:
P r e d i c t i n g f e e d i n t a k e o f f o o d - p r o d u c i n g a n i m a l s.
Washington, D.C., 1987. p.56-74.
OBEID, J.A.; PEREIRA, O.G.; PEREIRA, D.H.; et al. Níveis de proteína bruta em dietas de bovinos de corte: consumo, digestibilidade e desempenho produtivo. Revista Brasileira de Zootecnia, v.35, n.6, p.2434-2442, 2006.
OLIVEIRA, S.R. Desempenho e características da carcaça de n o v i l h o s N e l o r e n ã o c a s t r a d o s. 1998. 58f. Dissertação (Mestrado em Zootecnia) - Universidade Federal de Viçosa, Viçosa, MG.
PACHECO, P.S.; RESTLE, J.; SILVA, J.H.S. Desempenho de novilhos jovens e superjovens de diferentes grupos genéticos terminados em confinamento. Revista Brasileira de Zootecnia, v.34, n.3, p.963-975, 2005.
PAIXÃO, M.L.; VALADARES FILHO, S.C.; LEÃO, M.I. et al. Uréia em dietas para bovinos: consumo, digestibilidade dos nutrientes, ganho de peso, características de carcaça e produção microbiana.
Revista Brasileira de Zootecnia, v.35, n.6, p.2451-2460,
2006.
PAULINO, M.F. Composição corporal e exigências de energia proteína e macroelementos minerais (Ca, P, Mg e K) de bovinos não castrados de quatro raças zebuínas. 1996. 80f. Tese (Doutorado em Zootecnia) - Universidade Federal de Viçosa, Viçosa, MG.
PAULINO, P.V.R. D e s e m p e n h o , c o m p o s i ç ã o c o r p o r a l e exigências nutricionais de bovinos Nelore de diferentes classes sexuais. 2006. 183f. Tese (Doutorado em Zootecnia) -Universidade Federal de Viçosa, Viçosa, MG.
PAULINO, P.V.R. Exigências nutricionais e validação da seção HH para predição da composição corporal de zebuínos. 2002. 150f. Dissertação (Mestrado em Zootecnia) - Universidade Federal de Viçosa, Viçosa, MG.
PEREIRA, E.M.; SANTOS, F.A.P.; NUSSIO, L.G. et al. Estimativa de energia metabolizável de rações com polpa cítrica em substituição ao milho para tourinhos em terminação. Revista Brasileira de Zootecnia, v.36, n.1, p.216-224, 2007. PERON, A.J. Características e composição física e química,
corporal e da carcaça de bovinos de cinco grupos genéticos, submetidos a alimentação restrita e “ad libitum”. Viçosa, MG: Universidade Federal de Viçosa, 1991. 126f. Dissertação (Mestrado em Zootecnia) - Universidade Federal de Viçosa, 1991. PICARD, R.R.; COOK, R.D. Cross-validation of regression models.
Journal of the American Statistical Association, v.79, p.575-583, 1984.
PITTROFF, W.; KOTHMANN, M.M. Quantitative prediction of feed intake in ruminants II. Conceptual and mathematical analysis of models for cattle. Livestock Production Science, v.71, p.151-169, 2001.
PLEGGE, S.D.; GOODRICH, R.D.; HANSEN, S.A. et al. Predicting dry matter intake of feedlot cattle. Minnesota, 1984. 56p. PUTRINO, S.M. Exigências de proteína e energia líquidas para
o ganho de peso de tourinhos das raças Nelore e Brangus alimentados com dietas com diferentes proporções de concentrado. 2002. 82f. Dissertação (Mestrado em Zootecnia - Qualidade e Produtividade Animal) - Universidade de São Paulo, Pirassununga.
RESENDE, F.D. A v a l i a ç ã o d e d i f e r e n t e s p r o p o r ç õ e s d e volumoso: concentrado sobre a ingestão, digetibilidade, ganho
de peso e conversão alimentar de bovinos mestiços confinados. 1999. 78f. Tese (Doutorado em Zootecnia) - Universidade Federal de Viçosa, Viçosa, MG.
RESTLE, J.; PACHECO, P.S.; ALVES FILHO, D.C. et al. Silagem de diferentes híbridos de milho para produção de novilhos superjovens. Revista Brasileira de Zootecnia, v.35, n.5, p.2066-2076, 2006.
RIGUEIRA, J.P.S. Silagem de soja na alimentação de bovino de corte. Viçosa, MG: Universidade Federal de Viçosa, 2007. 63f. Dissertação (Mestrado em Zootecnia) - Universidade Federal de Viçosa, 2007.
RODRIGUES, K.K.N.L.; ROSSI JR., P.; MOLETTA, J.L. et al. Avaliação do desempenho de bovinos mestiços Purunã alimentados com diferentes níveis de energia. B o l e t i m d e Indústria Animal, v.64, p.241-247, 2007.
ROSELER, D.K.; FOX, D.G.; CHASE, L.E. et al. Development and evaluation of equations for prediction of feed intake for lactating Holstein dairy cows. Journal of Dairy Science, v.80, p.878-893, 1997.
SALVADOR, M. Exigência de energia e proteína para engorda de novilhos azebuados. 1980. 70f. Dissertação (Mestrado em Zootecnia) - Universidade Federal de Viçosa, Viçosa, MG. SHAH, M.A.; MURPHY, M.R. Development and evaluation of models
to predict the feed intake of dairy cows in early lactation.
Journal of Dairy Science, v.89, p.294-306, 2006.
SILVA, B.C.; PEREIRA, O.G.; PEREIRA, D.H.; et al. Consumo e digestibilidade aparente total dos nutrientes e ganho de peso de bovinos de corte alimentados com silagem de Brachiaria brizantha
e concentrado em diferentes proporções. Revista Brasileira de Zootecnia, v.34, n.3, p.1060-1069, 2005.
SILVA, F.F. Desempenho, características de carcaça, composição corporal e exigências nutricionais (de energia, proteína, aminoácidos e macrominerais) de novilhos Nelore, nas fases de recria e engorda, recebendo diferentes níveis de concentrado e proteína. 2001. 211f. Tese (Doutorado em
Zootecnia) - Universidade Federal de Viçosa, Viçosa, MG. SILVA, S.L.; LEME, P.R.; PUTRINO, S.M. et al. Milho grão seco e
úmido e sais de cálcio de ácidos graxos para novilhos nelore em confinamento. Revista Brasileira de Zootecnia, v.36, p.1426-1434, 2007.
SOUZA, V.G.; PEREIRA, O.G.; VALADARES FILHO, S.C. et al. Efeito da substituição de pré-secado de capim-tifton 85 por silagem de sorgo no consumo e na digestibilidade dos nutrientes e no desempenho de bovinos de corte. Revista Brasileira de Zootecnia, v.35, n.6, p.2479-2486, 2006.
SOUZA, V.G.; PEREIRA, O.G.; VALADARES FILHO, S.C.; Efeito da substituição de feno de capim-tifton 85 por silagem de milho no consumo, na digestibilidade dos nutrientes e no desempenho de novilhos mestiços Limousin. R e v i s t a B r a s i l e i r a d e Zootecnia, v.35, n.5, p.2172-2178, 2006.
ST-PIERRE, N.R. Invited review: Integrating quantitative findings from multiple studies using mixed model methodology. Journal of Dairy Science, v.84, p.741-755, 2001.
TEDESCHI, L.O. Assessment of the adequacy of mathematical models: Review. Agricultural Systems, v.89, p.225-247, 2006. TEIXEIRA, J.C. Exigências de energia e proteína, composição e área corporal e principais corte de carcaça em seis grupos g e n é t i c o s d e b o v í d e o s. 1984. 94f. Tese (Doutorado em Zootecnia) - Universidade Federal de Viçosa, Viçosa, MG. THORNTON, J.H.; OWENS, E.N.; GILL, D.R. Feed intake by feedlot
beef steers: Influence of initial weight and time on feed.
Oklahoma Agricultural Experiment Station Reseacrh R e port MP-117, 320, 1985.
VELOSO, C.M. Composição corporal e exigências nutricionais de bovinos F1 Limousin × Nelore alimentados com rações contendo diferentes níveis de concentrado. 2001. 109f. Tese (Doutorado em Zootecnia) - Universidade Federal de Viçosa, Viçosa, MG.
VÉRAS, A.S.C. C o n s u m o , d i g e s t i b i l i d a d e , c o m p o s i ç ã o e exigências nutricionais de bovinos Nelore alimentados com rações contendo diferentes níveis de concentrado.
2000. 166f. Tese (Doutorado em Zootecnia) - Universidade Federal de Viçosa, Viçosa, MG.
VIEIRA, B.R. S i l a g e m d e c a p i m - m o m b a ç a e m d i f e r e n t e s p r o p o r ç õ e s n a d i e t a d e b o v i n o s d e c o r t e. 2007. 83f. Dissertação (Mestrado em Zootecnia) - Universidade Federal de Viçosa, Viçosa, MG.
YUNGBLUT, D.H.; STONE, J.B.; MACLEOD, G.K. et al. The testing of several feed intake prediction equations using farm data.