MOZART ALVES FONSECA
EVALUATION AND DEVELOPMENT OF MATHEMATICAL MODELS TO EXPLAIN BEEF CATTLE GROWTH, AND ITS RELATIONSHIP WITH NUTRITIONAL REQUIREMENTS OF F1 NELLORE X ANGUS BULLS AND
STEERS
Thesis submitted to the Universidade Federal de Viçosa and Office of Graduate Studies in Animal Science as partial fulfillment of the requirements for the degree of Doctor Scientiae.
VIÇOSA
iii
DEDICATION
iv
ACKNOWLEDGEMENTS
To God and my family for all unrestricted love and support.
To Universidade Federal de Viçosa, for my education, in especial to the Department of Animal Science for the 10 years of buildup knowledge acquired.
To Texas A&M University for all support during the exchange collaborative research program.
To Conselho Nacional de Desenvolvimento Científico e Tecnológico (CNPq), for all scholarship and provided support.
To Coordenação de apoio a Pesquisa no Estado de Minas Gerais (FAPEMIG) for the funding, support and believe in our research.
To Instituto Nacional de Ciência e Tecnologia – Ciência Animal (INCT-CA) for funding, support and believe in our research.
To my parents, siblings, nephews and Geraldo Araújo.
To Prof. Dr. Sebastião de Campos Valadares Filho for the friendship, example, dedication, teaching, patience, confidence, guidance and feeling, providing me the best opportunities.
To Prof. Dr. Luis Orlindo Tedeschi for the friendship, ethics, vision, partnership and for putting me back on track in the right moment and way.
To Prof. Dr. Mario L. Chizzotti and family for the friendship, delight, good social interaction, and for giving me the first opportunity as an intern at the very first day in college.
To Prof. Dr. Mário Paulino, for the advices, sharing and care with my education.
To Prof. Dr. André Soares de Oliveira for friendship, teaching and for inspired me through the rough road of science.
To the Tedeschi family (Eloisa, Nicole and Luis) for the excellent moments, food, extra pounds added to the body and for having me among them making me feel less distant from my home.
v To all Department of Animal Science staff that in one way or another have always helped me: Joélcio, Zé Geraldo, Marcelo, Pum, Vanor, Zé Antônio, Monteiro, Fernando, Raimundo, Vera, Valdir, Adilson, Celeste, Rosana, Márcia, Mário, Venâncio and Cleone.
To my always stepsister Luciana Lacerda for her patience and for always believe on me regardless of my absences.
To my very ophidian friends to had shared tons of intense reflection with always synapses going on at the speed of light: Analivia Barbosa, Ivann, Isis Lazzarini, and João Paulo Monnerat.
To my great friends Daniel Abreu, Gilson Regadas, Michele Nascimento, Pedro Benedeti, Rafael Mezzomo and Simone Frotas for every single thing.
To my SIMCORTE friends and fellows: Karla, Fred, Marcos, Mario, Pedrao, Livinha, Laura and Aline.
To my interns, workmates and friends, whom were essential parts making all of it being possible: Marcelo Grossi, Faider Alberto, Leandro Silva, Jarbas Miguel, and Danillo Sathler.
vi
BIOGRAPHY
MOZART ALVES FONSECA, son of Mozart Dias da Fonseca and Roseli Alves da Fonseca was born in São Gonçalo do Sapucaí, Minas Gerais, in February 7th 1983. In January 2008, graduated in Agronomic Engineering from Universidade Federal de Viçosa.
In February 2008, started the Master’s program at the Department of Animal Science of the Universidade Federal de Viçosa focusing his research in Ruminant Nutrition and Beef Cattle Production, submitting to thesis defense in July 29th of 2009.
In August 2009, started the Doctorate program at the Department of Animal Science of the Universidade Federal de Viçosa focusing his research in Ruminant Nutrition and Beef Cattle Production.
In March 2011, started collaborative research at Texas A&M University through the sandwich program under the guidance of Dr. Luis Orlindo Tedeschi, focusing his research in Mathematical Modeling and Model Evaluation for Ruminants.
vii
TABLE OF CONTENTS
Página
ABSTRACT... viii
RESUMO... xi
INTRODUCTION... 1
References... 8
Chapter I - Relativeness of performance and efficiency in F1 Nellore x Angus bulls and steers... 9
Abstract... 10
Introduction... 11
Material e Methods... 12
Results and Discussions... 17
Implications... 25
References... 26
Chapter II - Energy and protein requirements of young finished F1 Nellore × Angus... 35
Abstract... 36
Introdução... 37
Material e Métodos... 37
Resultados e Discussões... 43
Conclusões... 51
Literatura Citada... 52
Chapter III - Evaluation of predictive equations developed to assess body composition in beef cattle using F1 Nellore x Angus bulls and steers... 61
viii
Introduction... 63
Material and Methods... 64
Results... 68
Discussion... 76
Conclusion... 80
References... 82
Chapter IV - Evaluation of prediction equations developed to assess body composition in beef cattle through the use of biometrical measurements…. 98 Abstract…………..………..………. 99
Introduction ………..………. 100
Material and Methods ……….………... 101
Results ………..………...………. 106
Discussion………….………..……….. 111
Conclusions………..………... 118
References………...……….. 119
Chapter V - Biometric measurements: a tool to assess body fat compositionin beef cattle……….. 148
Abstract………. 149
Introduction………... 150
Material and methods………...………. 151
Results, discussion and considerations………..……… 158
References...………... 171
GENERAL CONCLUSIONS... 185
ix
ABSTRACT
FONSECA, Mozart Alves, D.Sc., Universidade Federal de Viçosa, August, 2013. Evaluation and development of mathematical models to explain beef cattle growth, and its relationship with nutritional requirements of F1 Nellore x Angus bulls and steers. Adviser: Sebastião de Campos Valadares Filho. Co-advisers: Luis Orlindo Tedeschi and Mario Luiz Chizzotti.
xii
RESUMO
FONSECA, Mozart Alves, D.Sc., Universidade Federal de Viçosa, agosto de 2013. Avaliação e desenvolvimento de modelos matemáticos para explicar o crescimento de bovinos de corte, e sua relação com os requirementos nutricionais de animais F1 Nelore x Angus inteiros e castrados. Orientador: Sebastião de Campos Valadares Filho. Coorientadores: Luis Orlindo Tedeschi e Mario Luiz Chizzotti.
1 INTRODUCTION
The word efficiency denotes, in general, the extension in which a resource is
utilized to perform a task, job or purpose. The obtained result takes into account, as
parameter, a prior connection with the losses inherent to the transformation
processes (inputs/outputs). As every other field of science, animal nutrition has its
own definition of efficiency, and for that, the focus of its understanding should be
driven to explain the quantitative ratios between outputs and inputs used to express
the results of the system’s performance. After several years of research, it has been
reported several ratios or indexes to express animal production. These coefficients
will typically either be smaller or greater than one, but it does not necessarily imply
energy generation or loss; instead transformation in its conceptual form, related to
products of human interest. The first law of thermodynamics that describes the
changes in the total energy of the universe can be used to explain such processes.
Being forms of energy altered by changing its physical and/or chemical
compositions (Metzler and Metzler, 2003; Nelson and Cox, 2011).
The point is, in animal nutrition, every efficiency carries alongside its
reciprocal, the inefficiency, and should actually be understood as a time changing
transformation process in which every unity of animal product not been formed
represents a migration of the energy towards the trophic levels, and not just product
being randomly lost. The consequences will reflect on system’s stability whether in
productivity levels, profitability, or environmental concerns.
The intake of energy is directly related to its ingestion and absorption
(Darnell, 1968). The non-utilized energy for production is assumed to be energy
2 energy accumulated (gain) is measured as growth (final – initial) and is just a
fraction of the real energetic input of the system.
Bioenergetics brought the same concepts paraphrased as respiration while
related to what has been excreted. In this context, respiration can be understood as a
fraction of the energy present in feedstuffs not harnessed, and being dependent of
level of animal production, within its rumen microbes metabolism, whether aerobic
or anaerobic (Hungate, 1966).
The energy going through the system follows the thermodynamic laws
dealing with measurable variables having numerical values and exclusively
determined by the state of the system in question (Metzler and Metzler, 2003). The
system is part of the physical universe of the observer’s interest, which is delimited
by borders that represent its limit with the environment (Bergethon, 2010). Thus,
system and environment, together, will form the universe (Metzler and Metzler,
2003; Nelson and Cox, 2011). It follows the classical energy flow system explained
3 Figure 1 – Energy flow scheme (Adapted from Odum, 1968)
The above energy flow represents the theoretical model of energy behavior proposed
by (Odum, 1968). It represents all live component whether individual (i.e. animal),
population (i.e. feedlot group) or trophic level (i.e. meat being available for human
consumption). The acronyms are energetic inputs (I) (i.e., dry matter intake),
production (P), respiration (R), biomass (B), non-utilized energy (NU), assimilated
energy (A), growth (G), excretion (E) and retention (S).
Odum (1968) describes each sub-compartment of the model as having its
own biological meaning. Energy in its primarily state (Gross energy) would enter
representing the summation of P and R, or with part being retained, which will be
transformed in this very environmentand the remaining,the respiration, transformed
in the next compartment (universe), where energy can be utilized in the same trophic
level. The I of a system can be interpreted either as the amount of light that feeds an
4 production system. The B component can be understood as some variable passible of
measurement as body weight, body composition, retained protein, production, and
so forth. From the bioenergetics’ point of view, the energy is measured either in
calories or joules, and is related to body composition of an animal with energy
flowing through the system with an efficiency of use of the resources (input)
measured as ratios, coefficients, and yields in general.
Not all I is transformed into B, in that way, part of B passes through the
biological structure of an animal as happens with the feedstuff being consumed and
consequently manure being produced daily at the paddocks in a feedlot yard. This
feedstuff passes through the gastrointestinal tract suffering digestive action and then
it is eliminated without being fully digested. The portion utilized is assimilated or
retained (A) and the rest is discarded (NU). The relation A/NU represents the
concepts of a first form of measuring efficiency being modified along the way
depending on what kind of index it is being used in the current evaluation.
If the evaluated efficiency is the luminous energy fixation in a pasture
system, the output can be as low as 6% as observed in photosynthesis (Miyamoto,
1997), or if an a electric engine takes place in the evaluation that efficiency can be as
high as 99.99% (over 200 W of power). In this brief introduction and so forth in
these dissertation’ upcoming discussions, A should be understood as the assimilated
metabolizable energy, being passible of fractionation in P and R.
The fraction of the metabolizable energy which is lost as heat is the heat
increment or heat production, and it is represented by R in the diagram. The
assimilated or retained portion of A, represents the net energy required for gain and
it is designated by P in the diagram. This energy available in the sub-compartment P
represents the energy available for the next trophic level (i.e.: human consumption).
5 a superior animal. Yet, P can be fractionated in R (net energy required for
maintenance) and P (net energy required for production) and so forth (lower right
corner Figure 1). In climax populations and bigger organisms such animals, the
proportion of energy used for maintenance is higher compared to the active
populations of microorganisms which present a higher P instead. Thinking in
evolutionary terms, it becomes easy to understand that as bigger the animals are,
such as dinosaurs, it is more difficult to fill the maintenance requirements which
have to be fulfilled through diet. Even though if cataclysmic events had not come to
take place on Earth at the time, those animals would have to adapt decreasing their
body frame or would be led anyways to extinction since the efficiency of resources
used were small. The consequence is that, for large animals as dinosaurs, the
capacity of adaptation decreased lower than a simple strain of microorganisms.
Now comes the point of relevance, how is this related to beef cattle
production. The answer is in breeding programs that realized that animals were too
large, eating too much and not producing so well. So, smaller animals had become
important in detriment of those huge large continental breeds. Nellore cattle by itself
represent exactly this same picture in a different scenario. With smaller animals and
more efficient in using the resources available, Since 2004, Brazil has become the
largest exporter of meat and the main supplier of red meat protein in the world
(USDA-FAS, 2010) and holding the top positions ever since.
Thinking about animal product, the P component, is nothing more but the
summation of G, E and S. For example, in the case of biomass of body tissues:
weight gain, biometrical growth, milk production, wool production, and so forth it is
added to the system energy (G), part of it is retained, and the rest can be reutilized in
other conditions such as tissue mobilization during a negative energetic balance (S),
6 available for the next trophic levels as amino acids, sugars, urea, and so forth. The
point is that everything seems relative depending on the basis in which it is
compared, and every process in life follows a pattern, whether understood or not yet,
though eligible to be described. The point of trying to explain these chaotic
sequences of events is to improve human nutrition, therefore its path towards
evolution, and that has become an Animal Science responsibility. If there is a
pattern, phenomenon can be described and within the simulation of new possible
outcomes, nothing seems better than numbers to do so.
With all that been said, the only intent of the author within this discussion and
further dissertation, was to understand beef cattle growth towards as many different
points of view as science makes available to us. Therefore, the objectives of this
study conducted at the Department of Animal Science of the Universidade Federal
de Viçosa, were:
• Assess differences in intake, performance, efficiency, and carcass
characteristics of bovine F1 Angus x Nellore bulls and steers slaughtered at different
weights;
• Determine nutritional requirements for protein and energy of F1 Angus x
Nellore bulls and steers slaughtered at different weights;
• Evaluate the prediction of body composition using the 9-11th rib section
(Hankins & Howe) of F1 Angus x Nellore bulls and steers;
• Evaluate the former and current proposed models of the Brazilian system of
Nutrient Requirements of Zebu Beef Cattle BR-CORTE (Valadares Filho et al.,
2010; Valadares Filho et al., 2006), concerning beef cattle growth using an
independent dataset;
• Evaluate the use of different mathematical and biometric models to
7 • Develop mathematical models of biometric measurements that can be used
to predict the body composition of F1 Angus x Nellore bulls and steers;
The following chapters have been prepared in accordance with the standards
8 References
Bergethon, P. R. 2010. The Physical Basis of Biochemistry: The Foundations of
Molecular Biophysics. 2ª ed. Springer.
Darnell, R. M. 1968. Animal Nutrition in Relation to Secondary Production. An.
Zoologist 8: 83-93.
Hungate, R. E. 1966. The rumen and its microbes. Academic Press, New York.
Metzler, D. E., and C. M. Metzler. 2003. Biochemistry: the chemical reactions of
living cells. 2 ed. Academic Press.
Miyamoto, K. 1997. Biological energy production.
Nelson, D. L., and M. M. Cox. 2011. Princípios de Bioquímica de Lehninger. 5th ed. ARTMED.
Odum, E. P. 1968. Energy flow in Ecosystems: A Historical Review. An. Zoologist
8: 11-18.
USDA-FAS. Livestock and Poultry: World Markets and Trade. Foreign Agricultural
Service, United States Department of Agriculture, April 2010.
Valadares Filho, S. C., M. I. Marcondes, M. L. Chizzotti, and P. V. Paulino. 2010.
Nutrient Requeriment of Zebu Cattle - BR-CORTE. 2nd ed. Suprema
Gráfica Ltda, Viçosa, MG.
Valadares Filho, S. C., P. V. R. Paulino, and K. A. Magalhães. 2006. Exigências
nutricionais de zebuínos e tabelas de composição de alimentos - BR CORTE.
9 Chapter I
Relativeness of performance and efficiency in F1 Nellore x Angus bulls and
steers1
M. A. Fonseca2,*,†, S. C. Valadares Filho*, L. O. Tedeschi†, M. L. Chizzotti*
*
Federal University of Viçosa, Department of Animal Science, Viçosa, Minas
Gerais, Brazil 36570-000
†
Texas A&M University, Department of Animal Science, College Station, TX
77843-2471
1
This study and scholarship of the first author were supported by Conselho Nacional
de Desenvolvimento Científico e Tecnológico (CNPQ, Brazil), Fundação de
Amparo a Pesquisa no Estado de Minas Gerais (FAPEMIG) and Instituto Nacional
de Ciência e Tecnologia – Ciência Animal (INCT – Ciência Animal); 2
10 Relativeness of performance and efficiency in F1 Nellore x Angus bulls and
steers
M. A. Fonseca2,*, †, S. C. Valadares Filho*, L. O. Tedeschi†, M. L. Chizzotti* ABSTRACT: A comparative slaughter trial was conducted to determine possible
differences in growth and efficiency among 48 F1 Nellore x Angus bulls (B) and
steers (S). The animals had 12.5±0.51 mo of age, and average shrunk BW (SBW) of
233±23.5, and 238±24.6 kg for B and S, respectively. Animals were fed diet
containing 60:40 of corn silage:concentrate. Eight animals were slaughtered at the
beginning of the trial and the remaining animals were randomly assigned in a
factorial 2 (genders) x 3 (slaughter weights) arrangement. The remaining animals
were slaughtered when the average BW of de group reached 380 (n = 6B and 5S),
440 (n = 6B and 5S), and 500 kg (n = 5B and 5S). The emptied gastrointestinal tract,
organs, carcasses, heads, hides, tails, limbs, blood, and tissues were weighed to
determine the empty BW (EBW). The daily DMI and its nutrients partitioning were
used to compute efficiency indexes. Variance analysis was used to determine the
relationship between slaughter weights, gender, and their interaction on efficiency
traits. The analyses of all variables of interest were performed using the PROC
GLIMMIX of SAS (SAS Inst. Inc., Cary, NC) assuming a completely randomized
design with a 3 × 2 factorial arrangement of treatments. Except for mineral matter
intake and neutral detergent fiber corrected for ash and protein, it was not observed
gender effect (P>0.05) in any of the studied variables concerning the nutrient
intakes. Animal performance variables indicated significant gender effect (P<0.05)
on carcass, yield, and head, hide and feet proportions to EBW. For hot carcass yield
it was observed interaction effect (P<0.05) with 500 kg animals presenting a higher
yield. It was observed a gender effect on feed conversion,efficiency and partial
11 more efficient from the point of view of the efficiency of weight gain and relative
growth rate. Despite of the different slaughter weights the efficiencies maintained
their same behavior being higher for bulls, which means that from growth and body
composition points of more bulls should be explored laying diet manipulation
compensate for differences between fat proportions in the animals body.
Key Words: beef cattle, comparative slaughter, digestible energy, net energy, net
protein, nutritional requirements
1. Introduction:
There are several ways to express and measure efficiency. Feedstuff utilization and
growth-related body parts within their economic relevance are some of them. Each
measurement carries its own limitations and their use will be limited to whether or
not they will be applicable regarding its practicality or economic and biological
meaning.
The most widely used efficiency index has been the feed conversion ratio and its
reciprocal feed efficiency. Their simplicity makes them an easy and reproductible
index. Although, they do not take into account existent differences in maintenance
and growth requirements between animals. The point of using feed efficiency
indexes is that they might have a tremendous influence on the unit costs of
production. (Gibb and McAllister, 1999) have reported that a 5% improvement in
feed efficiency has an economic impact four times greater than a 5% improvement
in average daily gain. In addition, the cost of feed is second only to fixed costs in
importance to the profitability of commercial beef operations (Basarab, 1999) and
70-75% of the total dietary energy cost in beef production is used for maintenance
(Ferrell and Jenkins, 1985; NRC, 2000). Therefore information on at which point the
12 livestock production making the difference not only in profitability but in longevity
in the activity as well.
Thus, the aim with this work was to compare the intake, performance, feed
efficiency and carcass characteristics of three slaughter-weight based groups of F1
Nellore x Angus bulls and steers to understand differences in partial efficiencies
along with animals’ growth.
2. Material and Methods:
The dataset utilized was obtained at the Federal University of Viçosa, Brazil,
between December of 2009 and August of 2010. Laboratorial analyses were
performed at the Ruminant Nutrition Laboratory located at Department of Animal
Science, Federal University of Viçosa, Brazil.
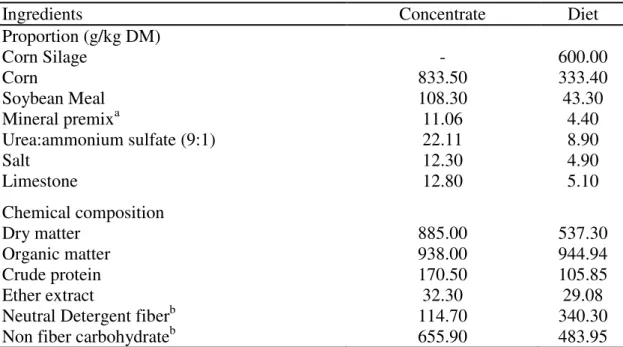
The diet was formulated according to Valadares Filho et al. (2006) to contain
11 % CP. Animals were fed a diet containing 60% corn silage and 40% concentrate.
The concentrate contained corn, soybean meal, urea, ammonium sulfate, sodium
chloride, limestone, and mineral mix (Table 1). Animals were fed either ad libitum (slaughter-weigh based groups) or at maintenance level (control).
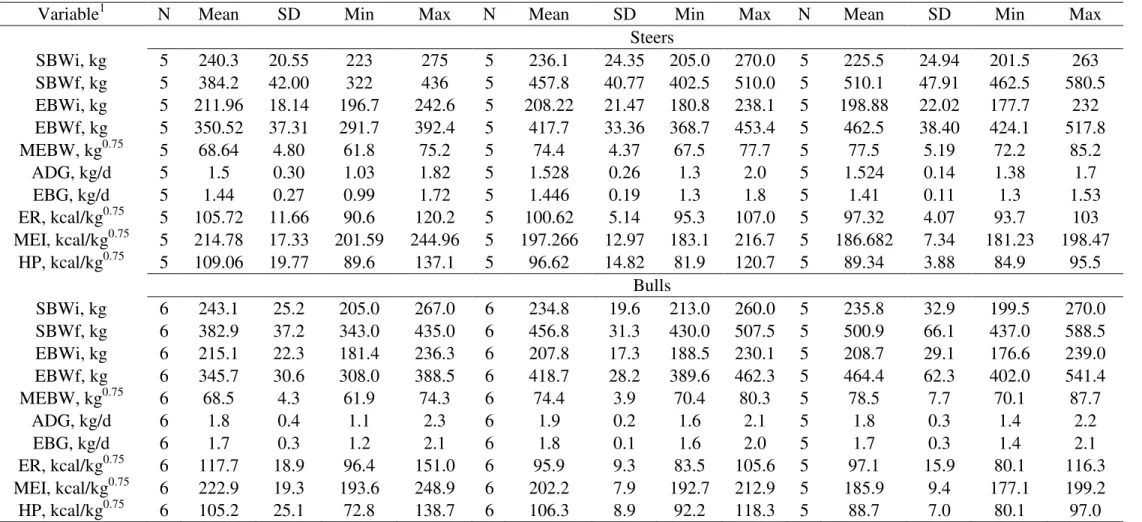
The dataset was composed by forty-eight F1 Nellore x Angus bulls (B) and steers
(S), with 12.5±0.51 mo old, and initial shrunk BW (SBW) of 233±23.5 and
238±24.6 kg for B and S, respectively. The trial was design in a completely
randomized 2 genders x 3 slaughter weights factorial arrangements of treatments.
The animals were randomly assigned into five slaughter groups based on weight:
baseline, maintenance, 380, 440, and 500 kg. The trial started after a 45 d of
adaptation (diet and facilities) period in which animals were fed with the same diet
used during the feeding trial. The experiment started at the baseline group’s
slaughter (n = 4 bulls and n = 4 steers). The other groups were slaughtered when the
13 (n = 6 bulls and n = 5 steers), and 500 kg (n = 5 bulls and n = 5steers). The
maintenance (n = 4 bulls and n = 4 steers) group was slaughtered at the same time as
the 500-kg’s group. The animals were housed in individual pens covered with
concreted floors, provided with feeders and concreted bunks, in a total available area
of 30 m2, of which 8 m2 were sheltered. Every 28 d period, for seven periods, the animals were weighed after a 16 to 18 h of feed withdrawal. With the weights, it was
obtained the average daily gain (ADG, kg/d), calculated by dividing the difference
between final and initial BW by the number of days in confinement.
The feed regime was twice daily (at 600 and 1600), fed as a total mixed ration and
daily adjusted to maintain orts up to 10% of the as-fed offered basis. Water was
permanently available.
The intake was measured and adjusted daily, with roughage, concentrate and orts
been collected, and properly identified and stored in a freezer at -20oC. At the end of each week, a composite sample was prepared and dried (60oC). Thereafter, another composite sample representing the 28 d period was performed, weighing based on
the proportion of DMI of each week period.
All samples, except those with less than 15% moisture, were air-dried in a forced
draft oven (60oC) and ground to pass a 1-mm screen in a Wiley mill (Model 4, Thomas scientific, Swedesboro, NJ 08085). Laboratory analyzes followed the
(AOAC, 2000) methods for DM (method 930.15), ash (method 942.05), fat (method
2003.05), CP (method 990.09), NDF (1-mm) with thermostable -amylase and
without sodium sulfite (Van Soest et al., 1991) corrected for ash and crude protein as
described by Licitra et al. (1996). Non-fiber carbohydrates (NFC) were calculated as
100 – [(%CP - %CP from urea + % of urea) + %NDF + %EE + %ash] (Hall, 2000)
14 NDF) + (NFC intake – fecal NFC) + [2.25 × (EE intake – fecal EE)] (Sniffen et al.,
1992). The summary of the analysis is described in Table 1.
During the trial two digestibility assays were performed to estimate the nutrient
digestibility coefficients. The metabolizable energy intake (MEI) was calculated by
multiplying the daily intake of each nutrient by its respective digestibility
coefficient, and then by 0.82 and 4.409. The 0.82 represents the conversion of
digestible energy (DE) into metabolizable energy (ME) as proposed by (NRC,
2000) and devised by (Tedeschi et al., 2002). The value 4.409 represent s the energy
content (Mcal) of 1 kg of TDN.
All slaughters followed the same procedure. The animals were fasted for 16 h before
the slaughter. At the chute the animals were desensitized with a non-penetrating
stunner and killed by exsanguination on the jugular vein using conventional humane
procedures. The gastro-intestinal tract (GIT) was cleaned and weighed with the
other organs to determine the empty BW (EBW). The difference between final and
initial EBW was used to estimate the empty body gain (EBG, kg/d). The relation
obtained by dividing EBW and shrunk BW (SBW) from the reference group was
used to estimate the EBW of the remaining animals. Carcasses were separated in
two halves and weighed (HCW), then chilled (1 to 4 oC) for 18 h and then re-weighed to obtain the chilled carcass weight (CCW). By dividing the carcasses
weights by the SBW, we obtained the hot (HCY, %) and cold (CCY, %) carcasses
yields. The hide and organs and viscera were weighed. Also the carcasses gains
(kg/d) were obtained by the difference between the final and initial hot (HCG) and
cold carcasses (CCG) weights, being the initial carcass weight estimated according
to the composition of the reference animals.
Several dimensionless ratios related to DMI were evaluated to attest efficiency, such
15 to DMI (EBGDMI), HCG related to DMI (HCGDMI), CCG related to DMI
(CCGDMI), ADG related to DMI in percentage of the BW (ADGDMIBW).
Furthermore, some noncarcass ratios were analyzed to justify whether or not
prediction equations to estimate those components would be applicable. The
analyzed ratios (%) were the weights (kg) of body parts related to EBW such as
organs and viscera (OVEBW), ratio between the hide weight related to the EBW
(HDEBW), ratio between the weight of the feet related to the EBW (FEBW), ratio
of the head related to EBW (HEBW).
2.1. Net energy:
The NEm was assessed by the intercept of the exponential equation of heat
production (HP) on MEI in a metabolic weight basis (kg0.75). No difference was observed neither for HP and MEI (P>0.05) between genders, nor the intercept of the fitted equations for bulls and steers so it was adopted a single value for NEm which
was calculated as 0.070 Mcal/kg0.75EBW/d (Chapter 2).
The NEg had gender effect (P<0.05) so two equations were adjusted separately, one
for bulls: RE (Mcal/d) = 0.0516 × EBW0.75 × EBG1.0992, and one for steers: RE (Mcal/d) = 0.0640 × EBW0.75× EBG1.0992.
From these values, it was calculated the net energy of the consumed diet (Mcal/kg)
for gain (DNEg) and maintenance (DNEm) according to (Zinn and Shen, 1998)
following the equations:
DNEm (Mcal/kgDM) = (-(0,877 x NEm + 0,41 x DMI + NEg) –((0,877 x NEm +
0,41 x DMI + NEg)2 – (4 × (-0,41 x NEm ) × (-0,877 x DMI)))0,5))/(2 ×(-0,877 x DMI))
16 Where DNEm is the net dietary energy intake used for maintenance, NEm is the net
energy required for maintenance, NEg is the net energy required for growth, DMI is
the dry matter intake, and DNEg is the net dietary energy intake used for gain.
2.2. Efficiency variables:
The tested parameters for feed efficiency were: FCR, FE, partial efficiency of
growth (PEG), maintenance efficiency (MnE), efficiency of weight gain (GnE),
relative growth rate (RGR), Kleiber index (IK) and residual feed intake (RFI).The
feed conversion ratio was obtained by dividing the DMI (kg/d) by the ADG(kg/d).
The average FE was obtained by the reciprocal of this relationship. The PEG was
estimated by dividing the average DMI for average daily intake for gain (Arthur et
al., 2001).
The efficiency of weight represents the animal's ability to use the metabolizable
energy required for weight gain was calculated by dividing ADG by the MEI
(Mcal/d). To calculate the relative growth rate (RGR), was take into account the
initial SBW (SBWi), final SBW (SBWf), and d of confinement as: RGR = 100 *
(log final BW - log LW)/d (Fitzhugh and Taylor, 1971). The KR was calculated
dividing the ADG by the average metabolic weight (Kleiber, 1936).
The RFI was calculated as the difference between the observed and predicted values
of DMI. Two RFIs were calculated, the RFIBRCORTE and RFI. The predicted values of DMI were generated either by the model of Valadares Filho et al. (2010) or by the
fitted equation using the observed DMI through the REG procedure of the SAS
statistical package (SAS Institute, 2009), following the model:
DMI = 0 + 1 × ((SBWf - SBWi)/2)0.75 + 2 × (ADG) + Where the random error, , represents the RFI.
17 Statistical analyses were performed using SAS (SAS Inst. Inc., Cary, NC). The
analyses of all variable of interest were performed by PROC GLIMMIX assuming a
completely randomized design with a 3 × 2 factorial arrangement of treatments (3
slaughter weights and 2 genders), as per the following statistical model:
= + + + +
where is the mean, is the effect of gender, is the effect of slaughter weight,
is the interaction effect of gender and slaughter weight, and is the random error.
Outliers were identified using the plot of studentized residuals against the predicted
values and Cook’s D coefficients (Neter et al., 1996). The least square means were
obtained using the LSMEANS statement. It was used the Tukey-Kramer test in the
contrast between the means of the variables of interest adopting 5% for the type I
error control.
3. Results and discussion:
Despite of fact that there was no effect in DMI, while plotting the DMI on time of
confinement, it was observed a quadratic effect of intake with point of maximum
around the 4th experimental period. At that point, only the heavier animals, 440 and 500 kg groups, animals were still on trial. The 380-kg group was slaughtered before
it reached the average maximum point of DMI. So every comparison in this paper
has to take into consideration its relationship with the design used instead of a
current growth behavior. In other words, the three groups were too heterogeneous
with 380 and 440 kg groups ranging their BW’s at about 100 kg (lighter and heavier
animals) and 500 kg ranging from a 150 kg. So the averages analyzed, were just
giving a clearly understanding of what might have happened concerning the
animals’ nutritional requirements, which was why this trial was designed for.
Furthermore, the means might not be the better measure of position while comparing
18 answer it better such questions while the objective is to evaluate the growth in its
classical approach. For the sake of this discussion, the mean still represents more the
variation between groups and less within. Thus, a crucial difference between
analyzing with the animals reaching the specific slaughter weight instead of using
the average of the group would generate regressions with less steeper slopes that
might be a constraint while encountering differences between the groups. The
second approach and the adopted one would allow inferring more about the animals’
physiological maturity.
With that stated, Table 2 shows the mean intake of the nutrients. There was no effect
of gender (P>0.005) in any of the studied variables. As expected, cattle fed at maintenance level had the lowest intake of all nutrients and was not taken into
account while comparing animals or contrasting treatments. The only evaluated
variables that presented significant effect on slaughter weight (P<0.05) were NDFap expressed either as in kg/d or in % of the BW, and mineral matter intake (MMI,
kg/d). The 500 kg group presented the highest means, not differing from the 440 kg
group. Clearly the animals were heavier and consuming more. Regarding the effect
of interaction between gender and slaughter weight, the only variables that presented
significant effect (P<0.05) were DE, expressed as % of the diet (Mcal/kg), and TDN, expressed as percentage of the DMI. The 380 group presented the higher DE,
for both genders, followed by the bulls from 440 group, and the steers from 500
group that was not different from the steers 440 and the bulls 500. The percentage of
TDN have shown a higher DM digestibility for the 380 group followed by the bulls
from the 440 which did not differ from the both 500 kg group. Those, in other hand,
did not differ from the 440 steers. In agreement of the higher means observed for DE
(Mcal/kg of the diet) and TDN (%), it is suggested that the 380 group being more
19 with a higher values of DE and TDN. This is probably due to the 380 groups being
more selective with the intake of concentrate concomitant with a slightly higher
digestibility proportionated by the smaller change in its ratio along with roughage
intake. In agreement with that hypothesis, the observed reduction of the intake after
it reached the maximum point of the adjusted quadratic equation seems to explain
the closer estimates of TDN (Table 2) of heavier animals and the animals from the
baseline groups. Baseline animals were under feed restriction and because of that
would slow down its passage rate in attempt to maximize the nutrient utilization,
presenting then a higher DM digestibility while comparing within the ad libitum animals. Since those animals where not different (P>0.05) from the heavier,
concerning DM digestibility, it seems that concentrate selection might have had
increased such parameters. It has been reported in the literature an increase in dry
matter intake with increasing levels of concentrate in the diet and some studies
showed positive linear responses (Marcondes, 2010), though what might have
happened here is more likely related to an almost subclinical difference in
concentrate due selectivity since the animals were fed a single same diet.
Table 3 shows the means and some efficiency ratios of body components of the
animals. Except for the relation EBW:SBW, there were no effects of interaction
between gender and slaughter weight (P>0.05) for any of the studied variables. The higher observed ratio was for the bulls 500 which did not differ from the bulls 440
or all steers. Yet, the steers did not differ from the lowest bulls 380 group, though
the last, in this trial, have shown the trend to have higher gut content proportionate
to its BW. The higher ratio EBW:SBW was attributed to a smaller intake for heavier
animals while plotting the all observed instead of group means. Probably due to a
20 the adipose tissue since its adipose-derived nature that would control the appetite,
energy control, and so forth (Brennan and Mantzoros, 2006).
As expected, baseline group had the lowest indexes and did not enter while
comparing the means of treatments. Separate effects of SBW and EBW presented,
obviously, only significant effect of slaughter weight (P<0.05), corroborating with the design intent. Another slaughter weight significant effect was CCY (P = 0.0082),
HDEBW (P = 0.0007), FEBW (P = 0.0001), HEBW (P = <0.0001). The 500 kg
animals, for both steers and bulls, presented a higher CCY, although did not differed
from the 440. That is likely due to the big range of weights observed within groups.
The HCY have shown an interaction effect of gender and slaughter weight. The
highest HCY observed was for the 500 kg bulls which did not differ from the 440 kg
or all steers, which did not differ among the own gender or the lighter 380 kg bulls.
In agreement, the 380 group presented a smaller CCY among all indicating the trend
of heavier carcasses pursue a higher yield. Concerning the noncarcass components
ratio it was observed that organs and viscera (OVEBW) have gender effect being
bulls presenting a smaller ratio compared to steers. After castration animals tend to
deposit more fat in internal depots while compared to bulls (Berg and Butterfield,
1976). The hide, feet and head grows in different proportions related to EBW. For
hide the 500 animals had the highest proportion, not differing from 440, with 380
presenting the lowest ratio. For feet, it was observed the inverse relation with the
380 animals heaving the higher proportion of feet related to EBW, not differing
from 440 and followed by 500. For the HEBW the effect is even more complex
since it combines gender and slaughter weight effects. The data says that bulls have
higher HEBW and a heavier head then steers, and lighter animals have the highest
HEBW followed by 440, which did not differ from the 500 group. That is mainly
21 protein deposition as shown in the models devised by Marcondes et al. (2010). For
all the non-differences between the 440 and 500 it might indicate that either the huge
range of weight is affecting the results or that variation in higher BW is very
smooth. Thus, that gives a hint why the models devised by (Marcondes et al., 2010)
to estimate the noncarcass chemical composition did not explained the variation in
chemical composition hereby observed. The equations developed were clearly
accounting for just linear effects between body parts and this dataset shows that
there is an allometric relation of growth between components and EBW. Even
though, assuming that accretion of chemical components follows an isometric
relation with growth, seems unlikely that chemical composition would be deposit
always at the same ratio along the growth curve. Starting with the OVEBW this
dataset suggests that there are differences between genders related to it so prediction
equations should account for at least gender effects, which was observed by
Marcondes et al. (2010). Also the authors reported a 23% difference between
genders regarding EE rate of deposition in the visceral fat depot. That rate seems to
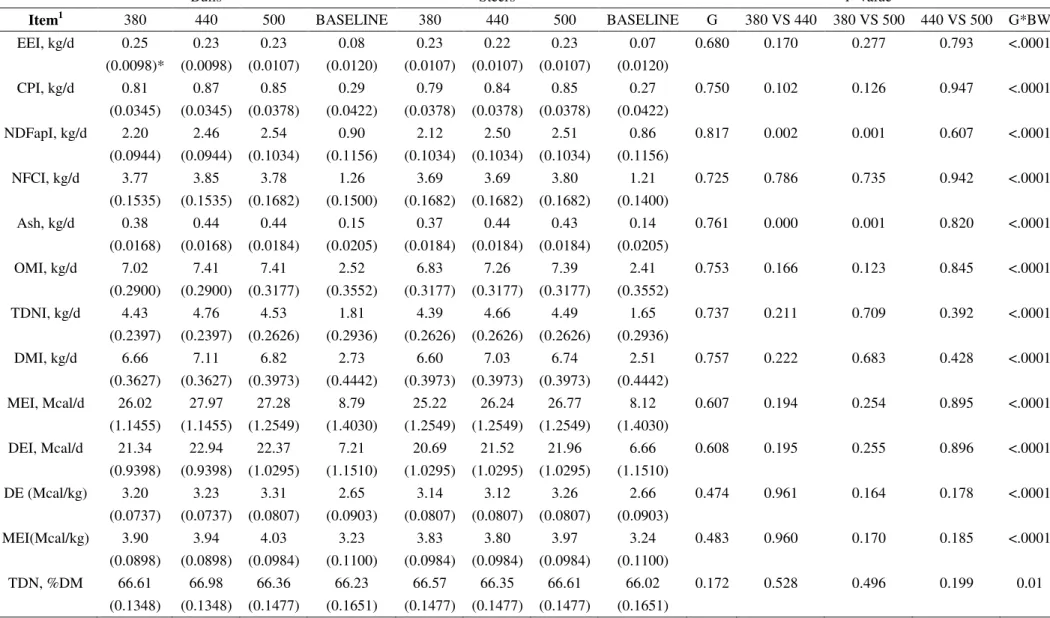
be right since the slope of the predicted against observed values have shown no
significant differences compared to observed data (P<0.05) (Fonseca, 2009, unpublished). Although the intercept reveals the weakness in accounting for the fat
chemical content because either only a linear effect was considerate or a small
common fat content in the parts of OV that are not visceral were underestimated.
Furthermore, there is a possibility of an existent allometric coefficient closer, but not
equal to one concerning OVEBW growth. If so, data suggests that not just visceral
fat is the only responsible for the differences between the genders and fat deposition
into organs and viscera mass. Either way, a correction factor for Nellore x Angus
seems to be a good alternative. Regarding HDEBW, it seems that the dataset have
22 isometrically related to EBW at a quite constant linear rate along the growth of the
body of the animal, as well maintaining the same ratio of deposition between its
chemical components. Concerning the FEBW and HEBW, the growth interpretation
seems to point out different directions for both variables indicating that individual
prediction equations may have to be developed instead grouping the two variables.
The constitution of the feet seems to be more homogenous, having the possibility
that rate of deposition of chemical components be the similar along growth. The
HEBW has a gender effect, and according to Marcondes et al. (2010) that is reflex of
protein deposition, which does not seems to be correct since the model evaluation
had shown a rejection of the null hypothesis of an identity line (Fonseca 2013,
unpublished). Furthermore the difference in proportion of HEBW along growth
suggests an allometric deposition of tissues and the equations to explain chemical
deposition are isometric, with body weight being responsible for protein deposition
variation with the same ratio for an animal with 110 kg and a 500 kg. The only
possibility of that being true is if the head of the animal never stops to growth along
the way and that growth had to be at the same ratio.
Considering the initial and final BW and performance for the entire experiment, we
have estimated the average DMI expected based on equation devised by (Valadares
Filho et al., 2010) to crossbred animals. The estimated values were 7.61, 8.16, 8.47,
7.59, 8.09, and 8.47 kg/d respectively for steers (380, 440 and 500) and bulls (380,
440 and 500). The observed values were 7.21, 7.69, 7.82, 7.40, 7.69, and 7.85 kg/d
or around 5.25, 5.76, 7.67, 2.5, 4.94, 7.32 % overestimation by the model. While
simulating the DMI with the prediction equation also devised by Valadares Filho et
al. (2010) for Nellore animals, the model explained better the observed variation
regarding the DMI in this dataset. The estimated values were 7.53, 8.06, 8.38, 7.34,
23 and 500). Making the difference between the observed and predicted values falls at
about 4.25, 4.6, 7.16% of overestimation by the model for steers, and only 0.81%
underestimation for 380kg bulls and 1.53, and 4.85 % overestimation by the model
for 440 and 500 kg bulls. Despite of the closer values, those results suggest that
animals in this dataset were slightly more efficient than the average crossbred
animals in the BR-CORTE’s database if RFI is considerate. That difference between
observed and predicted intakes represents the RFI. The point of using the RFIbrcorte
was an attempt to verify if the intakes could be a variable that would explain the
differences between the groups of animas. When using the empirical equation
devised by Valadares Filho et al. (2010) to estimate the daily DMI, RFIbrcorte, it
was not observed (Table 3) significant effects (P>0.05) of gender, BW or the interaction between both on the groups tested. On the other side, that random error
is nested to the errors of model and might not really represents the real difference in
efficiency between these animals which probably was one of the reasons if the
non-detection of differences. As better is the goodness of feet of the predictive equation
smaller in the chance to verify RFI differences. Thus, taken that into account we
developed a linear equation to predicted DMI along the trial which was used
afterwards to calculate the regular RFI. The developed model was:
DMI (kg/d) = -0.01864(±0.91374) + 1.11693(±0.26274) × ADG +
0.07272(±0.01237) × ASBW0.75
Where DMI is the dry matter intake (kg/d), ADG is the average daily gain (kg/d)
and ASBW0.75 is the average metabolic weight; the values in parenthesis are the standard error of the mean of the estimated parameters.
Despite of two groups, efficient and inefficient, being able to be identified, those
groups were composed by a sorted profile of animals with all slaughter weights and
24 experimental design, it was not observed (Table 3) significant effects (P>0.05) of gender, BW or the interaction between both tested groups.
Some of the variables of efficiency of animal production were also evaluated (Table
4). There were no effects of interaction between gender and slaughter weight
(P>0.05) for any of the studied variables. The FC and its reciprocal FE presented a significant effect of gender (P<0.05). For FC the bulls were more efficient in producing body mass per unit of DM consumed, presenting then smaller values of
FC. In average bulls presented FC of 4.26 and steers at about 5.05. Chizzotti (2007)
working with Nellore x Angus animals receiving 1 and 2% of the BW as concentrate
presented values of 6.03 and 4.41 respectively, and for the steers the observed values
were 6.30 and 4.99 for 1 and 2% of BW offered as concentrate, respectively. Despite
of the fact that the animals in this dataset were receiving at about 40% of concentrate
in the total diet and in average ate 2.15% of its BW making a BW basis offer of
concentrate at about 0.86%, the animals were more efficient, in a FC point of view,
than those reported by Chizzotti (2007). That behavior was observed even for the
animals receiving the double amount of concentrate then ours. That is probably
because the animals in this trial were slaughtered way heavier than Chizzotti’s and
while were still growing in an ascendant rate. While looking at from the FE’s point
of view, our dataset shows the same gender effect with bulls being more efficient
than steers and been respectively, in average, 2.4 and 3.5% more efficient than
Chizzotti’s. The PEG presented significant effect of gender and BW with again bulls
being more efficient than steers. Within gender, the 380 were the most efficient not
differing from the 440 kg, and 440 not differing from 500. The PEG measures the
efficiency in which the DNEg is converted in ADG. Within sex, bulls were almost
20% more efficient than steers with average PEG of 3.36 compared to 2.71 observed
25 efficient in using the DNEg and that efficiency decreases as the animal grows. The
observed values were 3.25, 3.03 and 2.83 for 380, 440 and 500 kg groups of
animals.
Concerning the fractions of the dietary energy that would be used whether for
maintenance (Mcal/kg DM), it was observed significant effect (P<0.05) only for slaughter weight. The 500 kg group of animals was more efficient in using the
DNEm and DNEg, which did not differ from 440. The 440 kg group also did not
differ from the 380.
The GnE showed only gender effect (P<0.05) with bulls being more efficient than
steers. Bulls used at about 9.93% of its dietary energy for its ADG and steers used
about 8.4%.
The RGR also have shown only gender effect (P<0.05) with bulls growing faster
than steers. The observed values were 0.2413 for bulls and 0.200 for steers,
suggesting that bulls relatively grew 4.13% faster than steers.
The last efficiency measure evaluated was KR, which measure the growth related to
time in trial, also have shown only gender effect (P<0.05) with bulls growing faster
than steers. The observed values were 0.0231 and 0.0190 for bulls and steers
respectively, suggesting that concerning BW gain, bulls grow 17.75% faster than
steers.
4. Implications:
Variables evaluated to study efficiency of animal production have indicated that
bulls are more efficient than steers. Though, taking into account the point of view of
producers, more bulls should be explored laying diet manipulation compensate for
26 References
AOAC. 2000. Official Methods of Analysis of AOAC International. 17th ed. Association of Official Analytical Chemists, Arlington, VA.
Arthur, P. F. et al. 2001. Genetic and phenotypic variance and covariance
components for feed intake, feed efficiency, and other postweaning traits in
Angus cattle. J. Anim. Sci. 79: 2805-2811.
Basarab, J. 1999. Factors affecting profitability of a cow-calf enterprise Western
Forage/Beef Group Newsletter No. 3.
Berg, R. T., and R. M. Butterfield. 1976. New Concepts of Cattle Growth.
Macarthur Press, Sidney.
Brennan, A. M., and C. S. Mantzoros. 2006. Drug Insight: the role of leptin in
human physiology and pathophysiology[mdash]emerging clinical
applications. Nat Clin Pract End Met 2: 318-327.
Chizzotti, M. L. 2007. Nutrient requirements of Nellore cattle, purebred and
crossbred, of different sexual groups. Ph.D. Dissertation, Federal University
of Viçosa, Viçosa, MG, Brazil.
Ferrell, C. L., and T. G. Jenkins. 1985. Cow type and the nutritional environment:
Nutritional aspects. J. Anim. Sci. 61: 725-741.
Fitzhugh, H. A., Jr., and S. C. S. Taylor. 1971. Genetic analysis of degree of
maturity. Journal Animal Science 33: 717-725.
Gibb, D. J., and T. A. McAllister. 1999. The impact of feed intake and feeding
behaviour of cattle on feedlot and feedbunk management. In: Proc. 20th
Western Nutr. Conf. p 101 -116.
Hall, M. B. 2000. Calculation of non-structural carbohydrate content of feeds that
27 Kleiber, M. 1936. Problems involved in breeding for efficiency of food production.
In: Proceedings of the American Society of Animal Production, 29, Madison,
WI. p 247-258.
Licitra, G., T. M. Hernandez, and P. J. Van Soest. 1996. Standardization of
procedures for nitrogen fractionation of ruminants feeds. Animal Feed Sci.
and Technol. 57:347-358.
Marcondes, M. I. 2010. Exigencias nutricionais e predicao da composicao corporal
de bovinos Nelore puros e cruzados, Universidade Federal de Vicosa,
Viçosa.
Marcondes, M. I. et al. 2010. Prediction of body and carcass chemical composition
of Nellore cattle and crossbreed In: S. C. Valadares Filho, M. I. Marcondes
and P. V. R. Paulino (eds.) Nutrient Requirements of Zebu and Crossbreed
(BR-CORTE). p 65-84. Suprema Gráfica Ltda.
Neter, J., M. H. Kutner, C. J. Nachtsheim, and W. Wasserman. 1996. Applied Linear
Statistical Models. 4th ed. McGraw-Hill Publishing Co., Boston.
NRC. 2000. Nutrient Requirements of Beef Cattle. updated 7th ed. National
Academy Press, Washington, DC.
Sniffen, C. J., J. D. O'Connor, P. J. Van Soest, D. G. Fox, and J. B. Russell. 1992. A
net carbohydrate and protein system for evaluating cattle diets: II.
Carbohydrate and protein availability. J. Anim. Sci. 70: 3562-3577.
Tedeschi, L. O. et al. 2002. Energy requirement for maintenance and growth of
Nellore bulls and steers fed high-forage diets. J. Anim. Sci. 80: 1671-1682.
Valadares Filho, S. C., M. I. Marcondes, M. L. Chizzotti, and P. V. Paulino. 2010.
Nutrient Requeriment of Zebu Cattle - BR-CORTE. 2nd ed. Suprema
28 Van Soest, P. J., J. B. Robertson, and B. A. Lewis. 1991. Methods for dietary fiber,
neutral detergent fiber, and nonstarch polysaccharides in relation to animal
nutrition. J. Dairy. Sci. 74: 3583-3597.
Zinn, R. A., and Y. Shen. 1998. An evaluation of ruminally degradable intake
protein and metabolizable amino acid requirements of feedlot calves. J.
29 Table 1 - Proportions and chemical composition of the ingredients in concentrate and diet (DM basis).
Ingredients Concentrate Diet
Proportion (g/kg DM)
Corn Silage - 600.00
Corn 833.50 333.40
Soybean Meal 108.30 43.30
Mineral premixa 11.06 4.40
Urea:ammonium sulfate (9:1) 22.11 8.90
Salt 12.30 4.90
Limestone 12.80 5.10
Chemical composition
Dry matter 885.00 537.30
Organic matter 938.00 944.94
Crude protein 170.50 105.85
Ether extract 32.30 29.08
Neutral Detergent fiberb 114.70 340.30
Non fiber carbohydrateb 655.90 483.95
a
Composition: Ca - 24,0%; P - 17,4%; Co - 100,0 ppm; Cu - 1.250,0 ppm; Fe - 1.795,0
ppm; Mn - 2.000,0 ppm; Se - 15,0 ppm; Zn - 5.270,0 ppm; I - 90,0 ppm; bcorrected for ash
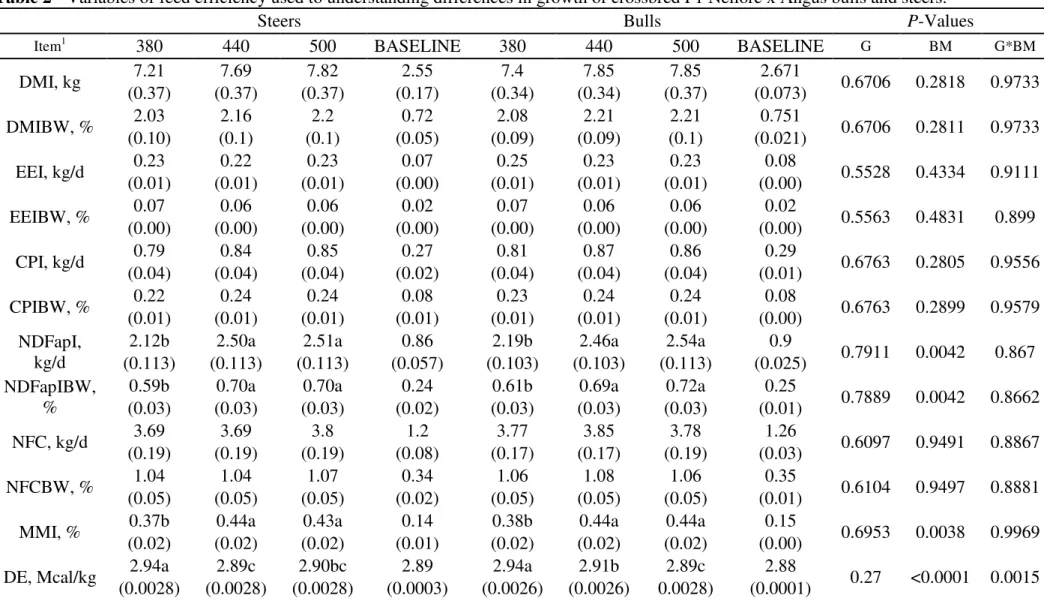
30 Table 2 - Variables of feed efficiency used to understanding differences in growth of crossbred F1 Nellore x Angus bulls and steers.
Steers Bulls P-Values
Item1 380 440 500 BASELINE 380 440 500 BASELINE G BM G*BM
DMI, kg 7.21 7.69 7.82 2.55 7.4 7.85 7.85 2.671 0.6706 0.2818 0.9733
(0.37) (0.37) (0.37) (0.17) (0.34) (0.34) (0.37) (0.073)
DMIBW, % 2.03 2.16 2.2 0.72 2.08 2.21 2.21 0.751 0.6706 0.2811 0.9733
(0.10) (0.1) (0.1) (0.05) (0.09) (0.09) (0.1) (0.021)
EEI, kg/d 0.23 0.22 0.23 0.07 0.25 0.23 0.23 0.08 0.5528 0.4334 0.9111
(0.01) (0.01) (0.01) (0.00) (0.01) (0.01) (0.01) (0.00)
EEIBW, % 0.07 0.06 0.06 0.02 0.07 0.06 0.06 0.02 0.5563 0.4831 0.899
(0.00) (0.00) (0.00) (0.00) (0.00) (0.00) (0.00) (0.00)
CPI, kg/d 0.79 0.84 0.85 0.27 0.81 0.87 0.86 0.29 0.6763 0.2805 0.9556
(0.04) (0.04) (0.04) (0.02) (0.04) (0.04) (0.04) (0.01)
CPIBW, % 0.22 0.24 0.24 0.08 0.23 0.24 0.24 0.08 0.6763 0.2899 0.9579
(0.01) (0.01) (0.01) (0.01) (0.01) (0.01) (0.01) (0.00)
NDFapI, kg/d
2.12b 2.50a 2.51a 0.86 2.19b 2.46a 2.54a 0.9
0.7911 0.0042 0.867 (0.113) (0.113) (0.113) (0.057) (0.103) (0.103) (0.113) (0.025)
NDFapIBW, %
0.59b 0.70a 0.70a 0.24 0.61b 0.69a 0.72a 0.25
0.7889 0.0042 0.8662
(0.03) (0.03) (0.03) (0.02) (0.03) (0.03) (0.03) (0.01)
NFC, kg/d 3.69 3.69 3.8 1.2 3.77 3.85 3.78 1.26 0.6097 0.9491 0.8867
(0.19) (0.19) (0.19) (0.08) (0.17) (0.17) (0.19) (0.03)
NFCBW, % 1.04 1.04 1.07 0.34 1.06 1.08 1.06 0.35 0.6104 0.9497 0.8881
(0.05) (0.05) (0.05) (0.02) (0.05) (0.05) (0.05) (0.01)
MMI, % 0.37b 0.44a 0.43a 0.14 0.38b 0.44a 0.44a 0.15 0.6953 0.0038 0.9969
(0.02) (0.02) (0.02) (0.01) (0.02) (0.02) (0.02) (0.00)
DE, Mcal/kg 2.94a 2.89c 2.90bc 2.89 2.94a 2.91b 2.89c 2.88 0.27 <0.0001 0.0015
31
MEI, Mcal/d 17.41 18.25 18.61 6.04 17.86 18.71 18.64 6.319 0.6556 0.4688 0.9607
(0.88) (0.88) (0.88) (0.4) (0.81) (0.81) (0.88) (0.173)
TDN 0.668a 0.656c 0.658bc 0.655 0.668a 0.659b 0.657bc 0.654 0.2019 <0.0001 0.0014
(0.00063) (0.00063) (0.00063) (0.00007) (0.00058) (0.00058) (0.00063) (0.00)
1
DMI is daily dry matter intake in kg, DMIBW is daily dry matter intake in % of BW; EEI is the daily ether extract intake in kg, EEIBW is the daily ether extract intake in % of BW; CPI is the daily crude protein intake in kg, CPIBW is the daily crude protein intake in % of BW; NDFapI is the daily neutral detergent fiber corrected for ash and protein intake in kg; NDFapIBW daily neutral detergent fiber corrected for ash and protein intake in % of BW; NFC is the daily non fiber carbohydrates intake in kg; NFCBW daily non fiber carbohydrate intake in % of BW; MMI is the daily intake of mineral matter in kg; DE is the digestible energy of the diet; MEI is the daily metabolizable energy intake; TDN is relation of the total digestible nutrients % of dry matter intake, G is gender, BM is body mass or
group’s slaughter weight; a, b, c Distinct lowercase letters, while alone in the same row, differ at P < 0.05 by least square means for first observed significant effect
detected following the order (G, T and G x T); A, B, C Distinct capital letters in the same row, differ at P < 0.05 by least square means for second observed significant
effect detected following the order (G, T and G x T)* values in parenthesis represent the standard error of the mean.
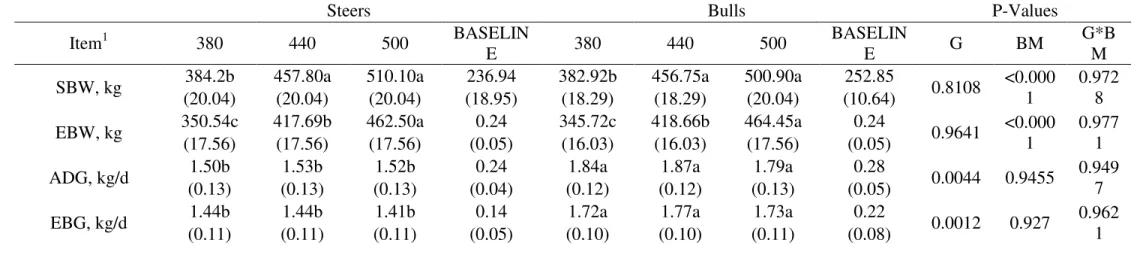
Table 3 - Variables of tissue deposition efficiency used to understanding differences in growth of crossbred F1 Nellore x Angus bulls and steers.
Steers Bulls P-Values
Item1 380 440 500 BASELIN
E 380 440 500
BASELIN
E G BM
G*B M
SBW, kg 384.2b 457.80a 510.10a 236.94 382.92b 456.75a 500.90a 252.85 0.8108 <0.000
1
0.972 8 (20.04) (20.04) (20.04) (18.95) (18.29) (18.29) (20.04) (10.64)
EBW, kg 350.54c 417.69b 462.50a 0.24 345.72c 418.66b 464.45a 0.24 0.9641 <0.000
1
0.977 1 (17.56) (17.56) (17.56) (0.05) (16.03) (16.03) (17.56) (0.05)
ADG, kg/d 1.50b 1.53b 1.52b 0.24 1.84a 1.87a 1.79a 0.28 0.0044 0.9455 0.949
7
(0.13) (0.13) (0.13) (0.04) (0.12) (0.12) (0.13) (0.05)
EBG, kg/d 1.44b 1.44b 1.41b 0.14 1.72a 1.77a 1.73a 0.22 0.0012 0.927 0.962
1
32
HCG, kg/d 0.94b 0.95b 0.91b 0.17 1.12a 1.15a 1.19a 0.25 0.0273 0.9712 0.916
8 (0.118) (0.118) (0.118) (0.054) (0.108) (0.108) (0.118) (0.077)
CCG, kg/d 0.98b 0.98b 0.93b 0.90 1.17a 1.19a 1.21a 0.92 0.022 0.9938 0.923
4 (0.117) (0.117) (0.117) (0.004) (0.107) (0.107) (0.117) (0.007)
EBW:SBW
0.913ab 0.913ab 0.907ab 1.017 0.904b 0.917ab 0.927a 1.182
0.2282 0.1481 0.019 1 (0.004822 ) (0.004822 ) (0.004822
) (0.03354)
(0.004402 )
(0.004402 )
(0.004822
) (0.06704)
EBG:ADG 0.965 0.949 0.927 0.092 0.944 0.951 0.964 0.090 0.6171 0.8441 0.138
9 (0.01442) (0.01442) (0.01442) (0.01483) (0.01316) (0.01316) (0.01442) (0.01624)
CE 0.207b 0.199b 0.195b 0.093 0.246a 0.237a 0.228a 0.104 0.0003 0.3962 0.962
5 (0.011) (0.011) (0.011) (0.013) (0.010) (0.010) (0.011) (0.017)
EBGDMI
0.199b 0.188b 0.181b 0.054 0.231a 0.226a 0.220a 0.081
<0.000
1 0.246
0.890 3 (0.008813 ) (0.008813 ) (0.008813
) (0.01903)
(0.008045 )
(0.008045 )
(0.008813
) (0.02809)
HCGDMI 0.129b 0.123b 0.116b 0.063 0.150a 0.146a 0.148a 0.091 0.0098 0.8007 0.874
8 (0.0116) (0.0116) (0.0116) (0.019) (0.01059) (0.01059) (0.0116) (0.027)
CCGDMI 0.135b 0.127b 0.119b 0.328 0.158a 0.151a 0.152a 0.319 0.0066 0.5914 0.878
4 (0.0113) (0.0113) (0.0113) (0.0527) (0.01032) (0.01032) (0.0113) (0.0577)
ADGDMI% 0.735b 0.709b 0.692b 57.715 0.876a 0.845a 0.812a 57.753 0.0003 0.404 0.959
6 (0.03976) (0.03976) (0.03976) (0.87137) (0.0363) (0.0363) (0.03976) (0.39356)
HCY, % 59.21AB 58.69AB 58.87AB 58.48 57.26B 59.58AB 60.54A 58.64 0.7007 0.0909 0.022
6 (0.661) (0.661) (0.661) (0.953) (0.603) (0.603) (0.661) (0.712)
CCY, % 53.56b 56.17ab 57.38a 14.93 55.91b 57.20ab 58.28a 14.96 0.0661 0.0082 0.682
5 (0.941) (0.941) (0.941) (0.456) (0.859) (0.859) (0.941) (0.464)
OVEBW 16.45a 17.29a 17.56a 5.22 15.87b 15.73b 15.78b 6.25 <0.000
1 0.3352
0.200 8 (0.356) (0.356) (0.356) (0.540) (0.325) (0.325) (0.356) (0.484)
33 1
SBW is shrunk BW; EBW is the empty BW; ADG is the average daily gain; EBG is the empty body gain; HCG is the hot carcass gain; CCG is the cold carcass gain; EBW:SBW is the ratio among the variables; EBG:ADG is the ratio among the variables ; CE is the crude efficiency; EBGDMI is the ratio between EBW and dry matter intake (DMI); CCGDMI is the ratio between CCG and DMI; ADGDMI% is the ratio between ADG and DMI in % of body weight; HCY is hot carcass yield; CCY is the cold carcass yield; OVEBW is the ratio between mass of organs and viscera and EBW; HDEBW is the ratio between mass of hide and EBW; FEBW is the ratio between mass of feet and EBW; HEBW is the ratio between
mass of head and EBW; RFIBRCORTE is the residual feed intake with predicted DMI using BRCORTE recommendations; RFI is the residual feed intake; a, b, c Distinct lowercase
letters, while alone in the same row, differ at P < 0.05 by least square means for first observed significant effect detected following the order (G, T and G x T); A, B, C Distinct capital
letters in the same row, differ at P < 0.05 by least square means for interaction gender * group’s slaughter weight * values in parenthesis represent the standard error of the mean.
Table 4 - Efficiency indexes and variables used in its calculations used to understanding differences in growth of crossbred F1 Nellore x Angus bulls and steers.
Steers Bulls P-Values
Item 380 440 500 BASELINE 380 440 500 BASELINE G BM G*BM
ADG, kg/d 1.50b 1.53b 1.52b 0.24 1.84a 1.87a 1.79a 0.24 0.0044 0.9469 0.9435
0.127 0.127 0.127 0.046 0.116 0.116 0.127 0.047
MBW, kg0.75 74.23 80.35 83.93 61.33 74.37 80.15 83.98 63.99 0.9982 0.0022 0.9974
2.52b 2.52ab 2.52a 3.29 2.30b 2.30ab 2.52a 1.33
NEg, Mcal/d 7.64 8.66 9.09 0.82 7.36 8.72 9.27 0.81 0.9787 0.1074 0.953
0.81 0.81 0.81 0.21 0.74 0.74 0.81 0.19
(0.619) (0.619) (0.619) (0.137) (0.565) (0.565) (0.619) (0.086) 1
FEBW 2.63a 2.53a 2.21b 4.67 2.63a 2.43a 2.28b 4.66 0.8405 0.0001 0.535
(0.0789) (0.0789) (0.0789) (0.2455) (0.0720) (0.0720) (0.0789) (0.1322)
HEADEBW 3.58Ba 3.22Bb 3.04Bb -1.24 3.80Aa 3.42Ab 3.25Ab -1.37 0.0076 <0.000
1
0.925 6 (0.099) (0.099) (0.099) (0.287) (0.090) (0.090) (0.099) (0.208)
RFIBRCORTE, kg
-0.296 -0.384 -0.627 0.021 -0.207 -0.524
0.3244 0.2144 0.904 9
(0.250) (0.250) (0.250) (0.228) (0.228) (0.250)
RFI, kg 0.153 0.161 0.034 -0.047 -0.044 -0.240 0.1359 0.6095 0.975
4