* Corresponding author: E-mail: [email protected]
Received: May 30, 2016 Approved: September 14, 2016
How to cite: Oliveira RA, Tiecher T, Piccin R, Somavilla LM, Comin JJ, Loss A, Lourenzi CR, Kürtz C, Brunetto G. Release of Phosphorus Forms from Cover Crop Residues in Agroecological No-Till Onion Production. Rev Bras Cienc Solo. 2017;41:e0160272.
Copyright: This is an open-access article distributed under the terms of the Creative Commons Attribution License, which permits unrestricted use, distribution, and reproduction in any medium, provided that the original author and source are credited.
Release of Phosphorus Forms from
Cover Crop Residues in Agroecological
No-Till Onion Production
Rodolfo Assis de Oliveira(1)
, Jucinei José Comin(2)
, Tales Tiecher(3)
, Rogério Piccin(4) , Luiza Michelon Somavilla(5)
, Arcângelo Loss(2)
, Cledimar Rogério Lourenzi(2) , Claudinei Kürtz(5)
and Gustavo Brunetto(6)* (1)
Universidade Federal de Santa Catarina, Centro de Ciências Agrárias, Departamento de Engenharia Rural, Programa de Pós-graduação em Agroecossistemas, Florianópolis, Santa Catarina, Brasil.
(2)
Universidade Federal de Santa Catarina, Centro de Ciências Agrárias, Departamento de Engenharia Rural, Florianópolis, Santa Catarina, Brasil.
(3)
Universidade Federal do Rio Grande do Sul, Faculdade de Agronomia, Departamento de Solos, Programa de Pós-Graduação em Ciência do Solo, Porto Alegre, Rio Grande do Sul, Brasil.
(4)
Universidade Federal de Santa Maria, Centro de Ciências Rurais, Departamento de Solos, Programa de Pós-graduação em Ciência do Solo, Santa Maria, Rio Grande do Sul, Brasil. (5)
Empresa de Pesquisa e Extensão Rural de Santa Catarina, Ituporanga, Santa Catarina, Brasil. (6)
Universidade Federal de Santa Maria, Centro de Ciências Rurais, Departamento de Solos, Santa Maria, Rio Grande do Sul, Brasil.
ABSTRACT: Cover crops grown alone or in association can take up different amounts of
phosphorus (P) from the soil and accumulate it in different P-forms in plant tissue. Cover crop residues with a higher content of readily decomposed forms may release P more quickly for the next onion crop. The aim of this study was to evaluate the release of P forms from residues of single and mixed cover crops in agroecological no-till onion (Allium cepa L.) production. The experiment was conducted in Ituporanga, Santa Catarina (SC), Brazil, in an Inceptisol, with the following treatments: weeds, black oat (Avena sativa L.), rye (Secale cereale L.), oilseed radish (Raphanus sativus L.), oilseed radish + black oat,
and oilseed radish + rye. Cover crops were sown in April 2013. In July 2013, plant shoots were cut close to the soil surface and part of the material was placed in litterbags. The bags were placed on the soil surface and residues were collected at 0, 15, and 45 days after deposition (DAD). Residues were dried and ground and P in the plant tissue was determined through chemical fractionation. The release of P contained in the tissue of cover crops depends not only on total P content in the tissue, but also on the accumulation of P forms and the quality of the residue in decomposition. The highest accumulation of P in cover crops occurred in the soluble inorganic P fraction, which is the fraction of fastest release in plants. Black oat had the highest initial release rate of soluble inorganic P, which became equal to the release rate of other cover crop residues at 45 DAD. Weeds released only half the amount of soluble inorganic P in the same period, despite accumulating a considerable amount of P in their biomass. The mixtures of oilseed radish + rye and oilseed radish + black oat showed higher release of P associated with RNA at 45 DAD in comparison to the single treatments.
Keywords: Green manure crops, P cycling, Allium cepa L.
INTRODUCTION
Phosphorus (P) is an essential macronutrient for molecular and physiological plant functions, including energy transfer, photosynthesis, and carbohydrate metabolism. Phosphorus is also a component of nucleic acids and phospholipids (Niu et al., 2015). Low concentrations of P, typically less than 0.3 mg L-1 P, and often less than 0.001 mg L-1 P,
are found in the soil solution, while concentrations of up to 3000 mg kg-1
P can be found in plant tissue (Bieleski 1973, 1976). Low P availability in the soil is a result of its sorption capacity in highly weathered soils, rich in 1:1 clays and Fe and Al oxides (Fink et al., 2016; Gérard, 2016). Therefore, P is one of the nutrients that most often limits yield in Brazilian agricultural systems.
Faced with a growing global demand for food and an expected shortage of phosphate fertilizer in the first half of this century (Grantham, 2012), the efficient use of P has become a key issue for humanity. Therefore, we must increase agricultural production in the most sustainable way possible (Worstall, 2013) and reduce the risk of environmental contamination caused by indiscriminate use of phosphate fertilizers (Broetto et al., 2014). Thus, strategies of nutrient management in soils, such as the use of cover crops to maintain and increase crop yield and also to reduce the demand for mineral fertilizer, need to be developed in order to more efficiently use naturally occurring and applied P in soils (Tiecher et al., 2015).
Phosphorus dynamics in Brazilian soils are often the subject of studies that address the influence of soil mineralogy (Eberhardt et al., 2008; Fink et al., 2014) and mineral (Schmitt et al., 2013) and organic fertilizer use (Tiecher et al., 2015). Furthermore, there have been studies evaluating the effects of the use of cover crops and soil management systems (Bezerra et al., 2015), as well as the influence of biotic and abiotic environmental factors (Resende et al., 2011). However, few studies have evaluated the accumulation and release of P forms from crop residues and they generally only evaluate total P accumulation and P release throughout crop cycles (Viola et al., 2013). According to Lajtha and Harrison (1995), plants may have mechanisms that help acquire P, such as increased root/shoot ratio and root surface, higher uptake rate per root unit, increased root exudation of phosphatases and organic complexing, and mycorrhizal association. Therefore, plants can take up varying amounts of P in the same soil, resulting in higher or lower P cycling by the deposition of crop residues on the soil surface.
Average total P content in plants ranges from 0.05 to 0.50 % (Marschner, 2012) and P content associated with RNA and lipids may vary by a factor of up to five times, whereas soluble inorganic P may vary up to 50 times (Bieleski, 1973). According to Bieleski and Ferguson (1983), this occurs because the vacuole of higher plant cells acts as a non-metabolic soluble inorganic P reservoir, responsible for providing 85-95 % of inorganic P to plants. Nearly all P in the vacuole is found in soluble inorganic forms, and part of it in soluble organic forms, mainly as monoesters. Diester forms of organic P are mainly found in nucleic acids (DNA and RNA) and water-insoluble phospholipids. Thus, in addition to total P content in plant tissue, it is important to know the forms of P that plants accumulate in their tissues, as this will determine the rate of P release from plant tissues for subsequent crops (Casali et al., 2011). To acquire this information, a sequential chemical fractionation technique originally proposed by Bieleski (1973) can be used. This technique separates P from plant tissue into six groups: (i) soluble inorganic, (ii) soluble organic, (iii) lipidic, (iv) DNA, (v) RNA, and (vi) residual fraction.
the likelihood of leaching in the soil profile (e.g., nitrate) or loss by specific adsorption of high energy by the colloidal fraction of the soil (e.g., phosphate). This increases the residence time of these nutrients in available forms in the soil and thus favors uptake by the subsequent crop. However, there are few studies addressing the dynamics of forms of P accumulated in species of single or mixed cover crops, or the release rate of forms of P to the soil throughout residue decomposition.
Residues of cover crops alone or in association in decomposed, release different amounts of P in soil in readily available or more recalcitrant forms to the next onion crop. However, studies addressing the dynamics of accumulation of P forms and their rate of release from cover crops grown alone or in association are still lacking. For this reason, the aim of this study was to evaluate the release of forms of P from residues of single and mixed cover crops in agroecological no-tillage onion production.
MATERIALS AND METHODS
Experimental area and treatments
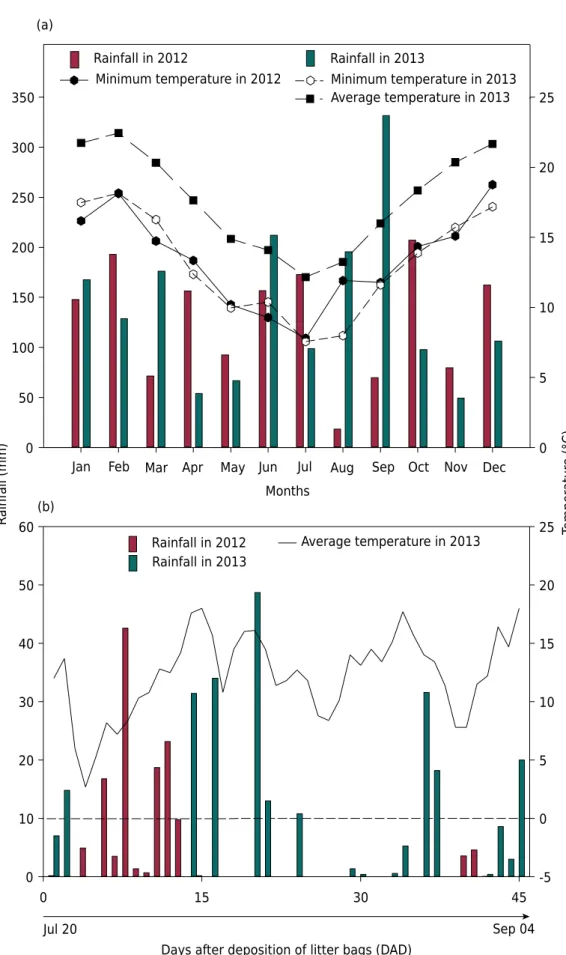
The experiment was carried out from July to November 2013 in Ituporanga, in the Upper Itajai Valley region, state of Santa Catarina, Brazil (27° 22’ S, 49° 35’ W, and 475 m altitude). According to the Köppen classification system, the climate is humid subtropical (Cfa) (Kottek et al., 2006). Climate data collected during the experiment in 2013 are shown in figure 1. There are hot summers and infrequent frosts and no defined dry season. The soil was classified as a Cambissolo Húmico according to the Brazilian System of Soil Classification, and as an Inceptisol, according to the Soil Taxonomy System (Soil Survey Staff, 2006), with 380, 200, and 420 g kg-1 of clay, silt, and sand (clay loam texture),
respectively (Claessen, 1997). At the beginning of the experiment (April 2009), the soil from the 0.00-0.10 m layer had the following chemical properties (Tedesco et al., 1995): organic matter, 40 g kg-1
; pH in water, 6.0; available P and K, 26.6 and 145.2 mg kg1,
respectively (extracted by Mehlich-1); exchangeable Al, Ca, and Mg, 0.0, 7.2, and 3.4 cmolc kg-1, respectively (extracted by 1 mol L-1 KCl); CECpH7.0, 14.32 cmolc kg-1, base
saturation of CECpH7.0, 76 %; and Al saturation, 0.00 %.
The experiment was established in an area with a 20-year history of onion growth under conventional tillage (plowing and harrowing) until 1996. From that year on, a minimum-tillage system of onion was established with crop rotation and cover crops (black oat - Avena strigosa, velvet bean - Mucuna aterrima, pearl millet - Pennisetum glaucum, sunn hemp - Crotalaria juncea, common vetch - Vicia sativa). This system continued from 1996 to 2007, and then sweet potato (Ipomoea batatas) was grown until 2009. Since that time, a no-tillage system experiment of onion has been carried out. In April 2009, the weeds were desiccated, and lime was applied and incorporated to raise pH in water to 6.0.
Treatments consisted of sowing single or mixed cover crops, and fallow treatment used as a control was dominated by weeds (WD) comprising 20 botanical families, mostly bermuda grass (Cynodum sp.), bitter dock (Rumex obtusifolius), staggerweed (Stachys arvensis), purple amaranth (Amaranthus lividus), flatsedge (Cyperus spp.), radishroot woodsorrel (Oxalis corniculata), hairy beggarticks (Bidens pilosa), and gallant soldier (Galinsoga parviflora). Cover crops were black oat (Avena strigosa Schreb - 120 kg ha-1 of seeds) (BO), rye (Secale cereale L. - 120 kg ha-1 of seeds) (RY), oilseed radish (Raphanus
sativus - 20 kg ha-1 of seeds) (RD), oilseed radish (10 kg ha-1 of seeds) + rye (60 kg ha-1
of seeds) (RD + RY), and oilseed radish (10 kg ha-1
of seeds) + black oat (60 kg ha-1
for the grass species. In the summer of each year, all plots were sown with velvet bean (Mucuna aterrima). A randomized block experimental design was used, with eight replicates. Each experimental unit was 5 × 5 m (25 m²).
Figure 1. Monthly average rainfall and monthly average and minimum temperature in 2013 (a); Rainfall and daily average temperature in 2013 at 0, 30, and 45 DAD in the experimental area (b).
Days after deposition of litter bags (DAD)
0 15 30 45
0 10 20 30 40 50
60 Temperatur
e (°C)
-5 0 5 10 15 20 25 Months
Ra
infall (mm)
0 50 100 150 200 250 300 350
0 5 10 15 20 25
Rainfall in 2012 Rainfall in 2013
Average temperature in 2013
Rainfall in 2012 Rainfall in 2013
Minimum temperature in 2012 Minimum temperature in 2013 Average temperature in 2013
(b)
Jul 20 Sep 04
(a)
In July of each year, all winter species and weeds were rolled down with a knife roller. Subsequently, the total amount of 42 kg ha-1 P (Gafsa rock phosphate) was broadcast on
the soil surface. In addition, 104 kg ha-1 K and 160 kg ha-1 N in the form of poultry manure
were broadcast. Half of the fertilizer was applied at transplanting of seedlings and half 30 days after transplanting. In the 2011 crop, rock phosphate was not applied because P content was very high according to regional soil fertility parameters (CQFSRS/SC, 2004). Plant furrows were opened with a machine adapted for no-tillage, and onion seedlings (cv. EMPASC 352 - Bola Precoce) were manually transplanted. Plants were placed in rows 0.40 m apart, with 0.10 m between plants. Each plot had 10 rows, for a total of 500 onion plants per plot. Weeding was done at 60 and 90 days after seedling transplanting. The procedures were repeated each year.
Cover crop sampling and litterbag preparation
On July 11, 2013, samples were taken of cover crop shoots from each treatment. Plants were cut at ground level in a 0.5 × 0.5 m (0.25 m2) area for each subsample. Five fresh
sub-samples were collected in each plot and dried at 65 °C until constant weight, and plant dry matter (DM) yield was measured. On July 22, 2013, shoots of the single and mixed species of winter cover crops remaining in the field were cut at ground level and left in the area. Samples of the plant shoot matter were dried at 65 °C. After drying, the DM was ground, and chemical composition was determined (Table 1). The other part of fresh shoot matter was homogenized, weighed, and placed in nylon fabric litterbags (0.40 × 0.40 m, with 2 mm mesh) (Tagliavini et al., 2007). The following amounts of fresh shoot matter were placed in separate litterbags: 235.13 g of WD, 767.99 g of BO, 434.50 g of RY, 460.46 g of RD, 570.67 g of RD + BO, and 416.82 g of RD + RY. These
Table 1. Initial chemical characterization of weed (WD), black oat (BO), rye (RY), oilseed radish (RD), oilseed radish + black oat (RD + BO), and oilseed radish + rye (RD + RY) residues and added amounts of dry matter and nutrients
Parameter WD BO RY RD RD + BO RD + RY
g kg-1 TOC 409.4 ± 1.02(1)
375,0 ± 0.40 401.0 ± 2.06 365.2 ± 1.21 369.7 ± 0.80 366.8 ± 1.50
N 26.2 ± 0.17 19.8 ± 0.21 18.0 ± 0.19 22.3 ± 0.37 21.9 ± 0.34 24.2 ± 0.22
P 5.5 ± 0.12 6.0 ± 0.02 5.7 ± 0.02 6.5 ± 0.06 6.6 ± 0.01 6.6 ± 0.01
K 21.5 ± 0.10 42.9 ± 0.59 24.9 ± 0.30 33.4 ± 0.45 36.3 ± 0.32 33.0 ± 0.81
Ca 4.9 ± 0.10 3.5 ± 0.04 6.4 ± 0.12 6.9 ± 0.06 10.4 ± 0.11 8.0 ± 0.16
Mg 1.9 ± 0.05 1.6 ± 0.03 2.1 ± 0.11 2.1 ± 0.01 4.6 ± 0.05 2.6 ± 0.04
Cel 182.3 ± 1.02 239.6 ± 7.21 161.8 ± 7.59 211.0 ± 2.87 220.7 ± 2.34 192.9 ± 1.12 Lig 69.2 ± 0.77 86.1 ± 2.23 102.8 ± 5.33 71.7 ± 1.63 93.5 ± 2.41 80.6 ± 0.63 Bio 748.4 ± 1.28 674.3 ± 5.78 735.5 ± 9.01 717.3 ± 4.09 685.6 ± 4.19 726.5 ± 1.57
C/N 16 ± 0.99 19 ± 1.93 22 ± 2.32 17 ± 2.72 17 ± 2.50 15 ± 1.53
Lig/N 3 ± 0.17 4 ± 0.21 6 ± 0.19 3 ± 0.37 4 ± 0.34 3 ± 0.21
C/P 75 ± 14.82 62 ± 2.61 70 ± 5.36 56 ± 4.91 56 ± 6.28 56 ± 7.59
Cel/Lig 3 ± 0.17 3 ± 0.21 2 ± 0.19 3 ± 0.37 2 ± 0.34 2 ± 0.22
Added amount (kg ha-1 )
DM 4620.0 5263.1 5060.0 3640.0 4030.0 3730.0
TOC 1891.6 1973.7 2029.0 1329.4 1490.1 1368.0
N 120.9 104.4 91.1 81.1 88.3 90.2
P 25.2 31.7 28.8 23.9 26.6 24.5
K 99.2 225.8 126.0 121.5 146.2 123.1
Ca 22.4 18.6 32.2 25.0 42.0 29.8
Mg 8.8 8.4 10.9 7.7 18.7 9.8
(1)
values, in terms of kg ha-1 of DM, amounted to 4620 WD, 5263 BO, 5060 RY, 3640 RD,
4030 RD + BO, and 3730 RD + RY, and they are equivalent to DM amounts obtained in the field at the sampling carried out on July 11, 2013. The other initial chemical characteristics of the residues and amounts of nutrients added to each treatment are shown in table 1.
On July 22, 2013, the litterbags were placed directly on the soil surface, between onion rows. Twenty-four bags of each treatment were placed (six bags in each plot), for a total of 144 litterbags. Bags were secured on the ground by iron bars to prevent shifting in the wind. Bags were collected at the time of deposition (time 0) and at 15 and 45 days after deposition (DAD) of the litterbags. The bags were opened in the laboratory; the residue removed after the bag remained in the experimental area contained soil particles and poultry litter, given that the experimental area contains soil particle waste. The litter bags were opened in the laboratory and the remaining plant residues were removed, washed in distilled water and then in 0.1 mol L-1 HCl solution and again in distilled water.
Residues were dried in a drying oven with circulation at 65 °C, weighed, ground and reserved for chemical fractionation of P in the tissue.
Chemical fractionation of P in the tissue
Residue DM was subjected to P chemical fractionation according to the method proposed by Miyachi and Tamiya (1961) with adjustments proposed by Schmidt and Thannhauser (1945) and Casali et al. (2011). The following P fractions were obtained: total acid-soluble P (TASP), soluble inorganic P (Psi), soluble organic P (Pso) (by the difference between TASP and Psi), lipid P (Plip), P associated with RNA (P-RNA), P associated with DNA (P-DNA), and the residual P fraction (Pres). To obtain these fractions, 0.2 g of DM was weighed in triplicate for each replication of the treatment. After that, DM was added to 15 mL Falcon round-bottom tubes. Then 10 mL of 0.2 mol L-1 HClO
4 was added, and the tubes were
shaken by hand for 5 min and centrifuged for 10 min at 6,000 g. The supernatant was filtered with quantitative filter with 8-micron pores. An extra 5 mL of 0.2 mol L-1 HClO
4
was added to the tissue, and the centrifugation and filtration process was repeated. Finally, supernatants were united (10 mL + 5 mL), which formed a 15 mL extract. The P content in the same extract was analyzed according to the method described by Murphy and Riley (1962), and Psi was obtained. Soluble organic P (Pso) was obtained by the difference between TASP and Psi.
The tissue sample remaining from the first extraction remained in the 15 mL Falcon tubes. This sample was added to 6 mL of ethanol + ether + chloroform solution (E + E + C) at a ratio of 2:2:1, and this remained in a water bath at 50 °C for 1 h. Then, the tissue sample with E + E + C solution was centrifuged for 10 min at 6,000 g, and the supernatant was reserved in a 50 mL Erlenmeyer flask. Subsequently, 4 mL of cold ether (4 °C) was added and centrifugation was repeated, and the extract of the second centrifugation was mixed with the extract of the first centrifugation. The Erlenmeyer flask extract rested for 24 h in an air extraction chamber for the ether to evaporate and for 3 h in a forced air circulation oven at 37 °C.
Following fractionation, the tissue samples remaining from the extraction with E + E + C received 6 mL of 0.5 mol L-1 KOH, and the Falcon tubes were closed and shaken by hand
for 1 min. These samples rested for 17 h at 37 °C in a forced air circulation oven. Next, we added 1 mL of 3.0 mol L-1
HCl and 1 mL of 70 % HClO4. Afterwards, the tubes were
centrifuged for 10 min at 6,000 g, and the supernatant was removed and stored in 20 mL acrylic tubes. To the tissue that remained in Falcon tubes was added 5 mL of 0.5 mol L-1
HClO4, and this was centrifuged for 10 min at 6,000 g. The extract of this centrifugation
was mixed with the extract of the 20 mL acrylic tubes.
A quantity of 5 mL of 0.5 mol L-1 HClO4 was added to the tissue remaining in the Falcon
supernatant was stored in the acrylic tubes. The tissue residue remaining in the Falcon tube was transferred to 15 mL digestion tubes of 50 mL capacity obtaining Pres. A quantity of 2 mL was removed from extracts of the acrylic and Falcon tubes and digested with 2 mL concentrated H2SO4 and 1 mL 30 % H2O2 in a digester block (Tedesco et al., 1995)
using 50 mL digestion tubes. As a result, we obtained Pso, Plip, P-DNA, P-RNA, and Pres. All P (λ 882 nm) fractions were determined and quantified according to Murphy and Riley (1962).
Statistical analysis
The data regarding P content obtained by chemical fractionation of the tissue samples of cover crops was subjected to analysis of variance and when the effects were significant, the means were compared by the Tukey test at 5 % probability (SAS, 2011). The proportions of P forms in the tissue of each treatment at the three sampling times were compared by multivariate analysis of principal component analysis (PCA), based on the correlation between the variables. We did not use the percentage of TASP in this analysis, to avoid redundancy in PCA, since it represents the sum of Pso and Psi.
RESULTS AND DISCUSSION
Distribution of P forms in cover crop residues
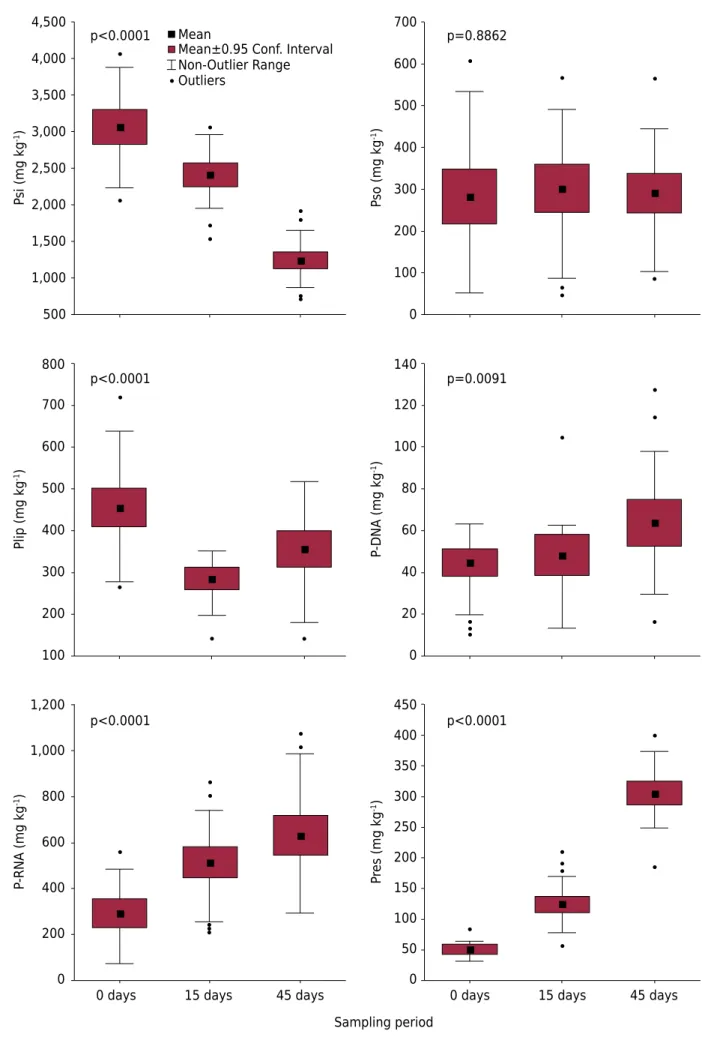
The distribution of P forms in plant tissue at time 0 (0 DAD) occurred in the following order of importance for all treatments: Psi > Pso ≈ Plip ≈ P-RNA > P-DNA ≈ Pres (Figure 2). The Psi form exhibited a content of 3068 ± 566 mg kg-1 in the overall average, representing
approximately 73 ± 14 % of the total P content (Figures 2, 3, and 4). Accumulation of P occurs because plants typically have more than one nutrient uptake mechanism, especially in environments with high availability of Pi (Bieleski, 1973; Martinez et al., 2005). The Psi fraction represents the highest P content in the tissue because plants take up P in the form of orthophosphoric acid, and since not all of the P taken up is used metabolically, it is allocated to storage organelles, especially in the vacuole (Marschner, 2012). This is because most of the P in plant tissue is found in inorganic forms (Casali et al., 2011; Marschner, 2012) and the inorganic P in the tissue makes up the labile compartment. These results corroborate with those obtained by Fernandes et al. (2000), Pereira et al. (2008), Casali et al. (2011), and Oliveira et al. (2016), who noticed that most of the tissue P is found in the soluble inorganic form in well-nourished plants grown in soil with sufficient nutrient content.
Figure 2. Changes in phosphorus forms (a) in residues of weeds (WD); (b) black oat (BO); (c) rye (RY); (d) oilseed radish (RD); (e) oilseed radish + black oat (RD + BO); and (f) oilseed radish + rye (RD + RY) at 0, 15, and 45 days after deposition (DAD) of the litterbags on the soil surface in agroecological no-till onion. Means followed by the same letter in DAD do not differ by the Tukey test (p<0.05).
0 250 500 750 2,000 4,000 6,000 0 250 500 750 2,000 4,000 6,000
Days after deposition of litter bags (DAD)
0 15 45
P (mg kg
-1) 0 250 500 750 2,000 4,000 6,000
0 15 45
a a b a a b a b c a ab b b a a a b c a a b a a b a b c ab a b b a a c b a a a b a a b a b b b a a a b c a a b a b c a a b a b a ab b a b b a b c a b b a b c a b b b b a b b a a b c a b c b (a) (b) (c) (d) (e) (f)
Pis, soluble inorganic P
Pos, soluble organic P
Plip, lipidic P
P-DNA
P-RNA
Pres, residual P
Figure 3. Content of P forms in the plant tissue of all treatments evaluated in terms of sampling time (time 0 and at 15 and 45 days after the deposition of decomposition bags). Psi: soluble inorganic P, Pso: soluble organic P, Plip: lipidic P, P-DNA: P associated with DNA; P-RNA: P associated with RNA; and Pres: residual P fraction.
Sampling period
0 days 15 days 45 days
0 days 4,500
4,000
3,500
3,000
2,500
2,000
1,500
1,000
500
700
600
500
400
Ps
o (mg kg
-1)
Ps
i (mg kg
-1)
P
-DNA (mg kg
-1)
Plip (mg kg
-1)
300
200
100
0
140
120
100
80
60
40
20
0 800
700
600
500
400
300
200
100
Pr
es (mg kg
-1)
P-RNA (mg kg
-1)
450
400
300 350
250
200
150
100
50
0 1,200
1,000
800
600
400
200
0
15 days 45 days p<0.0001
p<0.0001
p<0.0001 p<0.0001
p=0.8862
p=0.0091 Mean
On the other hand, species of the Brasicaceae family, such as oilseed radish, have lower C/N ratio values, lower lignin content, and higher cellulose values, which stimulate the release of P (Doneda et al., 2012).
Phosphorus-RNA is considered a fraction of high recalcitrance because it is the P portion associated with the plant RNA structures and will only be solubilized in the event of decomposition of the plant tissue. The increase in P-RNA content over time may have occurred due to P immobilization by microbial biomass, as well as the formation of byproducts derived from microbial decomposition. Among these byproducts are organic P forms such as teichoic acid, which is an acidic polysaccharide found in the bacterial cell wall (Turner et al., 2005) that is obtained with the cultivation of cover crop species such as legumes (Guggenberger et al., 1996); in addition, P-RNA is present in microbial biomass, which decomposes the residue and makes these levels increase over time.
The P-RNA contents in the mixed cover crops showed no increase from time 0 to 15 DAD. However, the P-RNA contents increased for all single treatments and WD increased from 0 to 15 DAD (Figures 1e, 1f, and 4). These differences may be a consequence of new conditions established in the mixed crops, which seem to have reduced mineralization of plant residues by microorganisms compared to the single treatments (Aita and Giacomini, 2003; Doneda et al., 2012).
The increase in Pres over time in the tissue (Figures 2, 3, and 4) typically happens because it is associated with P-DNA and plant protein structures that will be solubilized with the complete decomposition of plant tissue (Hogue et al., 1970). The release of more recalcitrant P forms to the soil solution is controlled by the mineralization rate of organic matter and depends on microbial activity, which uses carbon skeletons as energy sources, hydrolyzing phosphate esters (Tarafdar and Claassen, 2005).
In order to facilitate interpretation of the results of temporal variation of P forms in the tissue, we carried out a principal component analysis (PCA) using the proportions of P forms in the plant tissue (Figure 5). PCA indicated that the first two principal components (PC1 and PC2) explained 83.56 % of the existing total variation in the samples. The variables that contributed most to PC1 were Psi, P-DNA, P-RNA, and Pres, while the ones
Figure 4. Relative percentage of P fractions in the plant tissue of the residues of weed (WD), black oat (BO), rye (RY), oilseed radish (RD), oilseed radish + black oat (RD + BO), and oilseed radish + rye (RD + RY) extracted by chemical fractionation proposed by Miyachi and Tamiya (1961) with adjustments proposed by Schmidt and Thannhauser (1945) and Casali et al. (2011) in cover crop residues at the time of deposition of cover crop residues on the soil (time 0) and at 15 and 45 days after the deposition (DAD) of litterbags on the soil surface in agroecological no-till onion.
0 DAD
0 20 40 60 80 100
WD BO RY RD RD + BO RD + RY
15 DAD
Psum (%)
0 20 40 60 80 100
45 DAD
0 20 40 60 80 100
Psi, soluble inorganic P
Pso, soluble organic P
Plip, lipidic P
P-DNA
P-RNA
that contributed most to PC2 were Pso and Plip (Table 2). The projection of P forms in the cover crop tissue at different sampling times clearly demonstrates that over time the proportion of Psi in plant residue decreases and the contribution of P-RNA, P-DNA, and Pres fractions increases (Figure 5).
As the P fractions were ranked in terms of times and treatments by PCA (Figure 5), we observed a predominance of the P-RNA and Pso fractions in the RD, RD + RY, and RD + BO treatments, which is in accordance with the higher proportion of those fractions in those treatments at 45 DAD (Figure 4, Table 3). The values of the Pres and P-DNA fractions are close and separated from the other fractions (Figure 5). This confirms that the increase of Pres over time in plant tissue is associated with P-DNA, especially in the single RY and BO treatments, which are closer to the values of the Pres and P-DNA fractions and reach their highest proportions at 45 DAD (Figure 4, Table 3). As for the
Table 2. Contribution of the variables for the first two principal components
Phosphorus form PC1 PC2
%
Soluble inorganic P (Psi) 24.8 0.5
Soluble organic P (Pso) 9.8 32.7
Lipid P (Plip) 6.1 53.5
P associated with DNA (P-DNA) 17.6 1.9
P associated with RNA (P-RNA) 19.4 7.4
Residual P fraction (Pres) 22.3 4.0
Total 100.0 100.0
Values in bold indicate variables contributing more than 60 % of the variable with the highest contribution for each principal component.
Figure 5. Projection of P forms in the plant residues of weed (WD), black oat (BO), rye (RY), oilseed radish (RD), oilseed radish + black oat (RD + BO), and oilseed radish + rye (RD + RY) at different sampling times. Numbers in parentheses indicate the percentage of variance explained by each axis. The direction of the arrows indicates the sampling times, the first at 0 and then at 15 and 45 days after deposition (DAD) of litterbags.
-4.0 -3.0 -2.0 -1.0 0.0 1.0 2.0 3.0 4.0
-4.0 -3.0 -2.0 -1.0 0.0 1.0 2.0 3.0 4.0
Pr
incipal component 2 (17.90 %)
Principal component 1 (65.66 %) WD BO RY RD RD + BO RD + RY
Psi
Pso P-DNA Pres
Plip
Plip fraction, we observed that it separated from the other fractions, and it is related to the BO and WD treatments, which showed the two highest proportions of Plip at 45 DAD (Figure 4, Table 3).
Mineralization of cover crop P forms
The forms of total P, Psi, Plip, Pso, and Pres decreased from time 0 (0 DAD) to 45 DAD during decomposition of WD, BO, RY, RD, RD + BO, and RD + RY (Figure 2). In contrast, we observed increased contents of P-DNA and P-RNA during decomposition of the residues of all the treatments in the same period. This is due to the difference in accumulation of P forms in the tissue. It indicates that the P release rate depends not only on total content in the tissues (Oliveira et al., 2016), but also on how P is stored, in addition to other characteristics of the residue, such as C/N ratio (Tables 1 and 4) and leaching of water-soluble compounds degraded by the microbial population of plant residues (Ferreira et al., 2014). According to Aita and Giacomini (2003), this is because most microorganisms, especially fungi and bacteria, which colonize plant residues and part of total soil organic C, are used during decomposition as a source of ATP and are in part released into the atmosphere in the form of CO2 (Manzoni et al., 2008).
Table 3. Difference in the relative proportion of phosphorus forms between the sampling times of weed (WD), black oat (BO), rye (RY), oilseed radish (RD), oilseed radish + black oat (RD + BO), and oilseed radish + rye (RD + RY) residues
Treatment Psi Pso Plip P-DNA P-RNA Pres
∆% in the first 15 days (initial % - % 15 DAD)
WD -6.3 3.4 -3.0 -0.5 5.8 0.8
BO -19.9 2.3 -1.0 1.0 13.7 3.9
RY -0.9 -5.3 -3.7 0.0 8.2 1.8
RD -4.4 -0.8 -2.7 0.2 6.0 1.7
RD + BO -6.5 4.3 -3.5 0.4 2.5 2.8
RD + RY -7.2 2.8 -4.1 0.2 6.1 2.2
∆% in the first 45 days (initial % - % 45 DAD)
WD -17.8 -1.4 3.2 0.9 6.5 8.5
BO -32.9 1.5 6.7 1.7 11.9 11.1
RY -27.9 3.2 0.0 1.7 12.5 10.5
RD -31.8 5.5 0.9 0.7 14.0 10.7
RD + BO -33.4 4.9 -2.2 1.6 21.9 7.3
RD + RY -36.4 5.0 1.2 0.2 21.7 8.3
Psi: soluble inorganic P; Pso: soluble organic P; Plip: lipid P; P-DNA: P associated with DNA; P-RNA: P associated with RNA; and Pres: residual P fraction.
Table 4. Carbon/nitrogen ratio of remaining dry matter from the residues of weed (WD), black oat (BO), rye (RY), oilseed radish (RD), oilseed radish + black oat (RD + BO), and oilseed radish + rye (RD + RY) deposited on the onion row
Treatment Days after deposition of litterbags (DAD)
0 15 45
WD 16 b 17 b 15 b
BO 19 ab 27 ab 21 a
RY 23 a 28 a 20 a
RD 17 b 25 ab 24 ab
RD + BO 17 b 29 a 23 a
RD + RY 16 b 31 a 27 a
CV (%) 10.5 18.3 17.4
The variation over time in the relative distribution of P forms was similar in every treatment (Figure 4), except for the BO and WD treatments. After 15 DAD, the BO treatment showed a more marked decrease in the proportion of Psi (20 %) compared to the other treatments (5.1 ± 2.5 %), while P-RNA showed the highest increase (13.7 %) among treatments (5.7 ± 2.1 %) (Table 3). This shows that in the first weeks, BO had the highest capacity for release of P stored in the vacuolar inorganic form. This is similar to results observed by Casali et al. (2011), who compared the release of P forms in black oat, vetch, and forage turnip residues in an experiment conducted in an Oxisol under no-tillage and conventional tillage. Furthermore, the predominance of P-RNA after 15 DAD in AV residues depends on its mineralization and release of P, with consequent uptake by the onion root system (Oliveira et al., 2016).
After 45 DAD, the release of Psi from cover crops (BO, RY, and RD) and mixed cover crops (RD + BO and RD + RY) was similar (32.5 ± 3.1 %), and it was approximately two times higher than the release of Psi by WD (17.8 %) (Table 3). However, WD had the lowest increase in the proportion of P-RNA (6.5 %) after 45 DAD, and this was approximately two times lower than in the other treatments (16.4 ± 5.0 %) (Table 3). This is due to lignin content and the C/N ratio (Tables 1 and 4), because WD residues with proportionally higher N content and a C/N ratio lower than 30 (16 in WD) are more readily colonized by the microbial population, compared to those with a C/N ratio higher than 30. This is because there is more N (26.2 g kg-1) available for the
formation of its tissue, which increases mineralization of residue components and is consequently reflected in less residual P (Ferreira et al., 2014). Therefore, the lower amount of P at 45 DAD in WD is partly due to the higher contents of N (26.2 g kg-1)
and the N added by dry matter (120.9 kg ha-1) and lower values for lignin and the
C/N ratio, which were lower due to the mixture of several species, including grasses and legumes (Table 1).
CONCLUSIONS
In addition to total P concentration, the release of P from cover crop tissue also depends on the form of P accumulated in the tissue and the quality of the residue.
The highest accumulation of P in cover crops occurred in the soluble inorganic P fraction, which is the fraction of fastest release in the tissue of all the plants.
Black oat had the highest initial release rate of soluble inorganic P, but the rate became equal to the release rate of other cover crop residues at 45 days after deposition. However, weeds released only half the amount of soluble inorganic P in the same period, despite accumulating a considerable amount of P in their biomass.
The oilseed radish + rye and oilseed radish + black oat mixtures showed a higher release of P-RNA at 45 days after deposition compared to the single treatments.
ACKNOWLEDGMENTS
We would like to express our sincere gratitude to MCTI/MAPA/MDA/MEC/MPA/CNPq No. 81/2013 and Universal - MCTI/CNPq No. 14/2014 for financial support. Our gratitude also to the CNPq for the Research Productivity Grant to the second, fourth, and last author.
REFERENCES
Bezerra RPM, Loss A, Pereira MG, Perin A. Frações de fósforo e correlação com atributos edáficos
sob sistemas de plantio direto e integração lavoura-pecuária no Cerrado Goiano. Semina: Cienc Agrár. 2015;36:1287-306. doi:10.5433/1679-0359.2015v36n3p1287
Bieleski RL, Ferguson JB. Physiology and metabolism of phosphate and its compounds. In: Lachli A, Cieleski RL, editors. Encyclopedia of plant physiology. Inorganic plant nutrition. Berlin: Spring; 1983. p.422-49. (New series, v.15A).
Bieleski RL. Effect of phosphorus deficiency on levels of phosphorus compounds in Spirodela.
Plant Physiol. 1976;43:1309-16. doi:10.1104/pp.43.8.1309
Bieleski RL. Phosphate pools, phosphate transport, and phosphate availability. Ann Rev Plant Physiol. 1973;24:225-52. doi:10.1146/annurev.pp.24.060173.001301
Broetto T, Tornquist CG, Bayer C, Campos BC, Merten CG, Wottrich B. Soils and surface waters
as affected by long-term swine slurry application in Oxisols of southern Brazil. Pedosphere.
2014;24:585-94. doi:10.1016/S1002-0160(14)60044-8
Casali CA, Kaminski J, Piccin R, Arbugeri FE, Doneda A. Mineralização das formas de fósforo do tecido de plantas de cobertura. Inf Agron - INPI. 2011;135:21-4.
Claessen MEC, organizador. Manual de métodos de análise de solo. 2a ed. Rio de Janeiro: Centro Nacional de Pesquisa de Solos; 1997.
Comissão de Química e Fertilidade do Solo-RS/SC - CQFSRS/SC. Manual de adubação e de calagem para os estados para os estados do Rio Grande do Sul e Santa Catarina. 10a ed. Porto Alegre: Sociedade Brasileira de Ciência do Solo; 2004.
Doneda A, Aita C, Giacomini SJ, Miola ECC, Giacomini DA, Schirmann J, Gonzatto R. Fitomassa e decomposição de resíduos de plantas de cobertura puras e consorciadas. Rev Bras Cienc Solo. 2012;36:1714-23. doi:10.1590/S0100-06832012000600005
Eberhardt DN, Vendrame PRS, Becquer T, Guimarães MF. Influência da granulometria e da
mineralogia sobre a retenção do fósforo em Latossolos sob pastagens no cerrado. Rev Bras Cienc Solo. 2008;32:1009-16. doi:10.1590/S0100-06832008000300010
Fernandes LA, Faquin V, Furtini Neto AE, Curi N. Frações de fósforo e atividade da fosfatase ácida em plantas de feijoeiro cultivadas em solos de várzea. Rev Bras Cienc Solo.
2000;24:561-71. doi:10.1590/S0100-06832000000300010
Ferreira PAA, Girotto E, Trentin G, Miotto A, Melo GW, Ceretta CA, Kaminski J, Frari BK Del, Marchezan C, Silva LOS, Faversani JC, Brunetto G. Biomass decomposition and nutrient release from black oat and hairy vetch residues deposited in a vineyard. Rev Bras Cienc Solo. 2014;38:1621-32. doi:10.1590/S0100-06832014000500027
Fink JR, Inda AV, Bavaresco J, Barrón V, Torrent J, Bayer C. Adsorption and desorption of
phosphorus in subtropical soils as affected by management system and mineralogy. Soil Till
Res. 2016;155:62-8. doi:10.1016/j.still.2015.07.017
Fink JR, Inda AV, Bayer C, Torrent J, Barrón V. Mineralogy and phosphorus adsorption in soils of south and central-west Brazil under conventional and no-tillage systems. Acta Sci Agron. 2014;36:379-87. doi:10.4025/actasciagron.v36i3.17937
Frossard E, Brossard M, Hedley MJ, Metherell A. Reactions controlling the cycling of P in soils. In: Tiessen H,
editor. Phosphorus in the global environment. Chichester: John Wiley & Sons; 1995. p.107-35.
Gentile R, Vanlauwe B, van Kessel C, Six J. Managing N availability and losses by combining
fertilizer-N with different quality residues in Kenya. Agric Ecosyst Environ. 2009;131:308-14.
doi:10.1016/j.agee.2009.02.003
Gérard F. Clay minerals, iron/aluminum oxides, and their contribution to phosphate sorption in soils - A myth revisited. Geoderma. 2016;262:213-26. doi:10.1016/j.geoderma.2015.08.036
Grantham J. Be persuasive. Be brave. Be arrested (if necessary). Nature. 2012;491:303. doi:10.1038/491303a
Guggenberger G, Haumaier L, Thomas RJ, Zech W. Assessing the organic phosphorus status of
Hogue E, Wilcox GE, Cantliffe DJ. Effect of soil phosphorus levels on phosphate fractions in tomato leaves. J Am Soc Hort Sci. 1970;95:174-6.
Kottek M, Grieser J, Beck C, Rudolf B, Rubel F. World map of the Köppen-Geiger climate
classification updated. Meteorol Zeitschrift. 2006;15:259-63. doi:10.1127/0941-2948/2006/0130 Lajtha K, Harrison AF. Strategies of phosphorus acquisition and conservation by plant species and communities. In: Tiessen H, editor. Phosphorus in the global environment; transfers, cycles,
and management. Chichester: Wiley; 1995. p.139-47.
Loss A, Basso A, Oliveira BS, Koucher LP, Oliveira RA, Kurtz C, Lovato PE, Curmi P, Brunetto G, Comim JJ. Carbono orgânico total e agregação do solo em sistema de plantio direto agroecológico e convencional de cebola. Rev Bras Cienc Solo. 2015;39:1212-24. doi:10.1590/01000683rbcs20140718
Manzoni S, Jackson RB, Trofymow JA, Porporato A. The global stoichiometry of litter nitrogen mineralization. Science. 2008;321:684-6.
Marschner P. Marschner’s mineral nutrition of higher plants. 3rd ed. New York: Academic Press; 2012.
Martinez HEP, Novais RF, Rodrigues LA, Sacramento LVS. Phosphate forms in plant and their internal buffering in five soybean cultivars. Rev Bras Cienc Solo. 2005;29:249-57.
doi:10.1590/S0100-06832005000200010
Miyachi S, Tamiya T. Distribution and turnover of phosphate compounds in growing chlorella cells. Plant Cell Physiol. 1961;2:405-14. doi:10.1093/jxb/ert466
Monegat C. Manejo de plantas de cobertura do solo em pequenas propriedades. Plantas de cobertura do solo características e manejo em pequenas propriedades. Chapecó: Edição do Autor; 1991. p.146-239.
Murphy J, Riley JP. A modified single solution method for the determination of phosphate in
natural waters. Anal Chim Acta. 1962;27:31-6. doi:10.1016/S0003-2670(00)88444-5
Niu F, Zhang D, Li Z, van Iersel MW, Alem P. Morphological response of eucalypts seedlings to phosphorus supply through hydroponic system. Sci Hortic. 2015;194:295-303.
doi:10.1016/j.scienta.2015.08.029
Oliveira RA, Brunetto G, Loss A, Gatiboni LC, Kürtz C, Müller Júnior V, Lovato PE, Oliveira BS,
Souza M, Comin JJ. Cover crops effects on soil chemical properties and onion yield. Rev Bras
Cienc Solo. 2016;40:e0150099. doi:10.1590/18069657rbcs20150099
Pereira JM, Cambraia J, Fonseca Júnior ÉM, Ribeiro C. Efeito do alumínio sobre a
absorção, o acúmulo e o fracionamento do fósforo em sorgo. Bragantia. 2008;67:961-7. doi:10.1590/S0006-87052008000400019
Resende JCF, Bustamante MMC, Markewitz D, Klink CA, Davidson EA. Phosphorus cycling in a small watershed in the Brazilian Cerrado: impacts of frequent burning. Biogeochemistry. 2011;105:105-18. doi:10.1007/s10533-010-9531-5
Statistical Analysis System -SAS. SAS/STAT 9.3 user’s guide. Cary: 2011.
Schmidt G, Thannhauser SJA. A method for the determination of desoxyribonucleic acid, ribonucleic acid, and phosphoproteins in animal tissues. J Biol Chem. 1945;161:83-9.
Schmitt DE, Comin JJ, Ceretta CA, Gatiboni LC, Tiecher T, Lorensini F, Heinzen J, Ambrosini VG,
Moraes MP, Brunetto G. Accumulation of phosphorus fractions and contamination potential in vineyard soils in the southern region of the state of Santa Catarina, Brazil. Rev Bras Cienc Solo. 2013;37:1256-66. doi:10.1590/S0100-06832013000500015
Soil Survey Staff. Soil taxonomy: a basic system of soil classification for making and interpreting soil surveys. 2nd ed. Washington, DC: US Government Printing Office; 2006.
Tagliavini M, Tonon G, Scandellari F, Quiñones A, Palmieri S, Menarbin G, Gioacchini P, Masia A. Nutrient recycling during the decomposition of apple leaves (Malus domestica) and mowed grasses in an orchard. Agric Ecosyst Environ. 2007;118:191-200.
doi:10.1007/s10533-011-9599-6
Tedesco MJ, Gianello C, Bissani C., Bohnen H, Volkweiss SJ. Análises de solo, planta e outros
materiais. 2a ed. Porto Alegre: Universidade Federal de Porto Alegre; 1995.
Tiecher T, Oliveira LB, Caner L, Brunetto G, Bortoluzzi EC, Rheinheimer DS, Casali CA, Zafar M, Tiecher TL. Cover crops affecting soil phosphorus dynamics in Brazilian highly weathered soils. In: Reuter J, editor. Cover crops: cultivation, management and benefits. New York: Nova Science
Publishers; 2015. p.23-52.
Turner BL, Cade-Menunb BJ, Condronc LM, Newmand S. Extraction of soil organic phosphorus. Talanta. 2005;66:294-306. doi:10.1016/j.talanta.2004.11.012
Viola R, Benin G, Cassol LC, Pinnow C, Flores MF, Bornhofen E. Adubação verde e nitrogenada na cultura do trigo em plantio direto. Bragantia. 2013;72:90-100. doi:10.1590/S0006-87052013005000013