Revista Brasileira de
Engenharia Agrícola e Ambiental
Campina Grande, PB, UAEA/UFCG – http://www.agriambi.com.br
v.21, n.3, p.197-202, 2017
Arugula production as a function of irrigation depths
and potassium fertilization
Elis M. de Freitas
1, Luan B. Giovanelli
2, Fábio T. Delazari
3,
Márcio L. dos Santos
3, Silvio B. Pereira
2& Derly J. H. da Silva
3 DOI: http://dx.doi.org/10.1590/1807-1929/agriambi.v21n3p197-202A B S T R A C T
Arugula is a vegetable that has gained more highlight in the consumption, being rich in potassium, sulfur, iron, omega-3 and vitamins A and C. Availability of water and nutrients are limiting factors for production of this crop. In this context, the objective of this study was to evaluate the production of arugula subjected to different irrigation depths and potassium fertilization. The experiment was conduct between August and September 2015. The experimental design was completely randomized in split-plot scheme. Irrigation depths L1, L2, L3 and L4 (25, 50, 75 and 100% of crop evapotranspiration, respectively) represented the plots and potassium doses K1 and K2 (200 and 400 kg ha-1, respectively) represented the
subplots. Although the highest yield was obtained with highest irrigation depth and highest potassium dose, it is recommended the cultivation of arugula with the lowest irrigation depth and the lowest potassium dose, considering the higher value of water use efficiency for this treatment.
Produção da rúcula em função da lâmina
de irrigação e da adubação potássica
R E S U M O
A rúcula é uma hortaliça que tem ganhado cada vez mais destaque na alimentação, sendo rica em potássio, enxofre, ferro, ômega-3 e vitaminas A e C. É uma cultura que possui, como fatores limitantes para sua produção, a disponibilidade de água e de nutrientes, contexto no qual se objetivou, neste trabalho, avaliar a produção da rúcula submetida a diferentes lâminas de irrigação e doses de adubação potássica. O experimento foi conduzido entre agosto e setembro de 2015. O delineamento experimental utilizado foi o inteiramente casualizado, no esquema de parcelas subdivididas. As parcelas foram representadas pelas lâminas de irrigação L1, L2, L3 e L4 (25, 50, 75 e 100% da evapotranspiração da cultura, respectivamente), e as subparcelas pelas doses de potássio K1 e K2 (200 e 400 kg ha-1, respectivamente). Embora
a maior produtividade tenha sido obtida com a maior lâmina de irrigação e maior dose de potássio, recomenda-se o cultivo da rúcula com a menor lâmina e menor dose, haja vista o maior valor de eficiência do uso da água para este tratamento.
Key words:
Eruca sativa L. drip tape plant nutrition
Palavras-chave:
Eruca sativa L. fita gotejadora nutrição de plantas
1 Universidade Federal dos Vales do Jequitinhonha e Mucuri/Centro de Ciências Agrárias/Departamento de Agronomia. Viçosa, MG. E-mail:
2 Universidade Federal de Viçosa/Centro de Ciências Agrárias/Departamento de Engenharia Agrícola. Viçosa, MG. E-mail: [email protected];
3 Universidade Federal de Viçosa/Centro de Ciências Agrárias/Departamento de Fitotecnia. Viçosa, MG. E-mail: [email protected] (Corresponding
author); [email protected]; [email protected]
composition. Still according to these authors, it is a crop highly sensitive to water deficit and irrigation is a very important practice for its good development and better yield.
Another relevant factor in arugula production is its nutrition. It is known that the adequate supply of nutrients from the stage of plantlet until harvest favors the success of the production of any vegetable. For arugula, any nutritional imbalance can be irreversible due to the short growth period (Cecílio Filho et al., 2014).
In this context and in relation to the availability of nutrients, potassium has become important because, according to Silveira et al. (2015), it participates in the synthesis of sugars and proteins in the process of photosynthesis to obtain energy, in the translocation of carbohydrates and proteins and in water absorption.
Considering the importance of the arugula crop and the absence of information on its water-nutritional requirement, the present study aimed to evaluate the production of arugula subjected to different irrigation depths and potassium fertilization doses.
Material and Methods
The experiment was conducted at the Research Vegetable Garden of the Federal University of Viçosa (UFV), in Viçosa, MG, situated at 20º 45’ 14’’ S, 42° 52’ 53’’ W and altitude of 648 m, between August and September 2015.
After physical analysis of the soil in the experimental area, it was classified as sandy clay loam (Lemos & Santos, 2005), showing values of 33.00 g 100g-1 of clay, 19.00 g 100g-1 of silt and 48.00 g100 g-1 of sand. The values of volumetric moisture at field capacity and permanent wilting point were 0.36 and 0.22 m3 m-3, respectively. The chemical analysis exhibited the following characteristics of the soil: pH: 6.3, using a pH meter; base saturation (V): 52%; mean content of organic matter, determined by the Walkley-Black method: 3.1 dag kg-1; available contents of P and K, extracted with Mehlich I: 24.6 and 120.0 mg dm-3, respectively; exchangeable contents of Ca2+ and Mg2+, extracted with 1.0 mol L-1 KCl: 3.1 and 0.8 cmolc dm-3, respectively; potential acidity (H+Al), extracted with 1.0 mol L-1 calcium acetate at pH 7.0; 4.0 cmol
c dm -3 and CEC at pH 7.0, determined through the sum of Ca2+ + Mg2+ + K++ (H+Al): 8.2 cmol
c dm -3.
The experimental design was completely randomized (CRD) in split-plot scheme, with five replicates, and each replicate consisted of three plants. Plots were represented by the irrigation depths L1, L2, L3 and L4, referring to 25, 50, 75 and 100% of crop evapotranspiration (ETc), respectively.
‘Astro’. Transplanting occurred on September 2, when the seedlings reached the first pair of true leaves. 400 seedlings were transplanted at spacing of 0.10 x 0.20 m and arranged in 4 beds (1 m wide x 2 m long). Each bed received one irrigation depth and the potassium doses. The experimental plots had total area of 0.7 m2, evaluation area of 0.3 m2 and were separated by 30 cm. Arugula plants were harvested on September 28.
A drip tape was used, operating with flow rate of 1.72 L h-1, at pressure of 10.0 mwc, and Christiansen Uniformity Coefficient (CUC) of 98.7%. The drippers on the tape were spaced by 0.30 m. On the beds, the tapes were spaced by 0.40 m, resulting in an application intensity of 14.35 mm h-1.
Irrigation frequency of two to three days was used in the management of irrigation depth, with water demand calculated by the estimate of crop evapotranspiration (ETc), constituting the treatments. Eqs. 1 and 2 were used to estimate crop evapotranspiration (Allen et al., 2006; Angeli et al., 2016).
ETc=ETo Kc×
(
)
Kc= Kcb Ks× +Ke
where:
ETc - crop evapotranspiration, mm d-1; ETo - reference evapotranspiration, mm d-1; Kc - crop coefficient;
Kcb - basal crop coefficient;
Ke - soil evaporation coefficient; and, Ks - stress coefficient.
The arugula cycle was divided into phenological stages based on the growth period or vegetative period, related to the shading of the area, in which each stage assumed a different value of crop coefficient (Kc). The calculations used coriander Kcb values, because of the lack of information on arugula. The initial, intermediate and final Kcb values were 0.15, 1.10 and 0.70, respectively (Silva et al., 2013).
Along the experiment, the irrigation depths applied in the treatments referring to 25, 50, 75 and 100% of crop evapotranspiration (ETc) were 19.7, 39.5, 59.2 and 79.0 mm, respectively.
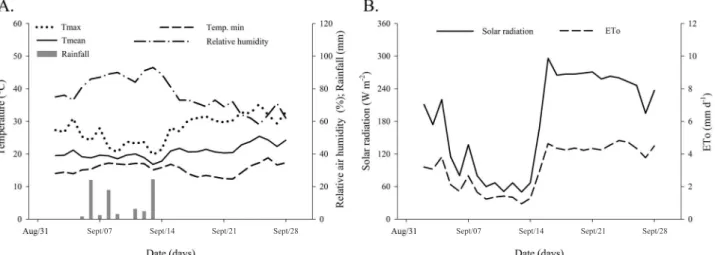
The daily data of maximum, mean and minimum temperature (oC) and relative air humidity (%), solar radiation (W m-2) and reference evapotranspiration (ETo, in mm d-1), used for irrigation management are presented in Figure 1. These data were obtained using a meteorological station installed in the experimental area.
(1)
Soil acidity was not corrected, because the pH of the soil of the experiment (6.3) was within the ideal range (5.5 to 6.5) recommended to maintain ideal levels of macro and micronutrients for cultivated plants (Ribeiro et al., 1999). At transplanting, the soil received 600 kg ha-1 of P
2O5 in the form of single superphosphate (18% P2O5) and 400 kg ha-1 of N in the form of ammonia sulfate (20% N). Potassium fertilization was split using KCl (59% of K2O) as source of K. In the treatment K1 (200 kg ha-1 of K
2O), half of the dose was applied at planting and the other half split into two applications - at 8 and 16 days after transplanting (DAT). For the treatment K2 (400 kg ha-1 of K
2O), 42.25% of the recommended dose was applied at planting and the rest split into two similar applications, at 8 and 16 DAT.
After reaching the commercial size of 20 to 30 cm, the 15 central plants of each treatment were harvested and their heights were measured. After harvest, leaves were passed in the leaf area integrator LAI 3010 (Licor Inc., Lincoln, NE, USA) and the fresh matter was quantified. Water use efficiency (WUE) was also evaluated, defined by the relationship between production and the applied water volume, expressed in kg m-3. On the day of harvest, leaf temperature was measured with an
infrared thermometer and chlorophyll index was determined with a ClorofiLog device (Falker, Porto Alegre, RS, Brazil).
The data were analyzed through regression analysis. The equations were fit for each K dose correlating the irrigation depths with the evaluated characteristics. The regression models were selected based on the significance of the regression coefficients using the t-test at 0.1 probability level.
Results and Discussion
The responses of arugula yield and height to the irrigation depths for each K dose are presented in Figure 2.
It is observed in Figure 2 that the increment of 1% in ETc promoted a yield increase of 0.1308 t ha-1 in the treatments that received the dose K1 and 0.2604 t ha-1 in those that received the dose K2.
The plant responded positively to the increment in K doses as the irrigation depths increased. For lower irrigation depths (25 and 50% of ETc), the supply of K little influenced yield. For the irrigation depth of 25%, for instance, twice the K dose led to lower yield. This behavior can be attributed to the fact that potassium chloride is a salt, which may have increased the Figure 1. Daily values of maximum, mean and minimum temperature, relative air humidity and rainfall (A) and solar radiation and reference evapotranspiration (B) for the period of arugula cultivation
***Significant at 0.1 probability level by t-test
Figure 2. Response of arugula yield (A) and height (B) as a function of the applied irrigation depth (% ETc) for each potassium dose
decrease in turgor and, associated with this event, the reduction of the process of plant growth in extension (Chaves Filho & Stacciarini-Seraphin, 2001; Larcher, 2006). Under water deficit condition, there is a restriction to biomass accumulation, which damages the number of leaves both in the initial and later stages, limiting the dimension of individual leaves and, consequently, total leaf area, number and growth rates of branches and stem growth (Osório et al., 1998).
Another hypothesis that may have contributed to the increment in yield as K doses and irrigation depths increased is the relationship between K and N, the water supply and the dynamics of K+ in the soil. K can act in the better use of other nutrients in the plant, such as N, which was observed in the treatments that received the highest irrigation depths. With greater K availability, there is a better assimilation of N, which acts in the increase of photosynthetic activity due to the higher chlorophyll indices. Hence, the use of N allows the increase in its absorption, assimilation and nutrition and, consequently, in plant yield (Viana & Kiehl, 2010).
According to Figure 2B, the variable plant height followed a behavior similar to that of yield. As the irrigation depth increased for both K doses, plant height increased. The highest K dose (K2), associated with the highest irrigation depth (L4), resulted in the highest value of plant height (42 cm).
The increment of 1% in ETc caused an increase of 0.0645 cm in plant height in the treatment K1 and 0.1354 cm in the treatment K2, being almost two times higher in the treatment with the highest K dose.
dose are presented in the figure below.
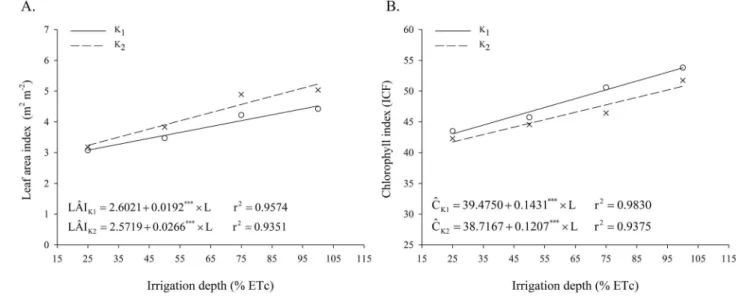
According to Figure 3, when the irrigation depth L1 was applied, in comparison to L4, for both K doses, there was an increment in leaf area index. The greater supply of K promoted an increase in the variation of leaf area index from 0.0192 to 0.0266 m2 m-2 for each 0.01 increase in the ETc applied in the treatments.
The highest value of leaf area index (5.2 m2 m-2) was observed in the irrigation depth L4 for the dose K2. These results allowed to infer that plants under water deficit showed reduced leaf area and leaf area index, a condition evidenced by plants subjected to the irrigation depth L1. Leaf area is an important factor in the production and determines the use of water by plants and their yield potential is severely inhibited when exposed to water deficit (Fernández et al., 1996). Water stress limits not only the size of individual leaves, but also the number of leaves, because it decreases the number and growth rates of the branches (Taiz et al., 2015).
The regression analysis for the characteristic chlorophyll index (CI) is presented in Figure 3B. For both K1 and K2 doses, the chlorophyll index decreased always when the water deficit, caused by the application of the lowest irrigation depths, was accentuated. Gonçalves et al. (2010) and Jangpromma et al. (2010) also observed reduction in the chlorophyll index of plants subjected to water stress, in comparison to plants satisfactorily irrigated. The highest value of chlorophyll was observed in the treatment L4K1,related to the irrigation depth of 100% ETc and K dose equal to 200 kg ha-1 of K
2O.
***Significant at 0.1 probability level by t-test
It should be pointed out that the application of the dose K1 promoted higher values of CI in comparison to K2, for all irrigation depths, which can be explained by the fact that the chlorophyll index is dimensionless and proportional to values measured at the laboratory, as g chlorophyll g-1 leaf or g chlorophyll area-1 of the leaf. Since the dose K
1 contributed to lower yield increments (Figure 2A) and leaf area index (Figure 3A), as the irrigation depths increased, compared with the dose K2, the divider of the ratios - g chlorophyll g-1 leaf or g chlorophyll area-1 of the leaf - used to calculate CI, tends to be smaller, increasing the values of CI.
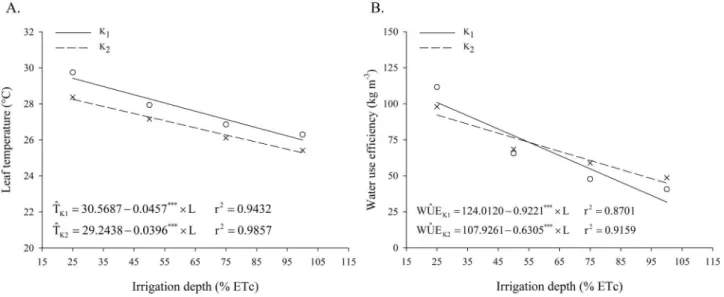
The responses of the variables leaf temperature and water use efficiency as a function of the irrigation depths for each K dose are presented in Figure 4.
Based on the results, there was a decrease in temperature with the increase of irrigation depths for both K doses. The highest temperature was observed in the treatment L1K1, related to the irrigation depth of 25% of ETc and dose of 200 kg ha-1 of K
2O.
Under water stress, plants exhibit higher leaf temperature, in comparison to those cultivated under full water availability conditions (Testi et al., 2008). Trentin et al. (2011) observed that leaf temperature is closely associated with the process of transpiration. As it increases, there is a reduction in leaf temperature due to the dissipation of energy in the form of latent heat.
Since the lowest K dose promoted lower plant development, reducing height (Figure 2B) and leaf area index (Figure 3A), compared with the highest dose, there was lower transpiration of the plants in these treatments, increasing leaf temperature, as explained above.
As to the water use efficiency (WUE, Figure 4B), the increase in irrigation depths caused lower water use efficiency at both K doses, but at the highest irrigation depths - L3 and L4 - the dose K2 was more efficient in the use of water, while at the lowest irrigation depths L1 and L2 - the dose K1 was more efficient.
The decrease in water use efficiency as the irrigation depths increased indicates that the increase in yield was not proportional to the increment in water supply. For the dose K1,
the increase of four times in the irrigation depth (25 to 100% of ETc) promoted only an increment of approximately 1.5 times in the value of yield, while at the dose K2 this increase in the irrigation depth promoted only an increment of approximately two times in the value of yield. The dose K2 led to higher WUE values for the lowest irrigation depths, because there was a greater increment of yield in these treatments with the increase in the applied irrigation depth, compared with the dose K1.
Coelho et al. (2005) claim that water use efficiency can be increased by reducing the applicable irrigation depth (evapotranspiration) in such a way to not drastically reduce yield. According to these authors, this alternative would lead to the maintenance of a high efficiency of the irrigation system, increasing water use efficiency by the reduction in the actual irrigation depth necessary during the stages of growth and development considered not critical for the plants, without significant damage to the expected potential yield.
Conclusions
1. Maximum values of yield, plant height and leaf area index were obtained with the application of the highest irrigation depth and highest potassium dose.
2. The lowest potassium dose, associated with the lowest irrigation depth, promoted the highest values of leaf temperature and water use efficiency and, when associated with the highest irrigation depth, increased the value of chlorophyll index.
3. Although the highest yield was obtained with the highest irrigation depth and highest potassium dose, it is recommended to cultivate arugula with the lowest irrigation depth and lowest dose, because of the higher water use efficiency for this treatment.
Literature Cited
Allen, R. G.; Pereira, L. S.; Raes, D.; Smith, J. Evapotranspiration del cultivo: Guias para la determinación de los requerimientos de agua de los cultivos. Roma: FAO, 2006. 298p.
***Significant at 0.1 probability level by t-test
Figure 4. Response of leaf temperature (LT) and water use efficiency (WUE) as a function of the applied irrigation depth
Cecílio Filho, A. B.; Maia, M. M.; Mendoza-Cortez, J. W.; Rodrigues, M. A.; Nowaki, R. H. D. Épocas de cultivo e parcelamento da adubação nitrogenada para rúcula. Comunicata Scientiae, v.5, p.252-258, 2014.
Chaves Filho, J. T.; Stacciarini-Seraphin, E. Alteração no potencial osmótico e teor de carboidratos solúveis em plantas jovens de lobeira (Solanum lycocarpum St.-Hil.) em resposta ao estresse hídrico. Revista Brasileira de Botânica, v.24, p.199-204, 2001. Coelho, E. F.; Coelho Filho, M. A.; Oliveira, S. L. Agricultura irrigada:
Eficiência de irrigação e de uso de água. Bahia Agrícola, v.7, p.57-60, 2005.
Fernández, C. J.; Mcinnes, K. J.; Cothren, J. T. Water status and leaf area production in water-and nitrogen-stressed cotton. Crop Science, v.36, p.1224-1233, 1996. https://doi.org/10.2135/ cropsci1996.0011183X003600050026x
Gonçalves, E. R.; Ferreira, V. M.; Silva, J. V.; Endres, L.; Barbosa, T. P.; Duarte, W. de G. Trocas gasosas e fluorescência da clorofila a em variedades de cana-de-açúcar submetidas à deficiência hídrica. Revista Brasileira de Engenharia Agrícola e Ambiental, v.14, p.378-386, 2010. https://doi.org/10.1590/S1415-43662010000400006 Gonzalez, A. F.; Ayub, R. A.; Reghin, M. Y. Conservação de rúcula
minimamente processada produzida em campo aberto e cultivo protegido com agrotêxtil. Horticultura Brasileira, v.24, p.360-360, 2006. https://doi.org/10.1590/S0102-05362006000300018 Jangpromma, N.; Songsri, P.; Thammasirirak, S.; Jaisil, P. Rapid
assessment of chlorophyll content in sugarcane using a SPAD chlorophyll meter across different water stress conditions. Asian Journal of Plant Sciences, v.9, p.368-374, 2010. https://doi. org/10.3923/ajps.2010.368.374
M.; Polyzel, A. C.; Silva, T. J. A. Adubação potássica em plantas de rúcula: Produção e eficiência no uso da água. Revista Agro@ mbiente, v.7, p.28-35, 2013.
Ribeiro, A. C.; Guimarães, P. T. G.; Alvarez V., V. H. Recomendação para o uso de corretivos e fertilizantes em Minas Gerais. 5ª aproximação. Viçosa: Comissão de Fertilidade do Solo do Estado de Minas Gerais, 1999. 359p.
Silva, V. de P. R. da; Tavares, A. L.; Sousa, I. F. Evapotranspiração e coeficientes de cultivo simples e dual do coentro. Horticultura Brasileira, v.31, p.255-259, 2013. https://doi.org/10.1590/S0102-05362013000200013
Silveira, M. A. G.; Vitusso, L.; Medina, N. H. Distribuição de potássio em cana-de-açúcar. Brazilian Journal of Radiation Sciences, v.3, p.1-8, 2015. https://doi.org/10.15392/bjrs.v3i1A.138
Taiz, L.; Zeiger, E.; Møller, I. M.; Murphy, A. Plant physiology and development. California: Sinauer Associates Incorporated, 2015. 761p.
Testi, L.; Goldhamer, D. A.; Iniesta, F.; Salinas, M. Crop water stress index is a sensitive water stress indicator in pistachio trees. Irrigation Science, v.26, p.395-405, 2008. https://doi.org/10.1007/ s00271-008-0104-5
Trentin, R.; Zolnier, S.; Ribeiro, A.; Steidle Neto, A. J. Transpiração e temperatura foliar da cana-de-açúcar sob diferentes valores de potencial matricial. Engenharia Agrícola, v.31, p.1085-1095, 2011. https://doi.org/10.1590/S0100-69162011000600006